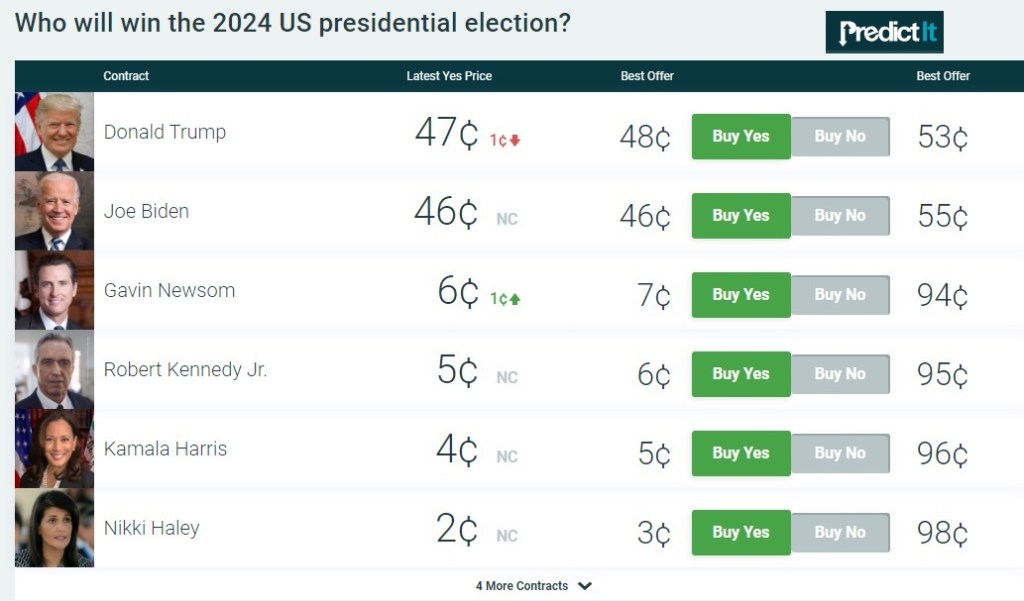
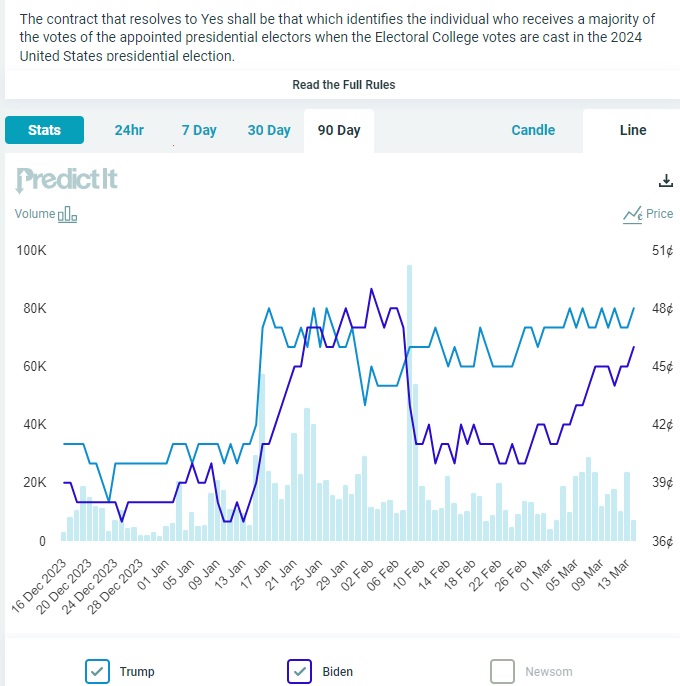
President Biden’s probability of being re-elected, as measured by the betting markets at PredictIt, has closed a 6-point gap between him and the former president. As you can see from the chart, Biden’s predicted probability of being re-elected took a tumble after the special prosecutor’s report labeled POTUS as,
The bettors are predicting a photo finish. Our brain agrees, but our heart feels that it will be much less close than the conventional wisdom.
It’s hard to fathom America may join the ranks of authoritarian countries, but there are many things happening today that leave us shaking our heads.
Lincoln & His Fake Convention Tickets
The monumental impact of the results of the upcoming election on the country and the world has often been compared to that of the election of 1860, which brought President Lincoln to the White House. And if you agree “politics ain’t beanbag,” imagine today the uproar if a candidate snagged their party’s nomination the way President Lincon did from William Seward, who later became his Secretary of State, part of the Team of Rivals.
Lincoln’s Nomination
The 1860 Republican National Convention, held in Chicago, is notable for Abraham Lincoln’s unexpected nomination as the Republican candidate for President, a feat achieved through shrewd political maneuvers, most notably the strategic use of counterfeit tickets by his delegation. Here’s a revised account emphasizing this aspect:
Chicago’s selection as the convention location set the stage for a significant political showdown, with Senator William Seward of New York as the expected nominee.
Lincoln, a lesser-known figure at the time, capitalized on his political acumen and local support to challenge the frontrunner.
Central to Lincoln’s strategy was the ingenious production and distribution of counterfeit tickets by his team.
These counterfeit tickets were used to flood the convention hall with Lincoln supporters, effectively marginalizing Seward’s delegates.
Seward’s camp, led by Thurlow Weed, was initially confident but failed to anticipate Lincoln’s tactical planning and grassroots support.
The convention dynamics were heavily influenced by Lincoln’s ability to control the audience composition, thanks to the counterfeit tickets.
Despite Seward leading after the first ballot, Lincoln’s growing momentum was palpable, aided by his supporters’ overwhelming presence.
The shift in delegate support on subsequent ballots, particularly from Pennsylvania, was a turning point, facilitated by the charged atmosphere favoring Lincoln.
Lincoln’s nomination was secured after three ballots, marked by the strategic use of counterfeit tickets which played a crucial role in his victory.
This pivotal moment underscored Lincoln’s resourcefulness and political insight, setting him on the path to the presidency.
NVIDIA recently reported a monumental performance for the fourth quarter and the fiscal year 2024, marking significant strides in revenue growth across various sectors. The fourth quarter saw revenues soar to $22.1 billion, a staggering 265% increase from the previous year and a 22% rise sequentially. What gets lost in the big numbers is that Data Center revenue, the bulk of NVIDIA sales (80 plus percent), grew by a stunning 409 percent y/y; that’s the AI kicker. folks.
The fiscal year rounded off with $60.9 billion in revenue, climbing 126% year-over-year. A notable highlight is the Data Center sector, which set a new record in the fourth quarter with a 409% increase from the prior year, largely fueled by the high demand for the NVIDIA Hopper GPU computing platform and InfiniBand solutions. This growth trend continued across the fiscal year, with Data Center revenue up 217%.
The surge in demand was primarily driven by large cloud providers, accounting for over half of the Data Center revenue, catering to both internal workloads and external customers. NVIDIA’s AI infrastructure saw broad adoption across various industry verticals, including automotive, financial services, and healthcare. Despite a significant decline in sales to China due to U.S. licensing requirements, Data Center compute and Networking revenue showed robust growth. Thanks to the GeForce RTX 40 SUPER Series GPUs, the Gaming segment also reported growth. Professional visualization and automotive sectors witnessed mixed results, with the latter seeing a slight dip year-over-year and an increase in self-driving platforms.
Base Effects
There will be a dampening base effect, slowing revenue growth. Growing Data Center revenues 4x on the Q4FY23 low base of $3.6 billion will be extremely difficult to repeat on a Q4FY24 base revenue of $18.4 billion.
Gross Margins = 77%
Looking ahead to the first quarter of Fiscal 2025, NVIDIA anticipates the following financial outlook:
The company forecasts revenue to reach approximately $24.0 billion, subject to a plus or minus 2% variance.
Gross margins, on both a GAAP and non-GAAP basis, are projected to stand at 76.3% and 77.0%, respectively, with a potential fluctuation of plus or minus 50 basis points.
Key Facts:
Q4 revenue hit $22.1 billion, up 265% year-over-year.
Fiscal year revenue reached $60.9 billion, a 126% increase from the previous year.
Data Center revenue in Q4 soared by 409% year-over-year.
Fiscal year Data Center revenue grew by 217%.
Over half of Q4 Data Center revenue came from large cloud providers.
Data Center sales to China dropped significantly in Q4.
Data Center compute revenue surged by 488% year-over-year in Q4.
Networking revenue increased by 217% year-over-year in Q4.
Gaming revenue grew by 56% year-over-year, with fiscal year revenue up 15%.
Automotive revenue saw a 4% decrease year-over-year in Q4 but a 21% increase for the fiscal year.
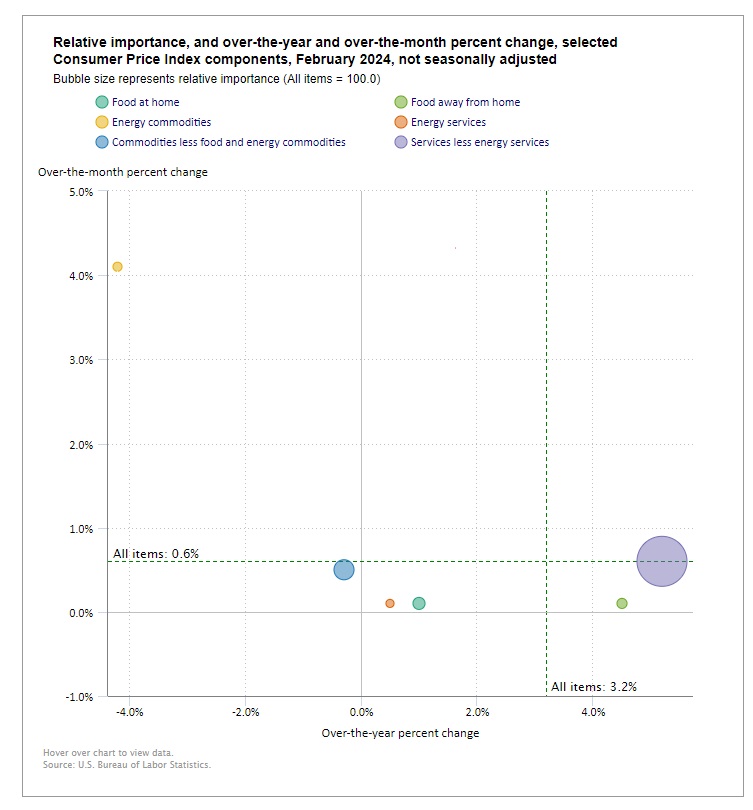
The Consumer Price Index for All Urban Consumers (CPI-U) edged upward by 0.4 percent, a notch above January’s rise, based on the CPI survey conducted by the U.S. Bureau of Labor Statistics. This measure, a barometer of the urban dweller’s cost of living, mirrored the broader passage of time with a 3.2 percent ascent over the past year, unadjusted for the season’s whims.
The fabric of February’s data was woven with familiar and fresh threads. Shelter, steadfast in its significance, rose alongside gasoline, their combined forces accounting for over sixty percent of the month’s increase. Energy surged by 2.3 percent, igniting all its components in a shared glow, while food remained constant, a still point in the turning world. Beyond the sustenance and warmth of food and energy, other realms too felt the touch of change: shelter, airline fares, and apparel among them, each contributing their verse to the month’s narrative. Yet, not all moved upward; some, like personal care and household furnishings, receded slightly, a reminder of the constant ebb and flow. Through it all, the landscape of costs painted a picture of growth over the past year, with the all-items index rising by 3.2 percent and its counterpart excluding food and energy, marking a 3.8 percent climb, a testament to the underlying price stickiness.
February’s CPI-U increased by 0.4 percent, slightly higher than January’s 0.3 percent rise.
The 12-month period ending in February saw the all items index rise by 3.2 percent.
Shelter and gasoline significantly contributed to February’s CPI increase.
The energy index experienced a notable rise of 2.3 percent in February.
The all-items index, excluding food and energy, grew by 3.8 percent over the last 12 months.
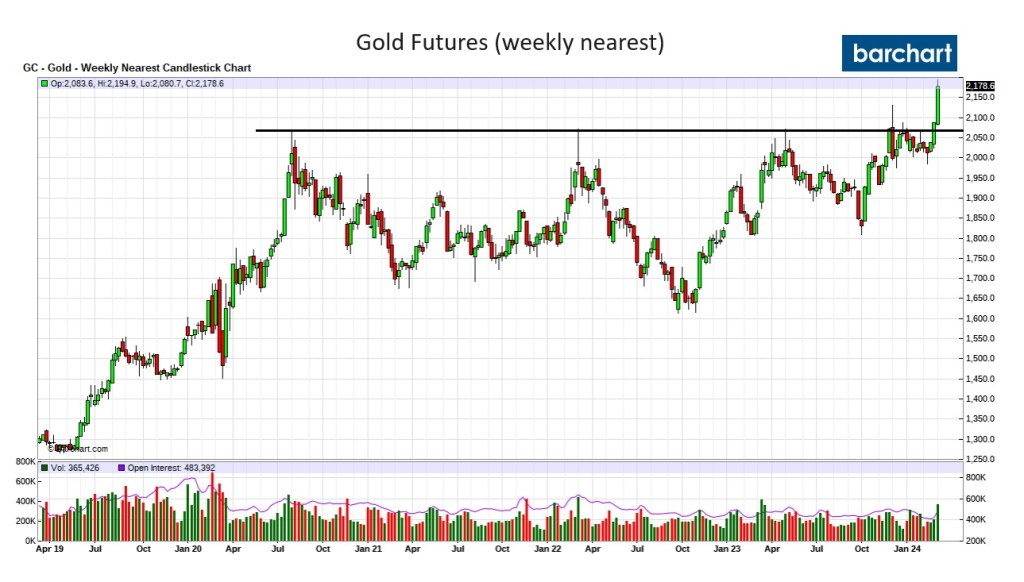
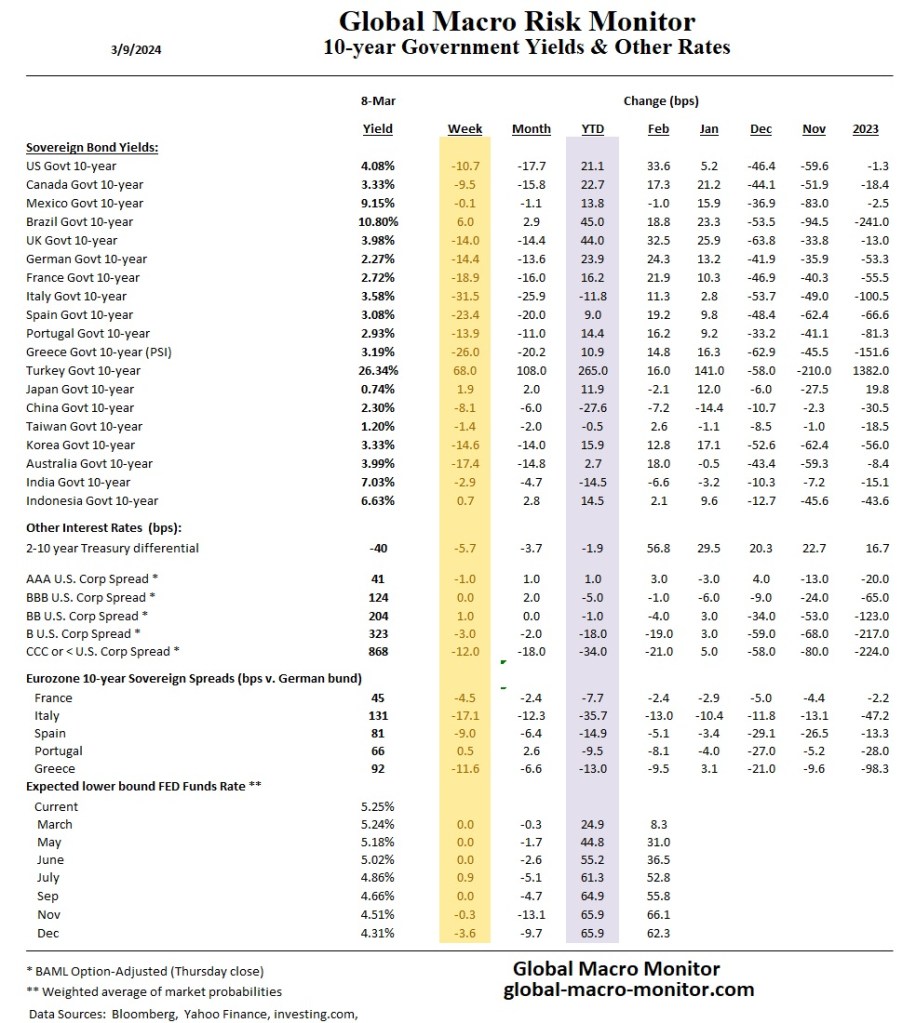
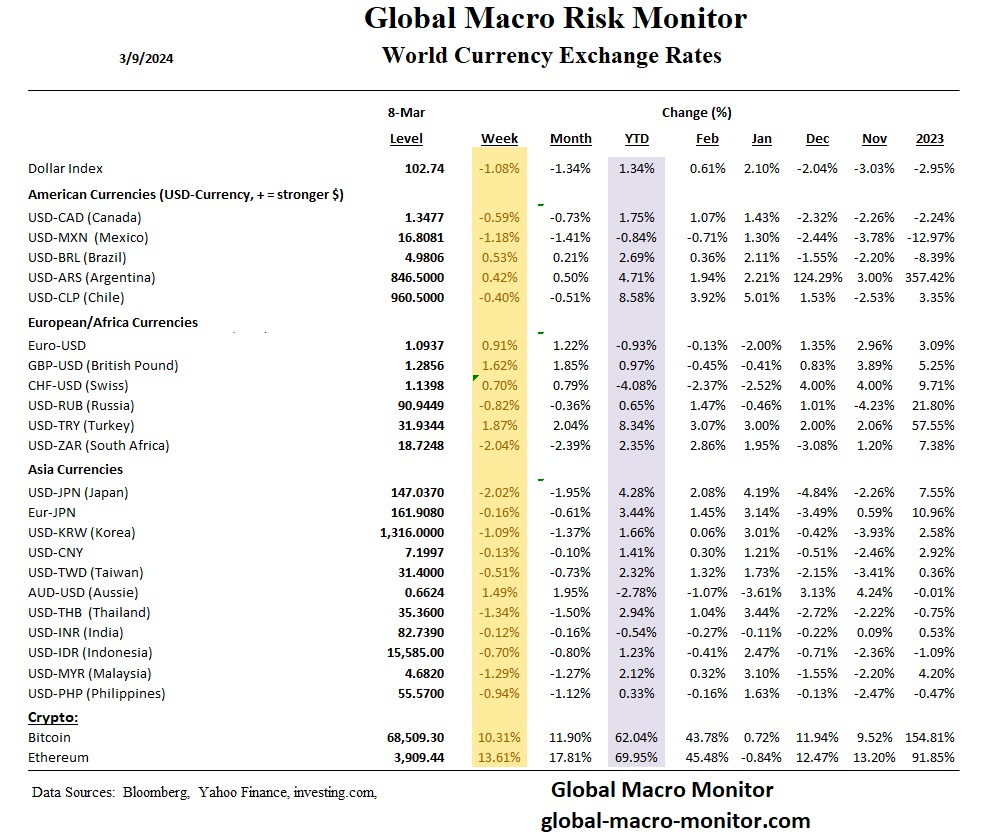
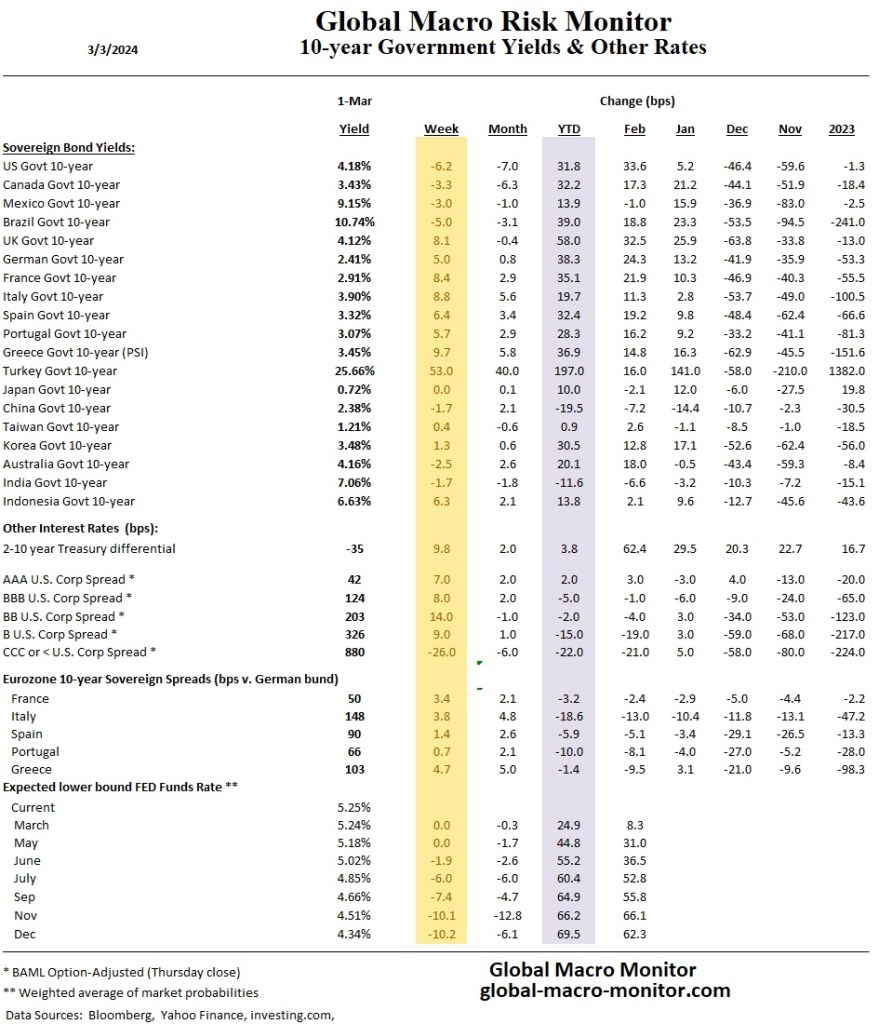
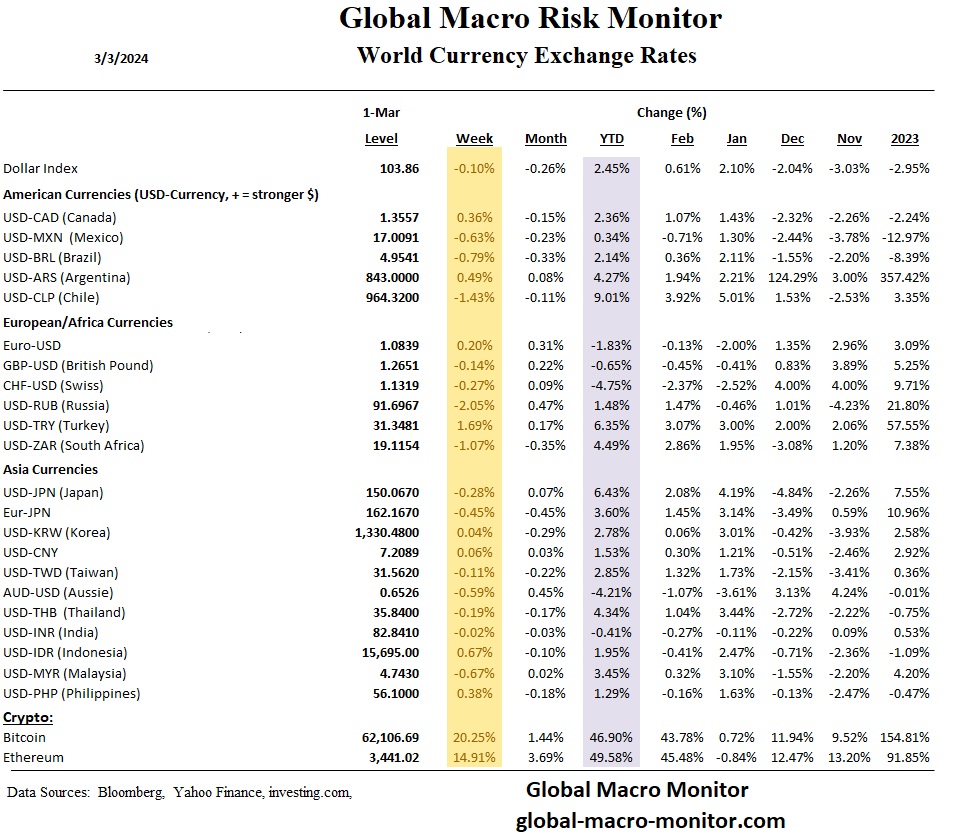
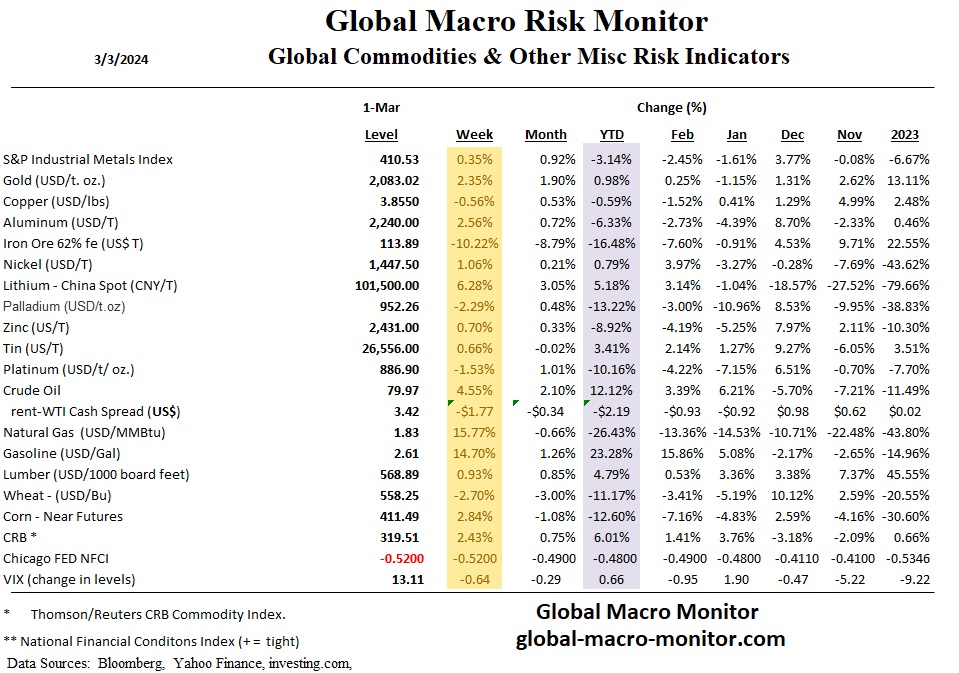
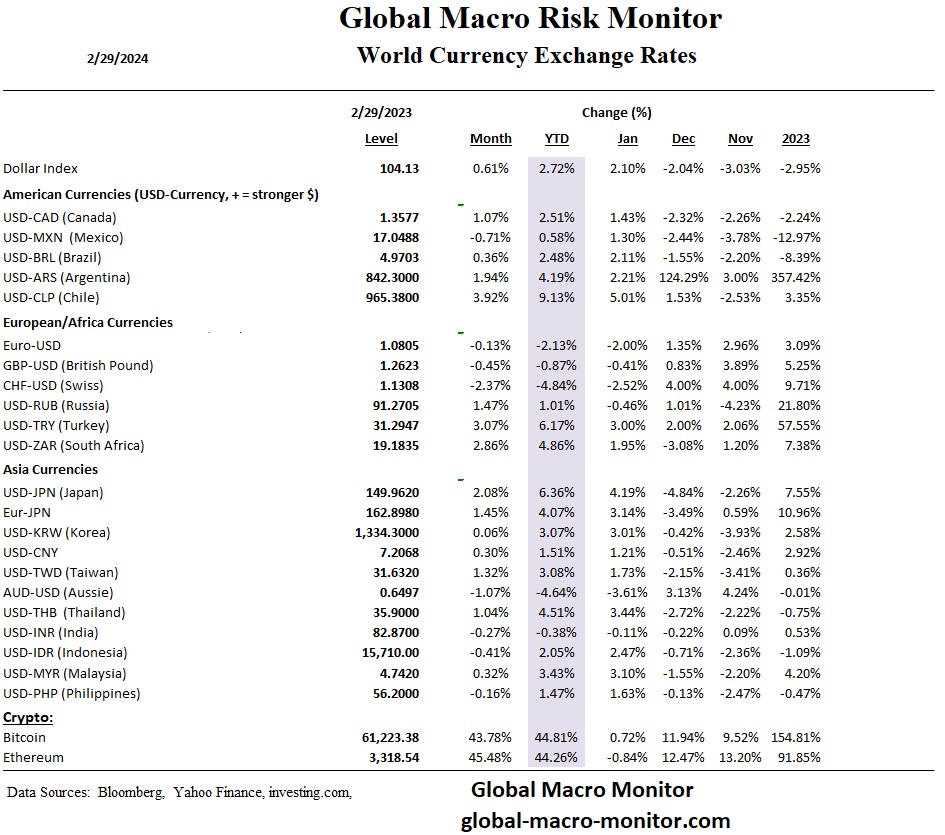
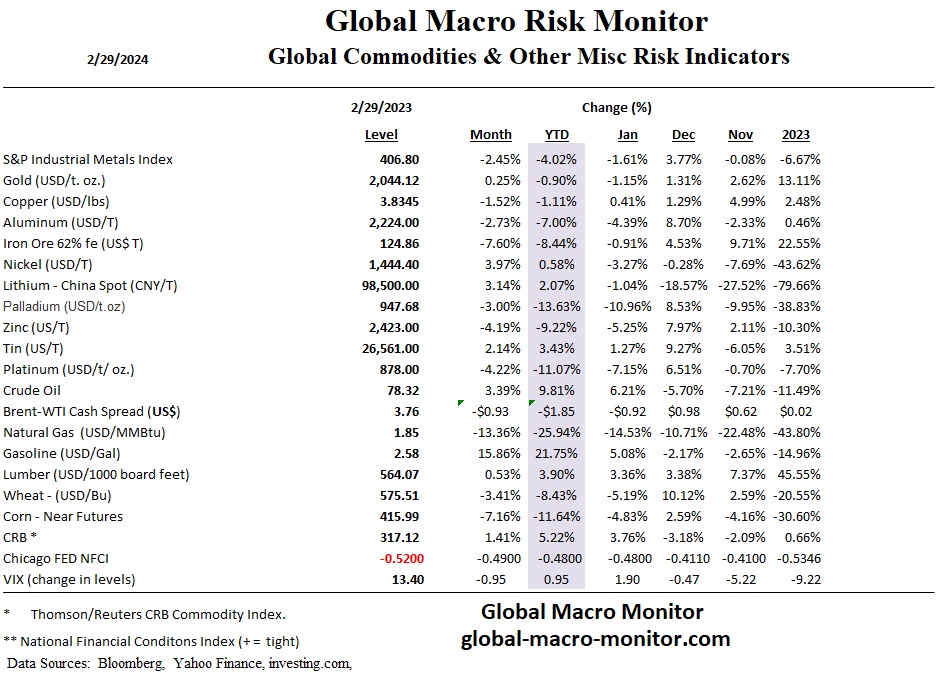
Gold is breaking out to new all-time highs. The market’s conventional wisdom is that it is mainly driven by the expectation the Fed will cut rates in June. The dollar index (dominated by the euro) is still up over 1 percent for the year.
“We still believe the same underlying premise remains, which is the combination of the expectation that the Fed is still going to cut rates later this year and dollar weakness,” said David Meger, director of metals trading at High Ridge Futures. – Reuters
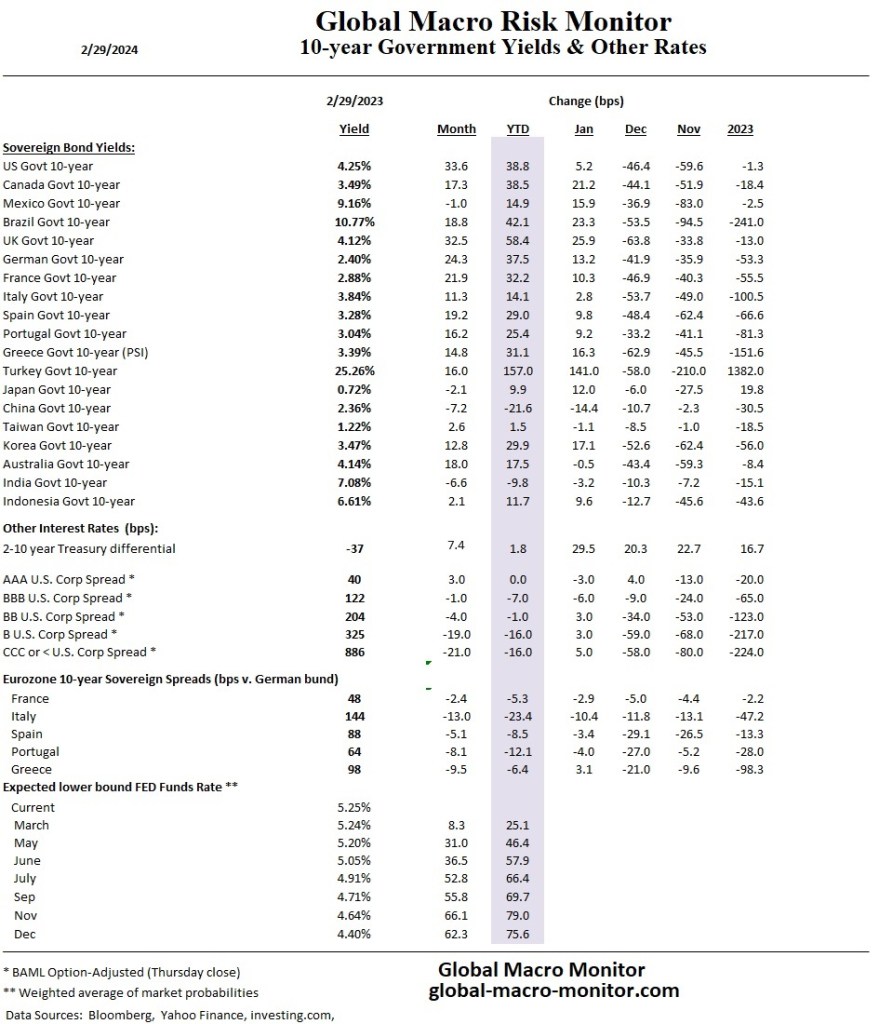
This makes zero sense to us as the market has priced out two rate cuts for the June meeting since the beginning of the year (see our Yields table). Moreover, according to the Chicago Fed’s National Financial Conditions Index, liquidity conditions tightened last week (see our Global Commodities table)
Nobody knows for sure, but our best guess is it’s a safe haven play with expected domestic and geopolitical instability to increase as the year progresses. Stay frosty, folks.
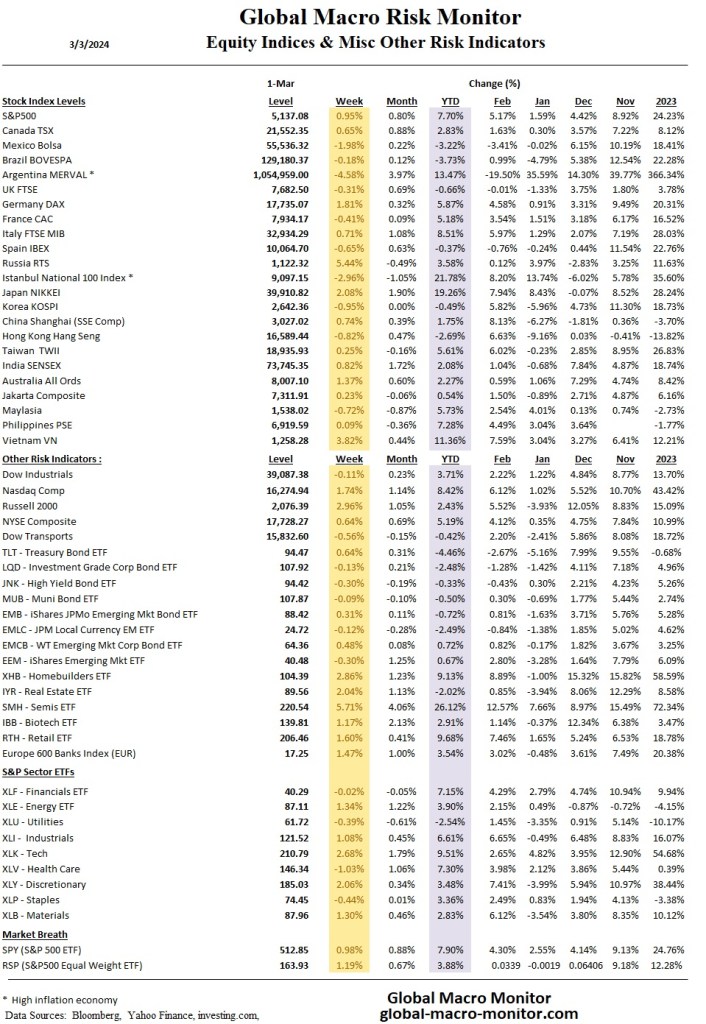
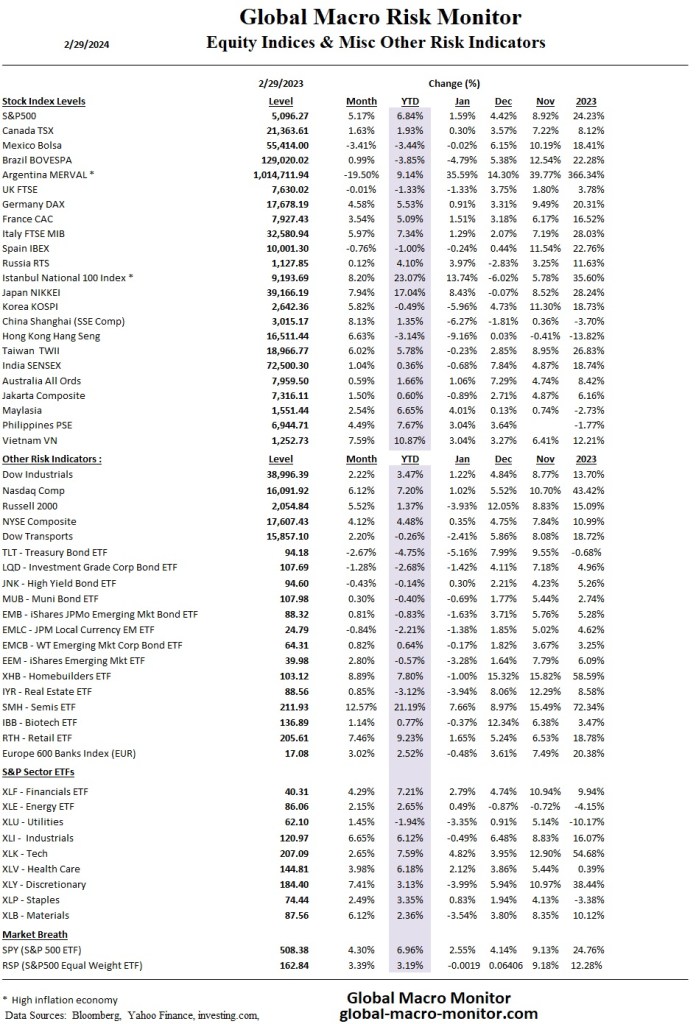
We have added the Mag 7 to our equity table. Some have not performed so magnificently year-to-date. Watch this space. And what’s up with gold breaking out to new highs? Watch that space.
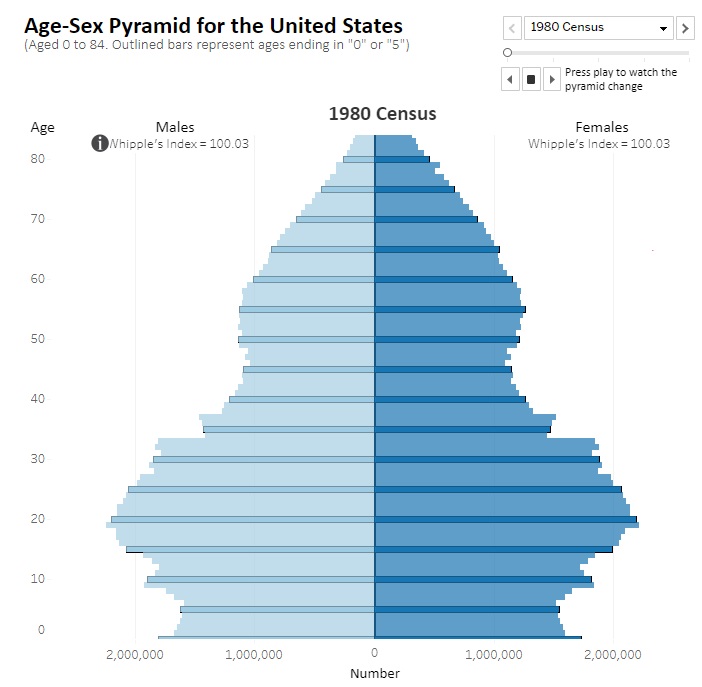
Demographers describe the baby-boom generation as ”the pig in the python,” which refers to a visual and descriptive metaphor for how a large age cohort (the “pig”) moves through the demographic structure (the “python”) over time. It illustrates the bulge or significant impact this group has on various aspects of society, including the economy, housing market, and social services, as it ages. Graying boomers now make up the bulk of the python’s tail, however, enter the new pig: “peak millennials” (PMs).
“It’s Me, Hi, I’m the Problem. I’m 33”
The New York Times ran a good article today reflecting on PMs — individuals born between 1990 and 1991 who are part of American history’s most significant demographic cohort. The piece narrates the life decisions of PMs, noting how these often coincided with broader trends among their peers, such as attending college during a time of record matriculation rates, moving to urban centers, struggling with student debt, buying homes during a housing market surge, and marrying in a year with a high number of weddings.
The narrative underscores this demographic’s economic and societal impact, illustrating how their collective actions have shaped market trends, real estate dynamics, and cultural shifts. The article delves into the challenges and pressures of being part of this densely populated group, highlighting the effects on housing, education, employment, and family planning while also touching on broader implications for future economic conditions and social structures.
Key Points:
“Peak millennials” are individuals born around 1990 and 1991, who represent the largest age cohort in America.
Their major life decisions often align with broader generational trends, impacting housing, education, and the economy.
Peak millennials have shaped market trends, including the rise of the “experience economy,” the popularity of tiny homes, and shifts in fashion.
Their entrance into higher education and the job market coincided with significant spikes in enrollment and competition for employment, respectively.
The demographic’s move towards home ownership in recent years has contributed to fluctuations in the housing market.
Financial challenges, including student debt and the high cost of living, have marked the economic experience of this group.
The demographic shift is expected to influence future housing demand, with a continued interest in entry-level single-family homes.
The group’s large size has exerted pressure on various institutions, from colleges to housing markets, reshaping supply and demand dynamics.
As this cohort ages, it could impact the labor market, potentially benefiting younger generations with less competition for jobs.
Long-term economic and societal implications include potential challenges related to retirement, healthcare, and generational support structures.
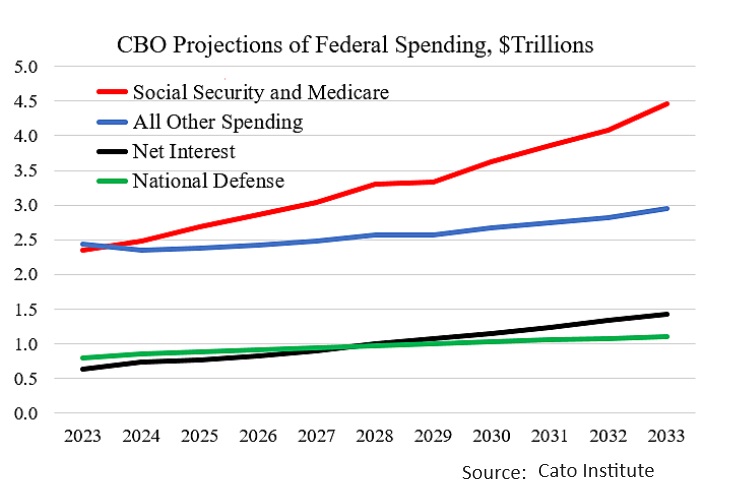
The size of PMs is not large enough to bail out social security and medicare.
Social Security and Medicare are the primary factors contributing to escalating federal budget deficits and debt, as indicated by the charts below using data from the Congressional Budget Office (CBO). The total expenditure for these two senior programs is expected to surge from $2.35 trillion in 2023 to $4.46 trillion by 2033. At that point, Social Security and Medicare expenditures will quadruple the national defense spending.
Dependency Ratio
The dependency ratio is a measure of the number of dependents aged zero to 14 and over the age of 65, compared with the total population aged 15 to 64. This demographic indicator gives insight into the number of people of non-working age, compared with the number of those of working age.
It is also used to understand the relative economic burden of the workforce and has ramifications for taxation. The dependency ratio is also referred to as the total or youth dependency ratio.
KEY TAKEAWAYS
The dependency ratio is a demographic measure of the ratio of the number of dependents to the total working-age population in a country or region.
This indicator paints a picture of the make-up of a population compared to its workforce and can shed light on the tax implications of dependency.
As the overall age of the population rises, the ratio can be shifted to reflect the increased needs associated with an aging population.
Formula for the Dependency Ratio
Dependency Ratio = # Dependents/Population Aged 15 to 64
What Does the Dependency Ratio Tell You?
A high dependency ratio means those of working age, and the overall economy, face a greater burden in supporting the aging population. The youth dependency ratio includes those only under 15, and the elderly dependency ratio focuses on those over 64.
The dependency ratio focuses on separating those of working age, deemed between the ages of 15 and 64 years of age, from those of non-working age. This also provides an accounting of those who have the potential to earn their own income and who are most likely to not earn their own income.
Various employment regulations make it unlikely that individuals less than 15 years old would get employed for any personal income. A person who turns 64 years old is generally considered to be of normal retirement age and is not necessarily expected to be part of the workforce. It is the lack of income potential that generally qualifies those under 15 and over 64 as dependents as it is often necessary for them to receive outside support to meet their needs.
An Analysis of Dependency Ratios
Dependency ratios are generally reviewed to compare the percentage of the total population, classified as working age, that will support the rest of the non-working age population. This provides an overview for economists to track shifts in the population.
As the percentage of non-working citizens rises, those who are working are likely subject to increased taxes to compensate for the larger dependent population. – Investopedia
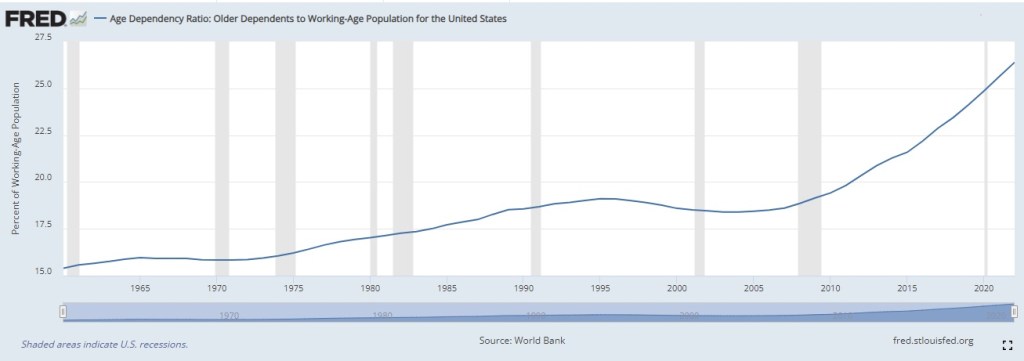
U.S. Age Dependency Ratio: Older Dependents to Working-Age Population
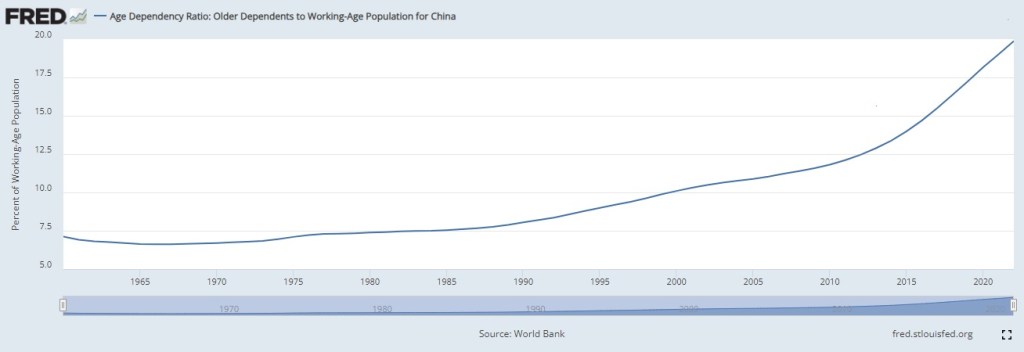
China Age Dependency Ratio: Older Dependents to Working-Age Population
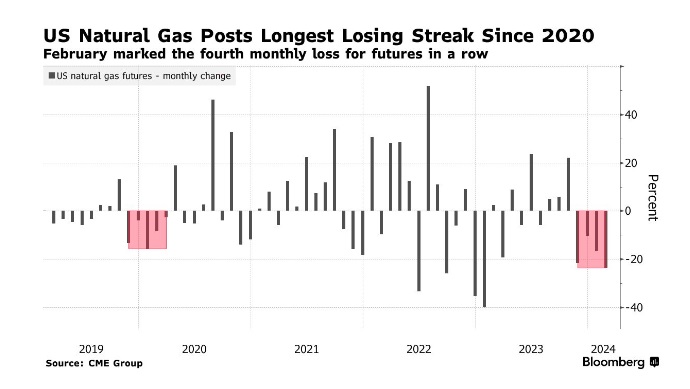
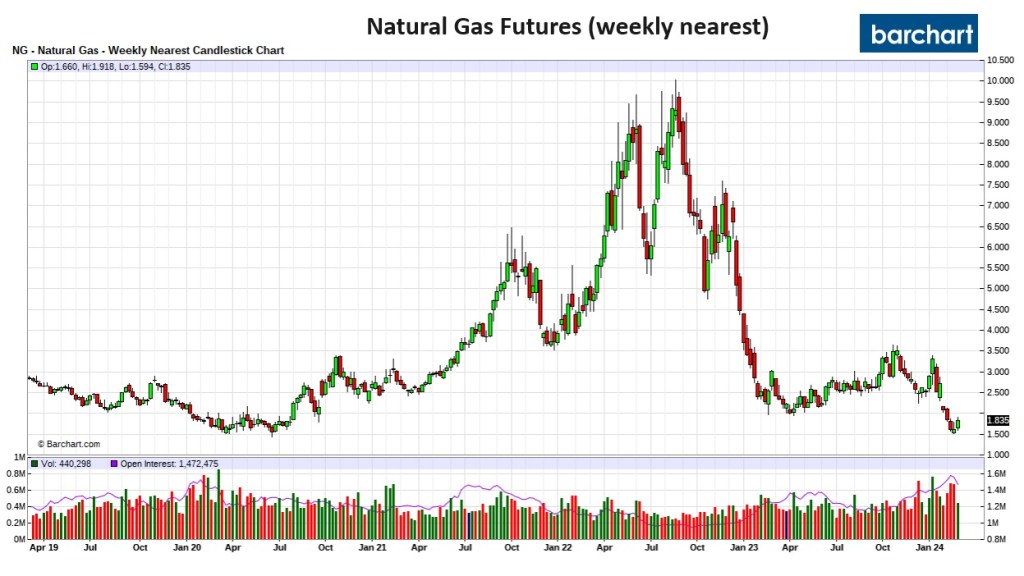
Oh, Nattie, you beast! You are the “widow maker.“. You have hurt us so many times.
Natural Gas
US natural gas futures capped a fourth monthly loss in February after prices plummeted to lows not seen since June 2020. An unusually mild North American winter has dampened demand for the home-heating fuel as production soared, prompting the longest streak of monthly declines for gas contracts since the beginning of the pandemic. Analysts expect prices to remain depressed for awhile, given that forecasts show unseasonably warm weather for much of the next month. Meanwhile, US inventories continue to hover well above typical seasonal levels, with stockpiles in the latest week sitting about 27% above the five-year average — adding further pressure to prices. – Bloomberg