
(click here if table is not observable)
(click here if table is not observable)
Tough day for America, tough day for Boston, tough day for the markets. Our hearts and prayers go out to those involved and their families in this senseless tragedy.
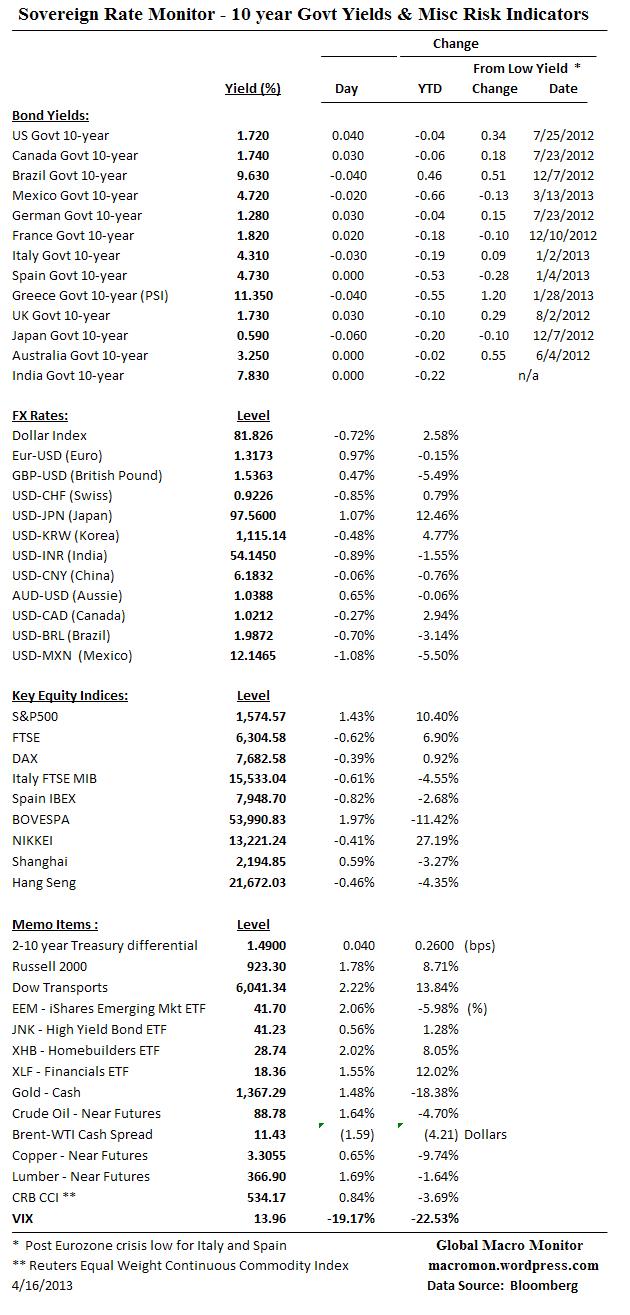
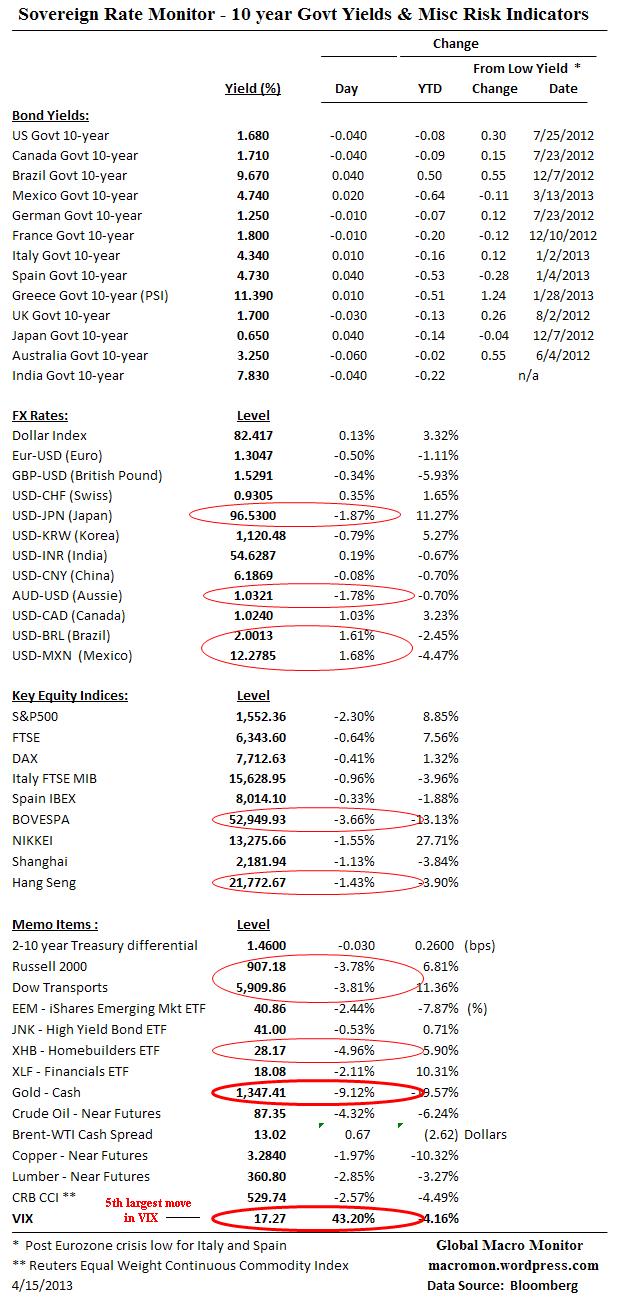
The ugly selling in commodities finally hit stocks. The breakout now looks like a fake out and 1538 looms for the S&P500, the bottom of the range it had traded for weeks before breaking to new highs.
The gold ETF experienced its worst day and two days in its history. The VIX was up over 43 percent today, it’s 5th biggest daily increase in its history.
This feels like its coming out of China. Can’t be certain, but you know how we feel about their economic model.
Let’s wait for the quality of the bounce. Those who haven’t bought past sell-offs have found themselves panicking and chasing the market higher if they waited to long. This one feels a little more serious and were not that anxious to buy it yet.
Did some work over the weekend, which we will post later. Looking at stock market cap to GDP and corporate profits to GDP it’s difficult to rationalize a major move higher from current levels unless nominal GDP really accelerates (= change in monetary policy) and/or corporate profits continue to take record share of GDP.
That, of course, assumes a rational market and no bubbles. Bubbles? Never!
(click here if chart is not observable)
(click here if table is not observable)
What a nice guy. Couldn’t be happy for him. Remember, it was Greg Norman’s in the 2009 Presidents Cup when Adam was in a huge slump. Norman took heat to give AS a confidence boost. That, and Stevie Williams on the bag dig the trick. Congrats to AS and the Aussies! May it not be your last Green Jacket.


(click here if pictures are not observable)
 Will it be El Pato? Is the Pope Argentine? Just askin’.
The only time my prayers are never answered is on the golf course.
– Billy Graham
The Duck hits a long ball! During the 2009 Presidents Cup we were standing on the 18th fairway at Harding Park (see picture) by the clubhouse and Angel almost hit us with his drive. He was a good 50 years longer than anyone else. Is Bernhard Langer? Maybe not, but he is one of our faves and at 55 years only 5 shots out!


19th Hole Fodder
· The longest drive ever is 515 yards. The longest putt ever is a monstrous 375 feet.
· The term birdie comes from an American named Ab Smith. While playing 1899, he played what he described as a “bird of a shot”, which became “birdie” over time.
(click here if video is not observable)
The Relative Strength Index (RSI) is a momentum oscillator that measures the speed and change of price moves. The RSI moves between zero and 100 and is considered overbought with a reading above 70 and oversold when below 30. Note the RSI can sustain an overbought (oversold) reading in a strong up (down) trend.
Click chart to enlarge.

(click here if chart is not observable)
Technical Moves:
Reclaiming 20-day moving average
S&P500, Nasdaq, Russell 2000, Mexico IPC, Australia ASX
Reclaiming 50-day moving average
Russell 2000, FTSE
Reclaiming 100-day moving average
Russell 2000, FTSE
Reclaiming 200-day moving average
France CAC, Mexico IPC
Breaking 100-day moving average
Shanghai Composite
Breaking 200-day moving average
Korean KOSPI, India SENSEX


(click here if charts are not observable)


(click here if charts are not observable)
 Speaker(s): Dr Ben S Bernanke, Olivier Blanchard, Professor Lawrence H. Summers, Axel A. Weber
Chair: Professor Sir Mervyn King
Recorded on 25 March 2013 in Old Theatre, Old Building.
(click here if video is not observable)
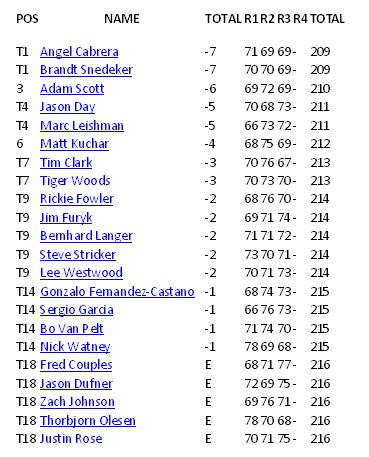
Jason “Make My” Day! Click here for leaderboard.
Not since 1996 and Greg Norman has an Aussie been on top of the leaderboard going into the weekend. We love our Aussie friends and it would be great to see a winner from down under.
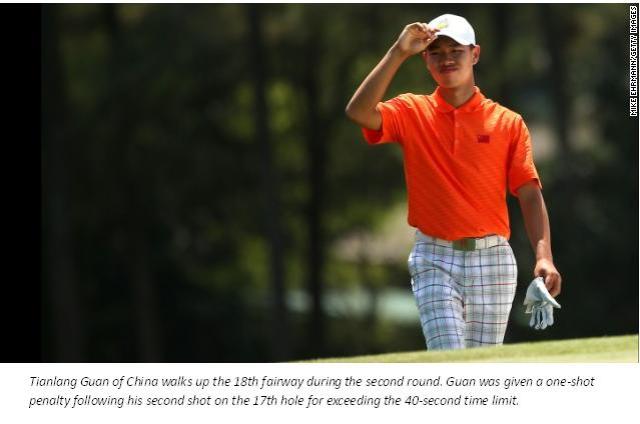
How ’bout the 14-year old kid, Tianlang Guan, making the cut? Even more impressive was his response to being assessed a penalty for slow play. “A rule is a rule.” No whining. Unlike us westerners who have a sense entitlement, the rules don’t apply to us and are made to broken. That, friends, is what amazes us most about the Asian culture. No sense of entitlement. Look how Japanese society handled the tsunami.
The equipment makers must be drooling over the kid from China. Imagine if 300 million Chinese begin to pick up the sticks! By the way, Callaway Golf dropped 6 percent today on analyst downgrades saying the company will be hurt by the weaker Japanese Yen. Or was it Phil’s 4 over par? Ain’t markets efficient?


(click here if video and charts are not observable)

