The Economist Gets It…

That is, why governments need asset bubbles as the average real wage falls.   See our post, America’s Bubble Dependent Economy.

This also goes a long way in explaining the reelection of President Obama even with stubbornly high unemployment and a weak economy — and also why the economy is so weak.

(click here if video is not observable)

Posted in Policy, Politics | Tagged , , | Leave a comment

VIX Has Largest Weekly Down Move Since Inception

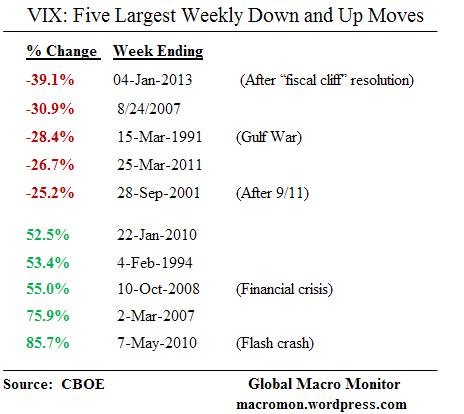
The CBOE has a nice piece out noting this week’s 39.1 percent collapse in the VIX was the largest weekly percent down move since the index was launched in January 1990.  The week also saw record volume days for the VIX futures.

The move even exceeds the largest weekly down move on the VXO, the vol index on the S&P 100, which was the market standard volatility measure prior to January 1990.   The VXO fell 37.9 percent the following week of the of the October 1987 stock market crash.

Since the March ’09 stock market bottom the VIX has only closed lower twice, on August 13 and 17, 2012.    Note the July VIX futures contract closed the week at 21.40, 53 percent above the cash index.

Jan5_VIX Moves

The upshot?

Nassim Nicholas Taleb is probably less comfortable.  It’s also difficult to extract much info from this move relative to the others given the rise of high frequency trading and short-term trader dominance of the markets.  Furthermore,  the move was likely exaggerated by the fact it happened during a major holiday shortened week with many of the big players still out and yet to begin their year.

Nevertheless,  some believe stocks will only return 5 percent this year and given the huge move last week the gains for the year have already been had.  We don’t know with certainty but our priors are this year could be bubblicious and the central banks will see to it until they can’t.

This could be the tipping point year where markets revolt against deficits and hyper loose monetary policy, or maybe not.   For now, the markets enjoy the crack, the trend in equities is positive, and new highs are at hand.

Given this week’s huge move, coupled with the fact earnings season really gets going next week,  it’s probably not a good entry here, however.

We also thought that about dollar/yen at 85, but the yen keeps repricing lower just like an imbalanced emerging market currency with high inflation.  Granted it was hugely oversold, but 12 percent since November 9th?  Tokyo is not Buenos Aires, Toto!  At least, not yet.

We always worry when central banks print money to monetize deficits and fear that money demand could collapse as holders begin to lose confidence in its future purchasing power.   We have seen this happen, first hand, in many countries and have been in Brazil, for example,  when there was not much food in grocery stores as locals had lost confidence in the central bank’s ability to maintain the purchasing power of their currency holdings.

Stocks will move higher and the currency lower as this begins.   Though gold has been trading poorly and may have more downside on a technical basis, it should also begin to move as the printing presses begin to fire up.  Asset picking becomes more complicated when most of the hard (well not so hard) currency central banks are expanding their balance sheets on such a massive scale.  This is nitro when credit begins to expand.

Though they lengthened the duration of their portfolio with Operation Twist, the Fed’s balance sheet has been stable since the end of QE2.  So this year should be interesting if Chairman Bernanke follows through with the announced trillion dollar asset purchase.   Add that to the expected monetization the yen and Nikkei are pricing from the Bank of Japan and the potential for OMTs from the ECB with, say,  a Spanish or Italian intervention, which will surely not be completely sterilized.

Furthermore,  credit markets are starting to heal and the monetary aggregates are growing at an annual rate well in excess of nominal GDP growth.  That’s more yield/return chasing liquidity.   Could be wrong, but think we’re in for some Fireworks!

Jan5_VIX(click here if charts are not observable)

Posted in Global Stock Performance, Monetary Policy, Sovereign Debt | Tagged , , , | 4 Comments

Weekend Lecture: Antifragility

Short, sweet, and social for the millennials this weekend.

Essayist Nassim Nicholas Taleb on how we can benefit from disorder.    –  AlJazeeraEnglish

(click here if video is not observable)

Posted in Lectures | Tagged , | 5 Comments

U.S. Equity Sector ETF Performance – January 4

ETF_WeekETF_YTDETF_Technicals(click here if charts and table are not observable)

Posted in Sector ETF Peformance | Tagged , , , , , , , | 2 Comments

Weekly Eurozone Watch: Spread Compression Continues

Key Data Points
German 10-year Bund 23 bps higher;
France 8 bps tighter to the Bund;
Ireland 35 bps tighter;
Italy 46 bps tighter;
Spain 43 bps tighter;
Portugal 91 bps tighter;
Greece 88 bps wider;
Large Eurozone banks rise 4.0 to 6.30 percent;
Euro$ down 1.08 percent.

Comments
– Sovereign spreads to the Bund continue to fall sharply;
– European unemployment increase to 20m in the second half of 2013 up from 18.7m in October according to Ernst & Young;
– France’s Constitutional Council struck down and ruled President Hollande’s 75 percent top income tax rate anti-constitutional.

Jan4_Mario Monti

An Irish recovery would provide a boost for Europe and its de facto leader, Angela Merkel, the German chancellor, as much as for Ireland and its prime minister, Enda Kenny. It would show that the controversial treatment of austerity and structural reforms imposed as the price of bail-outs can work. It would reassure the electorates of core Europe, especially German voters who go to the polls in the autumn, that rescues do not condemn them to a never-ending call upon their taxes, as seems to be the case with Greece. And a sustained return by Ireland to the bond markets would boost confidence more generally, helping other bailed-out economies such as Portugal and Spain.

Economist

WEZ_Spread_WeekWEZ_Bank_WeekWEZ_Spread_YTDWEZ_Bank_YTDWEZ_YieldsWEZ_EuroFX(click here if charts are not observable)

Posted in Weekly Eurozone Watch | Tagged , , , , , | 2 Comments

Construction Employment Starting to Rebound

Though payrolls came in just below expectations, one positive take away from this morning’s data was the 30 thousand increase in construction jobs.   Almost all of the increase was in residential.   These are relatively well paying jobs compared to retail clerks, waiters, bartenders, and health care workers, which have led the payrolls recovery.

We’ll take 30K construction jobs over 40K retail clerk jobs.  Quality matters.

The huge run in lumber futures has been signalling the nascent housing recovery and the exordium of construction hiring.  Increased demand from the U.S. housing sector and China’s rebound, coupled with reduced timber production in Russia have driven lumber futures to a seven year high.  This is real time leading indicator, similar to Dr. Copper,  that should be on your radar.

Nevertheless, total employment in construction is still 2.2 million less than where it was at its April 2006 peak.   It is one of the few sectors that has yet fully regain the jobs lost in the Great Recession.

We doubt the sector will be building the equivalent of a Cleveland, Ohio every few years as it was at the height of the bubble,  but here’s to hoping the recovery in construction hiring  is just beginning.  Long may you run!

Jan4_Constuction

Jan4_Lumber

(click here if charts are not observable)

Posted in Employment, Uncategorized | Tagged , , , | Leave a comment

U.S. Employment Situation – December 2012

Looks like construction hiring  is starting to kick in.   We’ll post something more on this later today.

The BLS reported this morning,

Nonfarm payroll employment rose by 155,000 in December, and the unemployment rate was unchanged at 7.8 percent, the U.S. Bureau of Labor Statistics reported today. Employment increased in ealth care, food services and drinking places, construction, and manufacturing…

The civilian labor force participation rate held at 63.6 percent in December. The employment population ratio, at 58.6 percent, was essentially unchanged over the month.

Jan4_Employment1Jan4_BLS_employment2Jan4_BLS_employment3

(click here if charts are not observable)

Posted in Employment | Tagged , , , | 1 Comment

Stratfor: 2013 Annual Forecast Preview

This is a great preview of the potential geopolitical swans you should monitoring in 2013.

Stratfor’s Vice President of Global Analysis Reva Bhalla discusses the key geopolitical developments for 2013.
For more analysis, visit: http://www.Stratfor.com

(click here if video is not observable)

Posted in Black Swan Watch, Geopolitical | Tagged , , | Leave a comment

America turns European – Can-kicking is a transatlantic sport

Merde!

This week’s Economist cover story,  America’s Turns European,  has pulled the curtain from the Wizard of Oz!

FOR the past three years America’s leaders have looked on Europe’s management of the euro crisis with barely disguised contempt. In the White House and on Capitol Hill there has been incredulity that Europe’s politicians could be so incompetent at handling an economic problem; so addicted to last-minute, short-term fixes; and so incapable of agreeing on a long-term strategy for the single currency.

Those criticisms were all valid, but now those who made them should take the planks from their own eyes. America’s economy may not be in as bad a state as Europe’s, but the failures of its politicians—epitomised by this week’s 11th-hour deal to avoid the calamity of the “fiscal cliff”—suggest that Washington’s pattern of dysfunction is disturbingly similar to the euro zone’s in three depressing ways.

Click here to read full article.

We wonder if and when the can kicking turns into the market ass kicking that Europe experienced over the past years?   Toto, I have a feeling we’re not in Kansas anymore.

Jan3_America Turns Europe

(click here if picture is not observable)

Posted in Fiscal Policy, Geopolitical, Politics | 1 Comment

America’s Bubble Dependent Economy

Interesting chart (which we marked up) from the JEC of the U.S. Congress illustrating household net worth as a percent personal income.   If that doesn’t look like a head and shoulders formation in the making, nothing does!

The second chart illustrates why the U.S. economy is so dependent on the wealth effect generated by asset bubbles.   It’s stunning to think that average real earnings in the U.S. are almost 11 percent lower than where they were in 1973.

Policymakers’ focus should be on increasing worker productivity through: 1) reforming the country’s education system;  2) unleashing entrepreneurship;  and 3) in the words of ECB chief, Mario Draghi, “doing whatever it takes” to empower small businesses.

This is tough political business, however, so we take the easy way out.   The political pandering increases budget deficits, forcing the Fed to repress interest rates and print money to drive up asset prices.   The boom side of the cycle is sustained longer than most expect because of the reserve currency status of the dollar.  This temporarily generates artificially inflated demand (i.e, fake) through the wealth effect, which eventually collapses when asset markets crash.

Wash, rinse, repeat.

This is not a good long term economic strategy and sustainable path for permanent wealth creation, folks.  It probably won’t change until it is forced upon us and then the adjustment will be more abrupt and disruptive than if policymakers were more pre-emptive.

America needs Mario Monti!

Jan2_Household Net WorthJan2_Real Wages(click here if charts are not observable)

Posted in Economics, Employment, Politics, Wages | Tagged , , | 7 Comments