Godspeed, Steve Jobs….

Global Macro Monitor is one of Mr. Jobs’ biggest fans.  We believe he’s rebuilt Apple into the world’s best company.  We’re praying for his speedy recovery and full return to health.

We have no idea how this will play out over the next few days and why Apple decided to make the announcement on the eve of earnings.   Our paranoid inner game theorist thinks it may be a signal that margins could disappoint tomorrow and the company timed the announcement to deflect attention and blame it for a potential sell-off.

It’s our sense the iPad, which made-up 14 percent of last quarter’s revenues,  has a lower profit margin than other products.   As the iPad grows in proportion to total revenues,  Apple’s overall profit margin declines.

A more positive spec is that maybe the announcement was timed to take some air out of the stock prior to earnings to allow it some room to move higher on a decent earnings beat;  or that sales and earnings will be so strong the stock will be able to absorb the Jobs announcement without inflicting too much damage on shareholders.    Who knows and that is what makes a market.

We know one thing, however, is that historically when the stock runs up too much prior to earnings, the company has to beat estimates by a large margin for the run to continue.   As of Friday’s close, Apple was up over 8 percent in the first two weeks of the year.

The company really needs to address the succession issue on the conference call, but probably won’t.  This will be both a big test for Apple’s red hot stock and for the overall market.   From a longer term macro perspective, this, like most other things the media obsesses over in the short-term, is just noise.    Godspeed, Steve Jobs!


Posted in Apple, Equities | Tagged , | Leave a comment

Shanghai Breaks 200-day, Commodites Next to Roll?

During the 1990’s when the emerging markets were still emerging a friend of ours wrote a research report on pre-restructured busted Russian debt titled, No Rush to Buy, No Russians Buying.  The point was the Russians knew the prospects for the debt much better given the country’s lack of transparency and the general relative ignorance of foreigners.

Back then the market also traded Nigerian debt and Brady Bonds based on whether or not the country’s generals were actively buying the debt as the military was the ultimate insider as to whether the next coupon would be paid.  The same concept – insiders know best — applies for those who closely follow the buying and selling of stocks by company insiders or management.

Given our confessed lack of ignorance on what is really happening in China’s economy, we look at visible indicators to get a sense of what it truly going on, such as the stock market. Market indicators are far from perfect and not always reliable, but it sure the heck beats guessing, “shooting in the dark,” or trusting your capital to the market cheerleaders.

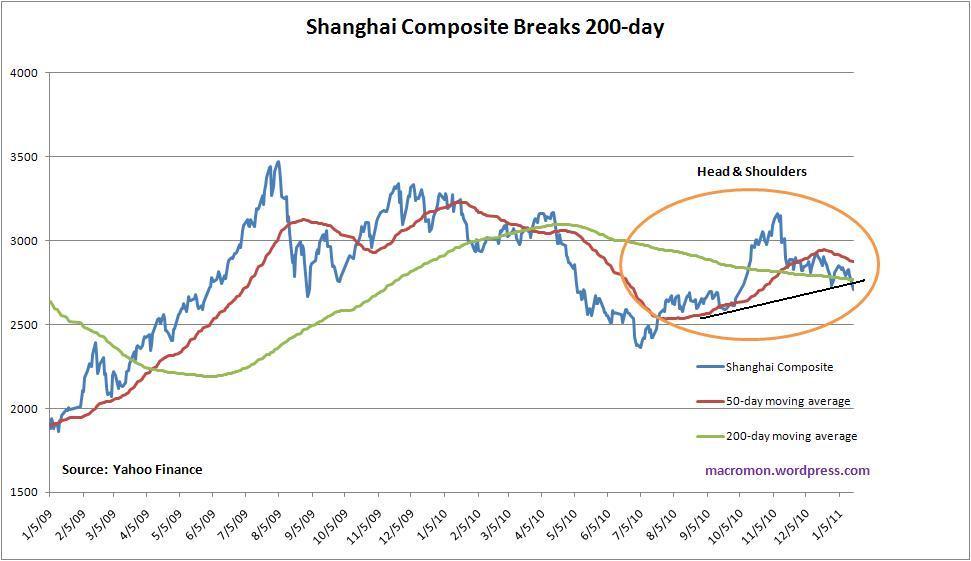
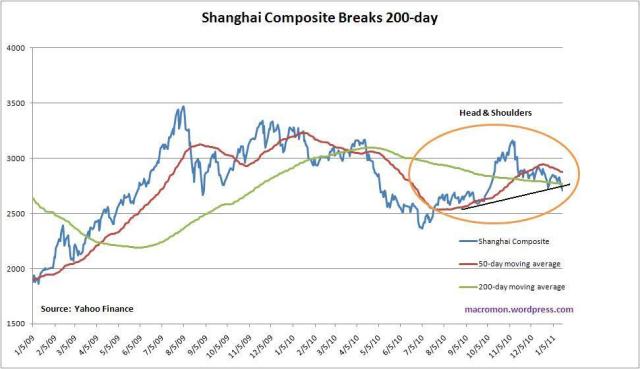
Last night the Shanghai Composite broke key support of the 200-day moving average and the neckline of a technical head and shoulders (H&S) pattern.  The chart below shows the price point of the current break is lower than the penetration of the 200-day in late December, which is reflective of the short-term downtrend.  The next key support level is 2, 600.

The markets have been flakey of late, however, as there have been several recent H&S topping patterns, including in the Hang Seng and the $/Euro, which have proved unreliable sell signals.  Given the seriousness of Asian policymakers to fight inflation and to limit property bubbles, however, we give the Shanghai H&S and 200-day cross a higher probability of following through.   P&G must be minting coin with all the traders reaching for the H&S these days!

This leads to our next concern.  Given the commodity story is driven and dominated primarily by the China theme, we think there is a pretty good chance this sector could roll over in the near term.  Commodities are a very crowded trade and our sense is the levered community is massively long.

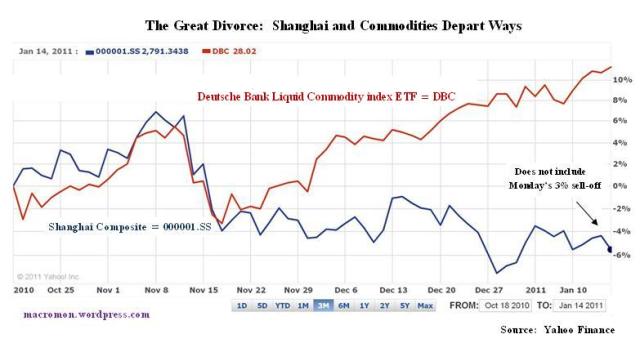
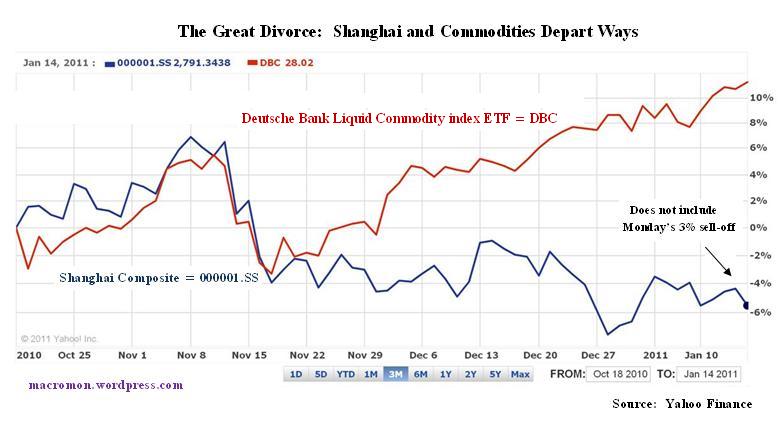
Recent price action exhibits all the characteristics of a blow-off top and some of the leaders already seem to be trading at stall speed.  Furthermore,  as the chart below illustrates,  since November the Shanghai and commodities, which have in the past tracked each other relatively well, are in a huge Willey E. Coyote divergence.

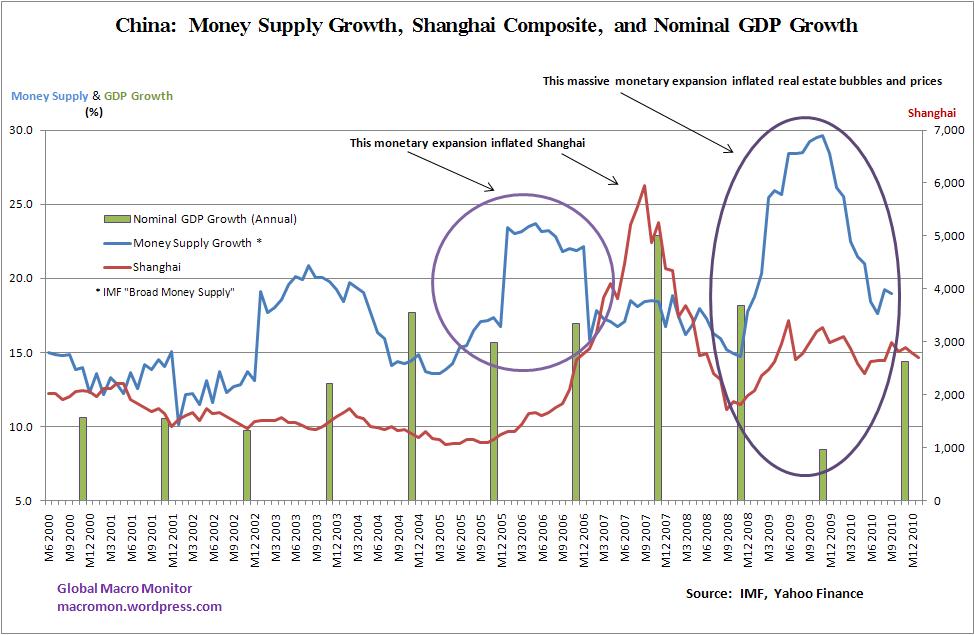
Finally, we find the last chart on China’s money supply growth very interesting.  Not unlike other countries, when the growth of the broad money supply outpaces nominal GDP growth,  asset bubbles and eventually price pressures tend to develop throughout economy.   China’s  rapid money growth in excess of nominal GDP growth in 2005/6 helped to inflate the Shanghai Composite, which rose from around 1,100 in mid-2005 to an intraday high of over 6,100 in October 2007.  At the close on Monday,  the Shanghai is down 56 percent from its all-time intraday high.

The monetary expansion which drove the Shanghai is minuscule compared to what took place after the financial crisis, however.  The Fed is often demonized, including, sometimes by us, for printing money to help stabilize the financial and economic crisis.   But take a look at what happened in China.

In the U.S., the central bank printed and created money through the expansion of its balance sheet.  In China, the government pressured the  banks to create money through expanding and directing credit to specific sectors.

The chart illustrates as nominal GDP growth was collapsing in 2009, the broad money supply in China was growing close to 30 percent by the end of 2009.    This helped the Shanghai Composite recover a bit, but inflated other bubbles, including and mainly in the real estate markets.   We hear rumors of,  and see pictures of empty Chinese shopping malls and cities pinging around the internet, which is the result of the easy and nonmarket credit included in the latest round of China’s monetary expansion.

Doesn’t this sound a little familiar?  First a stock bubble, then a monetary driven real estate and construction bubble to stimulate  growth?

We’re not saying China is going to collapse anytime soon and they do have almost $3 trillion in foreign exchange reserves to help cushion any hardship as monetary policy downshifts.  But we know that a 30 percent growth in the broad money supply, coupled with just 10 percent nominal GDP growth, must have given birth to many bodies swimming naked, which will be exposed as the credit tide goes out.    Whether they’re allowed to officially surface for all is an open question.  We just hope the markets will be a clear enough signal as to their size and magnitude.

Like everyone else,  we are flying almost blind in this dimly lit world of the markets.  We realize our model and view of the world could be wrong and learned to try and have as  little of our ego as possible vested in our models and views.   The only thing we’re certain of is the markets, as they have in the past and will continue to do so in the future,  beat our egos  like a drum.   We’ll have no problem revising or ditching our view all together if we lack market confirmation.   We always try and heed the words of the great Todd Harrison over at Minyanville.com, “discipline always trumps conviction!”   Stay tuned!
Posted in Black Swan Watch, Bonds, BRICs, Budget Deficit, China, Commodities, Crude Oil, Currency, Economics, Geopolitical, Monetary Policy | Tagged , , | 3 Comments

Paul Tudor Jones of Sports Betting

A nice piece about Billy Walters on 60 Minutes.  He doesn’t have much love for Wall Street.  Check it out….

Posted in General Interest, Video | Tagged , , | Leave a comment

Nonlinear Thinking: Jurassic Park

The Telegraph is reporting that the woolly mammoth could be brought back to life in  four years due to a breakthrough in cloning technology.   The advancement of technology is accelerating (positive second derivative) at a  stunning rate and we may just have a real Jurassic Park by the end of the decade.    The Telegraph writes,

…a technique pioneered in 2008 by Dr. Teruhiko Wakayama, of the Riken Centre for Developmental Biology, was successful in cloning a mouse from the cells of another mouse that had been frozen for 16 years.

Now that hurdle has been overcome, Akira Iritani, a professor at Kyoto University, is reactivating his campaign to resurrect the species that died out 5,000 years ago…

He has announced plans to travel to Siberia in the summer to search for mammoths in the permafrost and to recover a sample of skin or tissue that can be as small as 3cm square. If he is unsuccessful, the professor said, he will ask Russian scientists to provide a sample from one of their finds.

“The success rate in the cloning of cattle was poor until recently but now stands at about 30 per cent,” he said. “I think we have a reasonable chance of success and a healthy mammoth could be born in four or five years.”

Long T-Rex futures!

Posted in Black Swan Watch, General Interest | Tagged , , | Leave a comment

Larry Summers on structual change in U.S. labor market

In one of his first interviews since leaving the White House,  Larry Summers talks about the structural changes taking place in the U.S. labor market on today’s GPS with Fareed Zakaria.  He mentions the IT take-off and the new jobs potential of technologies such as the  iPad.  Click here for the interview.

Posted in Apple, Employment, Equities, Video | Tagged , , , , | Leave a comment

Chart of the Day: Euro Oils Play Catch-up

Big move in some of the European integrated oils last week.  Some have underperformed their American competitors by as much as 30-40 percent, which is more than explained by a weaker Euro.  If the market has been pricing a sovereign risk premium into these stocks, it looks overdone to us.  The “catch-up” trade is on.


Posted in Commodities, Crude Oil, Equities, Euro | Tagged , , | Leave a comment

Happy Birthday to a True American Saint

Posted in Video | Tagged | Leave a comment

The Week in Review: Waiting for Godot

This market just won’t quit!  The S&P500 hasn’t had a one percent correction since November 23rd and those waiting for a better entry just keep waiting and waiting and waiting.  France’s CAC was the best weekly performer of the major equity markets we monitor. Our indicator species for global risk appetite, the Hang Seng, was up 2.5 percent as was the Russell 2000, followed by the Nasdaq.   India’s Sensex had another rough week, now down 8 percent for the year.  The Shanghai Composite, the Mexican Bolsa, and the Nikkei were all down for week.   The Hang Seng is now the top performing market, year to date, followed by the CAC and the Nasdaq. The S&P500 is 2.83 percent.

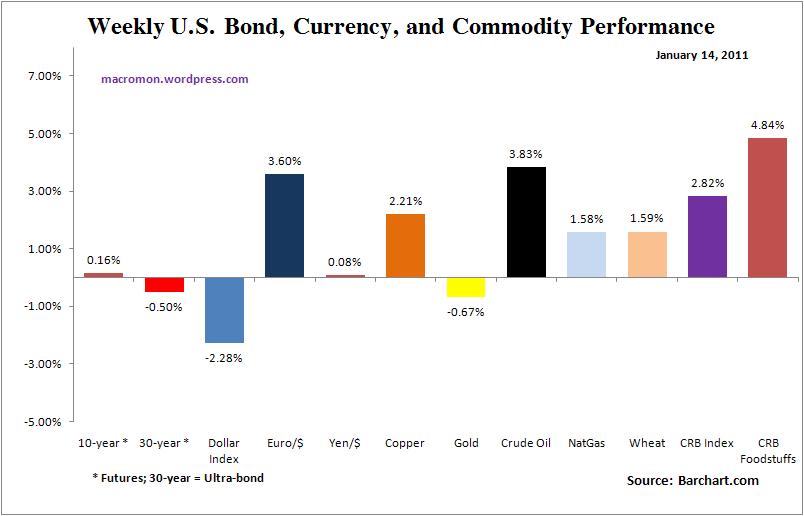
The Euro rose 3.60 percent against the dollar as the ECB President put the big hurt on the shorts.  The Dollar index gave up its gains from the prior week and is now flat for year.  Crude oil rose 3.83 percent and the CRB foodstuffs sub-index spiked 4.84 percent. The sharp rise in food price is sparking riots across North Africa.  The sharp rise in food prices will improve the U.S. terms of trade and should bolster the dollar, in our opinion.

Next week will be earnings 24/7. Given the few majors that have reported – Alcoa, Intel, and JP Morgan — the markets seems to be in a “sell the news” mode.  Take a look at our analysis of how Apple reacts after earnings.  We found that if the stock has large run-up before the release, the company needs to beat big for the rally to continue.  Apple is up 8.04 percent for the year.

We suspect the Shanghai will break its 200-day moving average next week as Asia gets serious about inflation.   If the Apple news is sold, this may be the catalyst for the overall market to correct.  This was exactly the case last quarter as Apple ran up big into earnings, beat estimates, then sold off and took the S&P500 down 1.6 percent the next day.  Volatility so cheap we couldn’t help but load on some out of the money SPY puts at close to protect our long positions, which are much lighter going into next week.

We’re trying to find a way to play natural gas without making our spouses widows and still don’t like commodities and emerging equities, in general, because of our “nontransparent” view of China.   We’re patiently waiting for the 200-day for reentry into gold at around $1,275, but not sure it will get there.

We believe the U.S. economy is in the early innings of a very messy and painful structural transition to one based on disruptive and transformative technology. The “American Dream” of our children will not be the McMansion economy of the baby boomers.

Our sense is the bears are “beating a dead horse” and missing the metamorphosis, which is taking place before our very eyes and easy to overlook given the very noisy and ugly macro picture.   Nevertheless,  this is very powerful and is reflected and anticipated in the stock market rally, in our opinion.    We were once blind, but now we see; as we saw the amazing growth of Apple during the depression of the past two years.  They are the leaders of this “new economy.”

We are absolutely cognizant of the mine field of risks that could blow-up the transition beginning with our propensity to address structural problems with cyclical and short-term solutions.  The markets are clearly signaling that gig is now up.   A painful and very loud complete restructuring of the public sector is coming.   We just don’t think Steve Jobs will stop innovating and engineers stop creating if Ireland and Greece restructure their debt.  Stay tuned.


Posted in Apple, Bonds, BRICs, Charts, China, Commodities, Energy, Equities, Euro, Week in Review | 1 Comment

JP Morgan’s Revenues: Tables & Charts

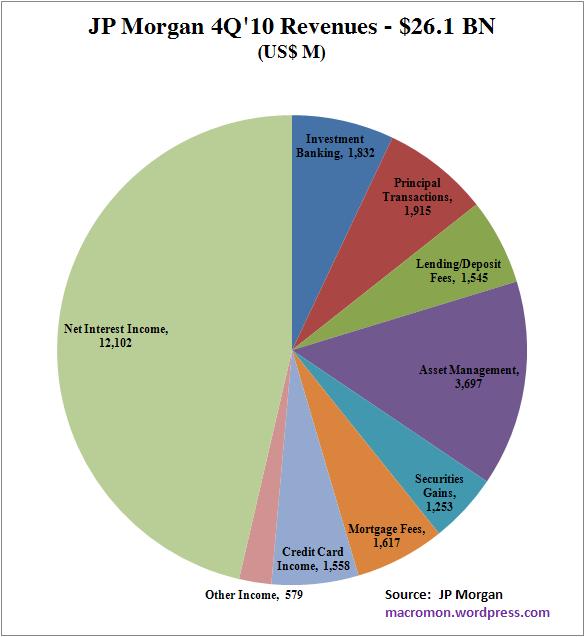
Let’s start with the caveat we’re not stock analysts and the sheer size of JP Morgan’s balance sheet and the dynamic use of reserves makes it difficult to get a true picture of what’s really going on.   But it’s tough to get very excited over JPMo’s earnings report from a macro perspective.   We like to look at top line growth* to give us a sense of what’s happening in the bigger macro economy.

This is a great company with one of the best CEO’s out there.   But, we thought we’d see better loan growth reflected in higher net interest income (margins declined due to litigation fees),  especially given the shape of the yield curve.   Patience, however, we’re still in the early innings of the country’s painful economic transformation and mortgage fees did account for 40 percent of their revenue growth.   Furthermore,  management did say on the conference call,

Mortgage Banking & Other Consumer Lending, you see circled, net income of $577 million. That’s on $2.8 billion of total revenue. Revenue here reflects strong Mortgage Banking origination revenues, higher production volumes, almost $51 billion in the quarter. $56 billion in total originations and you also had improved margins year-over-year.

The table below shows that  most of the revenue growth came from  three categories: 1) securities gains;  2) principal transactions;  and 3)  mortgage fees.   Could be we’re misreading the data or could by why the stock gave up the bulk of its gains into the close.   The declining trend in nonperforming loans in the last chart is also encouraging.

* reported basis


Posted in Credit, Earnings, Economics, Equities | Tagged | Leave a comment

25 BRIC Stocks Targeted By Shorts

Great list compiled by the NASDAQ of the top 25 BRIC stocks which have seen a sharp increase in short interest in 4Q 2010.   Looks like big bets being made against Chinese solar,  possibly as targets of some sort of  trade retaliation.

Of the top five, the shorts have been right so far in 2011 on ABV and LIWA,  down 5.8 percent and 2.8 percent,  respectively.  They’re getting “burned” on Chinese solar, however:  TSL up 15.5 percent, JASO up 10.8 percent, and YGE up 7.5 percent.   These stocks are cheap.   Trina, for example, trades at a 8.15  P/E if they hit their 4Q  number and a 7.54 P/E based on 2011 estimates.   Everyday we read stories of how European and U.S. solar cell and panel companies cannot compete with their Chinese competitors.   In fact, it was Yingli that won the installation for the NY Jets headquarters solar facility.   Get shorty Chinese solar?   NFW!

Top 25 out 120 BRIC Stocks (increase in 4Q short interest)

1. Companhia de Bebidas Das Americas (ABV): Brazil. Beverages Industry. Market cap of $91.04B. Shorted shares increased from 3.17M to 8.52M (+169% increase). Short float at 0.64%, which implies a short ratio of 1.91 days. The stock has gained 46.04% over the last year.
2. JA Solar Holdings Co., Ltd. (JASO):
China. Semiconductor Industry. Market cap of $1.33B. Shorted shares increased from 12.25M to 26.71M (+118% increase). Short float at 18.29%, which implies a short ratio of 2.77 days. The stock has gained 21.79% over the last year.
3. Trina Solar Ltd. (TSL):
China. Semiconductor Industry. Market cap of $1.91B. Shorted shares increased from 3.41M to 7.12M (+109% increase). Short float at 10.17%, which implies a short ratio of 2 days. The stock has lost -7.4% over the last year.
4. Lihua International, Inc. (LIWA): China. Copper Industry. Market cap of $318.72M. Shorted shares increased from 1.02M to 2.11M (+107% increase). Short float at 9.97%, which implies a short ratio of 5.12 days. The stock has gained 5.6% over the last year.
5. Yingli Green Energy Holding Co. Ltd. (YGE): China. Semiconductor Industry. Market cap of $1.61B. Shorted shares increased from 5.93M to 12.09M (+104% increase). Short float at 51.18%, which implies a short ratio of 3.65 days. The stock has lost -37.1% over the last year.
6. China Valves Technology, Inc. (CVVT): China. Industrial Equipment & Components Industry. Market cap of $302.06M. Shorted shares increased from 1.56M to 3.13M (+101% increase). Short float at 14.73%, which implies a short ratio of 6.31 days. The stock has lost -10.56% over the last year.
7. Cninsure Inc. (CISG): China. Insurance Brokers Industry. Market cap of $847.62M. Shorted shares increased from 3.05M to 6.03M (+98% increase). Short float at 12.62%, which implies a short ratio of 5.15 days. The stock has lost -8.7% over the last year.
8. ReneSola Ltd. (SOL): China. Semiconductor Industry. Market cap of $966.64M. Shorted shares increased from 2.04M to 3.8M (+86% increase). Short float at 6.49%, which implies a short ratio of 0.84 days. The stock has gained 120.4% over the last year.
9. China Security & Surveillance Technology, Inc. (CSR): China. Security & Protection Services Industry. Market cap of $440.2M. Shorted shares increased from 4.88M to 8.12M (+66% increase). Short float at 11.36%, which implies a short ratio of 6.91 days. The stock has lost -43.07% over the last year.
10. Melco Crown Entertainment Ltd. (MPEL): Hong Kong. Resorts & Casinos Industry. Market cap of $3.95B. Shorted shares increased from 3.71M to 6.11M (+65% increase). Short float at 2.07%, which implies a short ratio of 1.25 days. The stock has gained 101.9% over the last year.
11. Longtop Financial Technologies Limited (LFT):
Hong Kong. Business Software & Services Industry. Market cap of $1.95B. Shorted shares increased from 3.25M to 5.02M (+54% increase). Short float at 8.29%, which implies a short ratio of 7.25 days. The stock has lost -9.87% over the last year.
12. Wimm-Bill-Dann Foods OJSC (WBD): Russia. Dairy Products Industry. Market cap of $5.53B. Shorted shares increased from 1.43M to 2.08M (+45% increase). Short float at 2.58%, which implies a short ratio of 2.65 days. The stock has gained 42.67% over the last year.
13. Solarfun Power Holdings Co. Ltd. (SOLF): China. Semiconductor Industry. Market cap of $548.26M. Shorted shares increased from 3.19M to 4.6M (+44% increase). Short float at 10.84%, which implies a short ratio of 2.14 days. The stock has lost -1.87% over the last year.
14. Duoyuan Global Water Inc. (DGW): China. Pollution & Treatment Controls Industry. Market cap of $311.81M. Shorted shares increased from 2.28M to 3.14M (+38% increase). Short float at 26.32%, which implies a short ratio of 11.14 days. The stock has lost -64.63% over the last year.
15. Mechel OAO (MTL): Russia. Steel & Iron Industry. Market cap of $14.19B. Shorted shares increased from 2.57M to 3.53M (+37% increase). Short float at 1.26%, which implies a short ratio of 0.99 days. The stock has gained 48.84% over the last year.
16. Ctrip.com International Ltd. (CTRP): China. Consumer Services Industry. Market cap of $5.93B. Shorted shares increased from 6.28M to 8.41M (+34% increase). Short float at 5.63%, which implies a short ratio of 2.86 days. The stock has gained 22.99% over the last year.
17. Gulf Resources, Inc. (GFRE): China. Specialty Chemicals Industry. Market cap of $356.79M. Shorted shares increased from 2.41M to 3.22M (+34% increase). Short float at 16.66%, which implies a short ratio of 9.64 days. The stock has lost -23.08% over the last year.
18. LDK Solar Co., Ltd. (LDK): China. Semiconductor Industry. Market cap of $1.67B. Shorted shares increased from 11.43M to 14.74M (+29% increase). Short float at 12.02%, which implies a short ratio of 2.5 days. The stock has gained 66.97% over the last year.
19. Yongye International, Inc. (YONG): China. Agricultural Chemicals Industry. Market cap of $409.77M. Shorted shares increased from 4.01M to 5.17M (+29% increase). Short float at 13.33%, which implies a short ratio of 7.08 days. The stock has lost -2.35% over the last year.
20. Gerdau S.A. (GGB): Brazil. Steel & Iron Industry. Market cap of $21.23B. Shorted shares increased from 13.55M to 17.29M (+28% increase). Short float at 1.49%, which implies a short ratio of 1.87 days. The stock has gained 1.42% over the last year.
21. Guangshen Railway Co. Ltd. (GSH): China. Railroads Industry. Market cap of $2.95B. Shorted shares increased from 1.07M to 1.36M (+27% increase). Short float at 1.62%, which implies a short ratio of 21.58 days. The stock has gained 3.17% over the last year.
22. Harbin Electric, Inc. (HRBN):China. Industrial Electrical Equipment Industry. Market cap of $613.13M. Shorted shares increased from 4.32M to 5.37M (+24% increase). Short float at 25.58%, which implies a short ratio of 7.46 days. The stock has lost -12.25% over the last year.
23. China MediaExpress Holdings, Inc. (CCME): Hong Kong. Advertising Agencies Industry. Market cap of $350.55M. Shorted shares increased from 4.44M to 5.46M (+23% increase). Short float at 26.79%, which implies a short ratio of 3.79 days. The stock has gained 79.3% over the last year.
24. Gafisa S.A. (GFA): Brazil. Residential Construction Industry. Market cap of $2.37B. Shorted shares increased from 6.34M to 7.62M (+20% increase). Short float at 5.18%, which implies a short ratio of 3.74 days. The stock has lost -6.08% over the last year.
25. Petroleo Brasileiro (PBR): Brazil. Oil & Gas Drilling & Exploration Industry. Market cap of $247.04B. Shorted shares increased from 16.67M to 18.69M (+12% increase). Short float at 0.54%, which implies a short ratio of 1.04 days. The stock has lost -16.66% over the last year.

Posted in Clean Tech, Energy, Equities | Tagged , | Leave a comment