Monetarism Redefined: Crude, Fine Wine & Gold

“Inflation is Always and Everywhere a Monetary Phenomenon” – Milton Freidman

Monetarism as a theory, which states that the variation in the money supply has major influences on national output in the short run and the price level over longer periods, died during the 1980’s.   Economists noticed that the monetary aggregates,  GDP, and inflation were no longer stable in their relationship to one another.   Milton Friedman was the father of Monetarism and Paul Volcker was one of the last great Monetarists.

The rapid advances in financial innovation and the rise of of the shadow banking system made the measurement and even the definition of money increasingly difficult.   At one point, the Fed studied and even considered including equity mutual funds in one measure of money.   During the height of the dot.com bubble some were even using stock options in start up tech companies as a medium of exchange — the purest form of money.

One of the basic tenets of monetarism is the concept of dishording.   If people hold too much money, they dishord the excess balances and buy goods and services.     We would add assets to that mix and think one of the problems today is that the excess money balances are disproportionately distributed throughout the global economy.   The helicopter drop is resulting in collateral damage in higher prices for consumer necessities,  such as food and transportation fuel.

The  bulk of the excess cash, in our opinion,  has been created and held by central banks in the form of  foreign exchange  reserves.   In addition, the money created by the Federal Reserve is not being circulated throughout the wider economy because of the broken financial sector in the United States, which is the country’s  main credit creation and money machine.

Thus, all this excess money is distributed among sovereign wealth funds, hedge funds, and money management firms, which sloshes around the world looking for a home.    These managers  are smart enough to know that much of the excess liquidity and reserves in the system is in the form of “high powered money“, which can be multiplied by a fractional reserve global credit system.

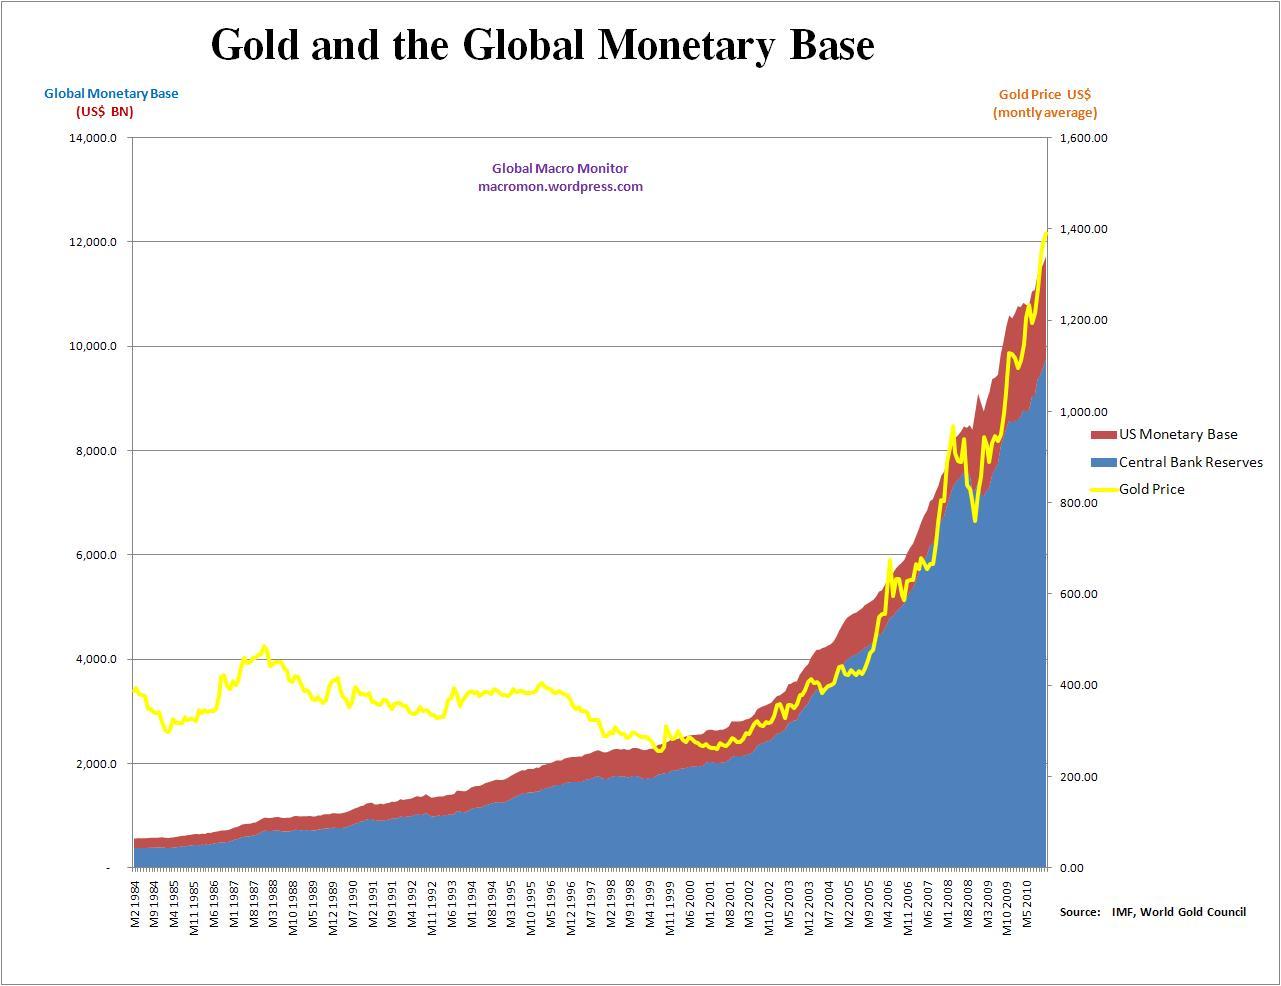
In other words,  the global monetary punch bowl is heavily spiked by a monetary base which has gone parabolic in the past five years (see chart below) and when credit creation is finally added to the mix the result will be, and to some extent already is, a toxic brew of inflation.

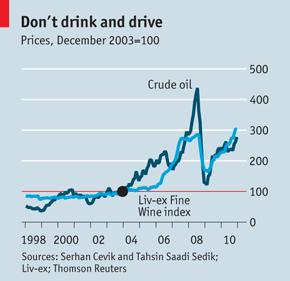
We are already seeing this in the emerging markets and even in parts of Europe.   The dishording and search for a “store of value” is becoming  an obsession and driving  everything from equities to onions.   Throw in a supply shock or two to lather up the specs and the party really gets going.  Take a look at the charts below.

Today’s Economist published a piece on the how the price of fine wine and crude oil move together.    What the heck does crude oil and $5k bottles of Château Pétrus  have in common?  Some economists and academics can spin a story  that maybe wine demand is driven by the OPEC countries or the emerging markets.  Yada, yada, yada!

These are the same guys that told us the housing market was driven by fundamentals.  A good fundamental story is  a necessary condition for a bubble, with excess liquidity the sufficient condition.   There’s just too much money chasing too few goods.   Punto!

Ironically,  unless wages and household wealth keeps pace,  food and energy inflation is ultimately deflationary in other sectors and will depress economic growth as real wages fall.  We think the Chinese government understands this and is rapidly increasing the minimum wage throughout the country, in effect, trying to monetize the food price inflation.   This is why we believe China will have a more difficult problem containing their inflation and risks an inflationary spiral.
Inflating a stock market or housing bubble feels good for everyone x/shorts, can create temporary wealth and economic growth,  and  potentially increase the popularity of  governments.   A commodity bubble is a different story, however.   Though gold is a benign store of value and actually should be encouraged by governments, in our opinion,  higher food and energy prices are a potent political mix.   Go no further than North Africa to see the results.

We bet many governments are hoping the commodity markets roll-over with the Shanghai as we wrote about on Tuesday.  Just not the commodities they export.  Stay tuned!

Related Articles
The financialisation of commodities – VOX
Record Oil, Gas Prices Loom as Financial Reform Fails – TheStreet.com

 

Posted in Black Swan Watch, Bonds, BRICs, Budget Deficit, Charts, China, Commodities, Credit, Crude Oil, Currency, Economics, Monetary Policy | Tagged , , , | 3 Comments

Macro Notes from the Goldman Conference Call

Here are what we believe were money quotes from Goldie ‘s earnings call.  All about the lack of client conviction.

The take-away quote:

There is no question, having all of that liquidity is a drag on our return. As you heard me say, we think about everything in term of risk and reward. And we think right now, the risk of having too much cash and having somewhat lower returns versus not having enough is very skewed towards having too much.

Other  money quotes:

…the trajectory of the global economy was heavily debated, and there were growing fears about the potential for inflation in growth markets. The ultimate consequences of these concerns lead to greater risk conversions, a deterioration and conviction among institutional investors and thus, a steady decline in client activity.

This reduction of client activity occurred across a broad set of businesses within Investment Banking and FICC and equities client execution.

Commodity net revenues were up amidst more favorable market conditions. For the full year, FICC client execution net revenues were $13.7 billion. We’re down 37% from 2009 as macro uncertainty throughout the year drove lower client activity and led to tighter bid-offer spreads.

Turning to Risk. Average daily value at Risk in the fourth quarter was $120 million, roughly flat with the third quarter.

The firm is investing in lending activity to across various asset classes, primarily including debt securities and loans and equity securities, including private equity and real estate, are included in this segment. These activities include both direct investing and investing through fund as well as lending activities. Our investment in ICBC produced a $55 million gain in the quarter. Other equity investments generated net revenues of $1.1 billion across both public and private equity investments, and benefited from the significant increase in the equity markets.

Net revenues from our debt, investing and lending businesses were $537 million from interest income and tightening credit spreads throughout the quarter…

In Investment Management, we reported fourth quarter net revenues of $1.5 billion, up 18% from the third quarter due to higher Assets Under Management and $310 million in incentive fees generated across the firm’s alternative asset products.

While economic activity has improved in recent weeks, the seasonal nature of the fourth quarter, combined with the continued uncertainty surrounding the outlook, makes future activity levels difficult to predict.

….you know we mark everything to market. We mark our loans to market. So if we lend to someone and their spreads widen, we mark them down. If their spreads narrowed, we mark them up, because we mark everything we have to market, loans, loan commitments. Everything is mark-to-market in Goldman Sachs. So that mark-to-market is in there, and interest income is in there as well. So we lend to people. They pay us interest, and that revenue is in there as well. So those two things are broken in there in the debt securities side.

Across the full year, the competitive landscape got much tougher. And this is not a surprise, and we talked about it in the past. Certainly, in the early part of 2009, our competitors were hurt probably more than we were financially. We’re much less willing to commit risk capital on behalf of clients than we were. We picked up quite a lot of market share. I think we’ve told you too last year, we did not expect that market share would stay. I think we’ve kept the small amount of it, but our competitors are stronger financially.

Most of investing we have done over time has been through funds. We’ve done some on our balance sheet but most of it has been through funds. I think one thing we know the rules do, it limits the percentage we can have in the funds to 3%. We have traditionally had more than that in the funds. We’re going to have to have smaller percentages than we’ve had in the past. We’ll still have some money, so our clients will know that we’re there.

I think that there is more focus on cash products than derivative products right now partially because of the concern of uncertainty around regulation.

I think what we need, really, is conviction on the part of our customers and clients, some more level of conviction and therefore, wanting to really be active in the markets.

[on risk appetite of clients]   It’s anybody’s guess. You know I don’t like to look forward. And two and a half weeks don’t tell you a whole lot. And I wouldn’t say it’s the best period we’ve ever seen, but it’s sure a lot more active than December.

I think that there was so much uncertainty. Traditionally, things gets lower at the year. There was so much uncertainty in the microenvironment, that it got even slower than usual. And I guess you get to the new year, people come back, are wanting to be more active.

Clearly, there have been some structural changes in certain parts of the market. The real question is are they permanent? Are they temporary? I don’t happen to believe most things are permanent. When you look overtime at financial markets, things get created. Sometimes they stay, sometimes they get out of fashion and other things get created to replace them. There’s going to be a housing market in the United States. Housing market in the United States, you need mortgages and unique financing for those mortgages. That’s not going to go away. Is it going to be the same type of securitizations that we saw in 2006 and 2007? Probably not for some period of time. I wouldn’t say not forever but certainly, not for some period of time. But is there going to be something to replace them to allow that market to go on? Yes, there’s going to be something. I don’t know what’s going to be yet. So it’s a really tough question to answer. Some products that were in favor are now out of favor, and are likely to stay out of favor for at least some period of time, but other products will be developed to replace them

I think there are still a lot of concerns about what the ultimate resolution is going to be in Europe. I think that’s one of the things that’s weighing on people’s conviction. I think it’s one of the things that weighed on activity throughout the entire 2010.

Posted in Earnings, Equities | Tagged , | Leave a comment

Specs Fuel “Bizarro” World of Live Cattle Futures

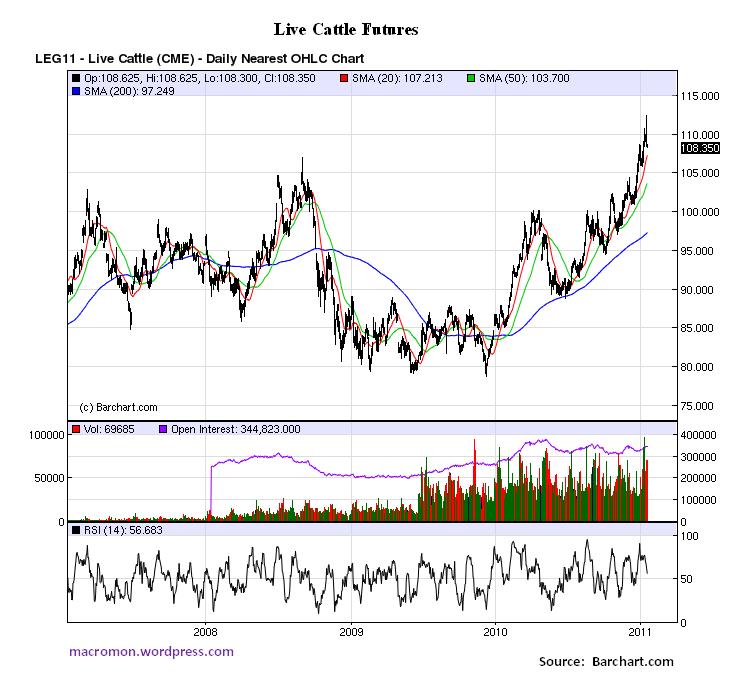
After reaching a high of $112.375 – the highest for a closest-to-expiration contract since CME launched cattle futures in 1964 – February live cattle futures fell today to the equivalent of $108.80 per hundred points. The price hit a previous record of $107.05 in September 2008 during the commodity bubble that sent crude oil up to $150 a barrel. Drovers CattleNetwork writes,

CME Group traders such as Jim Sauter say cattle prices have climbed above levels justified by current supply and demand patterns. While the total U.S. cattle inventory is near the lowest on record, beef production actually increased last year because of heavier animals, Sauter noted.

Additionally, growing concern over food inflation has propelled a flood of speculator money into grain and livestock futures, setting markets up for a repeat of 2008, when prices surged before tumbling sharply, Sauter said…

As in 2008, hedge funds and other speculators were heavy buyers in grain and livestock futures over the past year.  Swap dealers and managed money, the two largest categories of speculators tracked by regulators, held 34 long positions for every one short position in CME feeder cattle futures last week.

In another gauge of investor bullishness, the speculator net-long position in feeder cattle futures and options totaled 18,622 contracts for the week ended Jan. 11, according to the U.S. Commodity Futures Trading Commission. That was the largest net-long position in feeder cattle since at least June 2006, when the CFTC began tracking the data, according to Bloomberg News.

Finally,  this really sums up what is happening across almost all commodity markets,

“This is bizarro world,” Stanley said yesterday. Cattle futures are “probably $4 to $5 overpriced. We’re a house of cards here.”

The spike in agricultural prices is causing food riots and now even toppling governments. We expected regulators to crack down hard on the specs, but Daniel Dicker over at TheStreet.com writes,

In my upcoming book, Oil’s Endless Bid, due out from John Wiley & Sons in March, I argue that financial influences from investors and traders and the massive growth of derivatives markets have been the single most important factor for oil’s high and unreliable price, far outstripping fundamental arguments of emerging market growth, peak oil or any other supply constraints or a devaluing dollar.

Putting some controls on at least some of these speculative influences was supposed to be one of the goals of Dodd-Frank, but the actual rule-making to put teeth behind the legislation has been left to the Commodity Futures Trading Commission (CFTC). Since it began tackling this massive job in July 2010, the CFTC has literally been buried by the pushback from industry lobbyists, hired-gun lawyers, derivatives broker/dealers and virtually every industrial corporation with a trading desk that depends even marginally on derivatives activity to protect or augment profits.

Wow!   You think the Tea Party was a political force in the last elections?   If the public gets whiff and internalizes what Dicker argues here as they pay ever higher prices for their steak  and hamburger,  and spend $100 for a tank of gas,  the Administration and Congress better start thinking Tunisia!    Long political risk!

Posted in Commodities, Monetary Policy, Policy, Politics | Tagged , | 4 Comments

S&P500 Breaks Hitting Streak, Jimmy Rollins Safe…

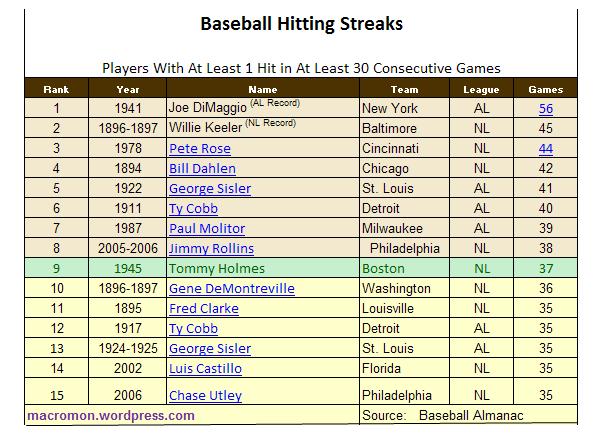
The S&P500 broke its streak of 37 consecutive days without a one percent correction, just barely, however, falling 1.01 percent.  Jimmy Rollins can sleep easier tonight.  The NASDAQ was down 1.46 percent.


So what’s next?  If history is indicative of near-term performance, don’t expect a major sell-off in the next week or two.  The table below shows that over the past 20 years there have been seventeen streaks where the S&P500 had not experienced a one percent correction for 37 consecutive days.

The average return over the next five days was 0.59 percent and over the next ten, 0.71 percent.   Of the seventeen observations, thirteen experienced positive returns in both of the time periods.

Will history repeat?  Who knows, but it certainly may rhyme.  The action in F5 Networks –a leader in the recent tech rally — after the bell is extremely ugly.  Their revenue miss has clipped 20 percent off the stock.   The market seems to be in a selling mode, whether hit or miss.

Commodities also reversed today.  We took some pain trying to catch the Mosaic falling knife after the Cargill announcement.  The question is does Cargill sniff a top in Ag commodities and trying to top-tick its divestiture?

And we didn’t exactly trade Apple like Joe the MOTU around earnings and the Steve announcement.  Apple traded over $355 after the close yesterday.    Like many out there today we’re also reaching for the KY.

We’re still in a powerful uptrend until proven otherwise and do think the markets may give us a gift here, especially in tech, and will be looking to buy the “French dip.”  No more falling knives, however.   Stay tuned!

Posted in Charts, Commodities, Equities | Tagged | 1 Comment

Not Your Father’s IBM…

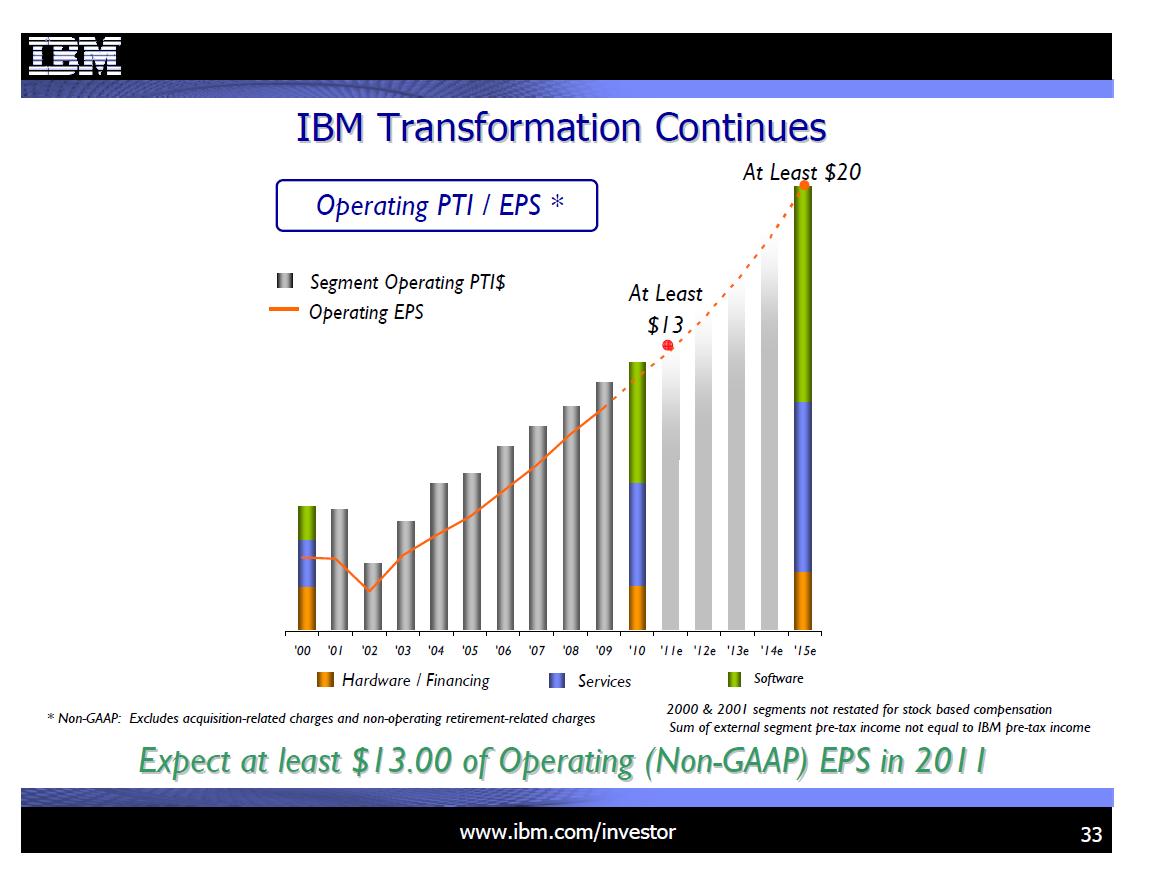
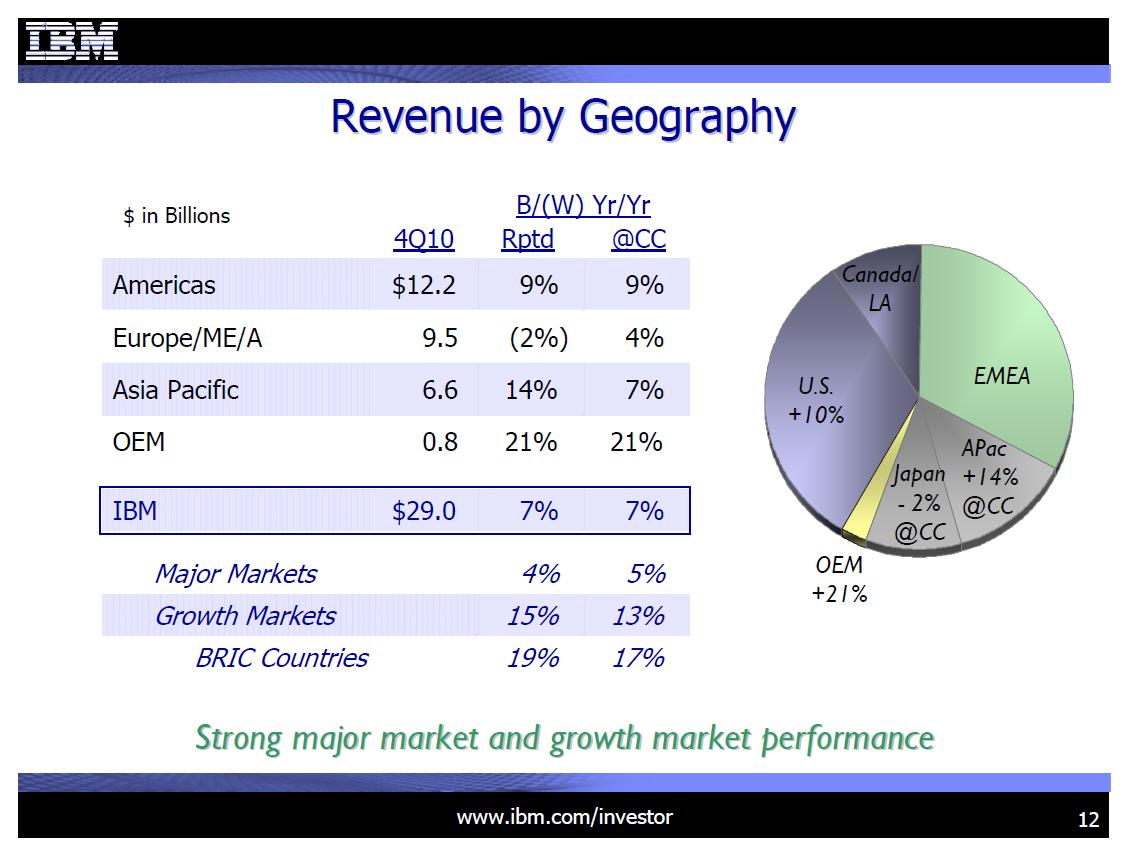
IBM blew away estimates and was trading up $4.oo in after hours tradings.  Here’s a  couple of interesting charts from today’s earnings presentation.    Take a look how the company is transforming itself from what was primarily a hardware company to a software and services firm.  Also note the steady state of growth.

Posted in Earnings, Equities, Uncategorized | Tagged , | Leave a comment

ChinaLeaks: Dec CPI slows to 4.6%, GDP Grows 10.3% in 2010

Looks like someone in the CenBank is  worried about the stock market and leaked economic data, which was not due out until Thursday.    Nice cred!    The Straits Times reports,

BEIJING – CHINA’S economy grew 10.3 per cent last year as inflation exceeded the government’s full-year target, Hong Kong-based Phoenix Television said on its website on Wednesday.

The broadcaster cited unnamed central bank sources as saying the figures had been ‘leaked’ a day before the government is due to release key economic data for December and 2010.

The country’s consumer price index, a key measure of inflation, rose 3.3 per cent from a year earlier over the 12 months, exceeding Beijing’s full-year target of three per cent as food costs soared.

December inflation slowed to 4.6 per cent year on year compared with 5.1 per cent in November, which was the fastest pace in more than two years.

The producer price index, which measures the cost of goods at the factory gate, jumped 5.9 per cent over the year. — AFP

Posted in China | Tagged , | Leave a comment

Money Quotes from the Apple Conference Call

Read the following money quotes from the Apple earnings conference call and be stunned.

Revenue
…for the quarter was $26.7 billion, an increase of more than $11 billion over the prior December quarter’s result, representing growth of 71%.

Mac
We established a new quarterly record with sales of 4.13 million Macs, representing 23% growth over the year-ago quarter… We experienced strong sales growth in each of our geographic segments, with over 50% growth in both the Asia-Pacific region and Japan. The growth was fueled primarily by strong demand for the new MacBook Air, which was launched in October, as well as continued strong sales of MacBook Pro…

What we saw in the Mac this quarter was we grew 23% at the worldwide level, and that is compared to market growth of only 3%. And so we grew almost 8x the market rate of growth, which is, I think, stunning. And every region outgrew the market, so it wasn’t just one region. Asia-Pacific led the growth with a whopping 67% year-over-year increase, and that’s almost 10x what market did there, to put it in context. Japan grew at 56%, which is about 6x the market, and Europe and the United States both grew in double-digits despite both markets contracting overall….

Now was there any cannibalization by iPad? Honestly, I don’t know for sure. But yes, I think there is some cannibalization. But I also think there’s a halo effect. As we’ve seen on the Mac by the iPod some years ago, I think there is a halo effect from Apple product to Apple product. And of course, we have introduced millions of people in Asia to Apple through the iPhone. And we’re now introducing many more through the iPad, and I think some of those decide to buy a Mac. And so when you look at the Mac growth in Asia at 67%, and you look at the Japan growth at 56%, and you look at U.S. and Europe growing in double-digits against shrinking markets, if this is cannibalization, it feels pretty good

iPod
We experienced continued strong sales of iPod touch, which grew 27% year-over-year and accounted for over 50% of all iPods sold during the quarter. iPod’s share of the U.S. market for MP3 players remains at over 70% based on the latest monthly data published by NPD…

iPhone
We were thrilled to have sold 16.2 million iPhones compared to 8.7 million in the previous December quarter. This represents 86% year-over-year growth compared to IDC’s latest published estimate of 70% growth for the global smartphone market overall in the December quarter…

At the end of the December quarter, we had iPhone distributions through 185 carriers in 90 countries. We continue to experience very strong year-over-year growth in all of our segments, with sales in the Asia-Pacific region and Japan both more than doubling year-over-year.

Enterprise customers continue to embrace iPhone, with 88 of the Fortune 100 companies and almost 60% of the Financial Times Europe 100 companies now testing or deploying iPhones.

We continue to have a sizable backlog, and believe we could have sold even more iPhones if we had been able to supply them. And we’re thrilled to begin working with Verizon next month to offer iPhone 4 to its more than 93 million customers, as well as to new customers who want iPhone 4 on Verizon

iPad
We sold 7.3 million iPads, a sequential increase of over 3 million, with distribution in 46 countries by the end of the December quarter…

Enterprise CIOs are adding iPad to their approved device list at an amazing rate. Today, over 80% of the Fortune 100 are already deploying or piloting iPad, up from 65% in the September quarter.

Retail
I’d now like to turn to the Apple Retail Stores, which had a record-breaking quarter. Retail revenue almost doubled year-over-year to $3.85 billion compared to $1.97 billion in the year-ago quarter, an increase of 95%…

Additionally, our four stores in China were, on average, our highest traffic and our highest revenue stores in the world. We opened six stores during the December quarter, bringing us to a total of 323 stores worldwide at the quarter end, with 87 of them outside the United States…

We hosted a record 75.7 million visitors in our stores during the quarter, compared to 50.9 million visitors in the year-ago quarter, an increase of 49%…

Margins
Total company gross margin was 38.5%, which was about 250 basis points higher than our guidance. About half this difference was due to better commodity cost than we had planned. The remainder of the difference was due to the leverage on the higher revenue and lower other product costs, including freight, warranty and phone support.

Cash Holdings
Turning to cash. Our cash, plus short-term and long-term marketable securities, totaled $59.7 billion at the end of the December quarter, compared to $51 billion at the end of the September quarter, an increase of $8.7 billion. Cash flow from operations was $9.8 billion, an increase of 69% year-over-year.

China and Asia
…the BRIC countries, Brazil, Russia, India, China, we, several years ago, identified China as our top priority, and we put enormous energy into China.   And the results of that has been absolutely staggering. To give you some numbers there and some specifics, we look at Greater China as a region. And Greater China, just for clarity, is mainland China, Hong Kong and Taiwan. The revenue from Greater China for Apple for last quarter was $2.6 billion, which was up 4x from the prior year quarter…

Korea has also been a very, very good market for us. We had an outstanding Q1 there, primarily driven by iPhone and iPads. And there are several other Asian countries doing extremely well. Japan is not in the segment that you’re looking out, but Japan by itself, the revenue was up 83% year-over-year… And so we are placing more and more resource in these areas and continue to look for expansion possibilities throughout Asia.

Enterprise
….enterprise, is one of the megatrends that are occurring. I think the most forward-looking CIOs are coming to the realization that the productivity of the person, the creativity of the employees is materially more important than everyone using the same thing.   And the ability to write apps in a simple and straightforward manner for the iPhone or the iPad through the SDK is an incredible thing. And you can wind up, literally, running your whole business off of an iPad or an iPhone. And so I think the list of ideas and places that people can go there were unimaginable just to a few months ago.

…. the iPad started shipping in April, and we’re already up to 80% of the largest companies deploying or piloting the product. This is unheard of, at least, in my dealings with the enterprise over the years.

Long-Term Business Plan
…And I don’t want to let anybody know our magic because I don’t want anybody copying it…. the team here has an unparalleled breadth and depth of talent and a culture of innovation that Steve has driven in the company, and excellence has become a habit….

I would also note to those people that haven’t thought about it is we’ve done outstanding in our Mac business. We’ve had 19 quarters straight of growing faster than the market, but we still have a relatively low share of a very large PC market despite having great momentum there. And so it would seem like there’s enormous opportunity still there.

We have a relatively low share in the handset market. The handset market is well over 1 billion units a year, and the smartphone market is growing faster than a weed. And so there’s enormous opportunity here, and we have incredible momentum in that space.

iPad just got started, it’s a new category. We sold almost 15 million through the first three quarters, and we believe the market is huge. IDC, I saw this morning, is predicting it to quadruple in two years. I don’t know what to predict in terms of specific numbers. However, we believe it’s a huge market, as we’ve said before.

Posted in Apple, Earnings | Tagged | Leave a comment

Targets of Yield-Seeking Capital

This graph from the World Bank illustrates why Brazil is having such a problem with capital inflows.  Capital will always seek out the highest risk-adjusted return.

During times of excess liquidity and low interest rates, however,  markets ignore or jettison risk concerns altogether and instead seek the highest stated returns, such as what happened during the pre-crisis bubble.  This doesn’t fit the “efficient markets hypothesis” of the academics and probably explains why the current Fed Chairman and others didn’t see it coming.   And probably why PK believed the markets have no problem financing a $1 trillion plus U.S. budget deficit at 2.50 percent with 10-year money.


Posted in Bonds, BRICs, Charts | Tagged , , | Leave a comment

Chart of the Day: Country GDPs and American States

In case you missed it,  a great chart from the Economist comparing the size of country GDPs to American states.   This gives some perspective on the relative size of the U.S. economy.

Posted in Chart of the Day, Charts | Tagged , | 2 Comments

Nonlinear Thinking: The Future of Ag?

As food prices spike and the Malthusian noise grows louder let’s take a look at what the “victory garden” of the future may look like.   Indoor Ag and hydroponics are already huge in the the production of the number one cash crop for many counties across the country.

Never underestimate the power of innovation and the markets given a secular shift in relative prices.  Still researching ways to play this and will get back to you.    Long Monsanto.


Related Articles
‘Vertical Farm’ envisions tall future for farming – PHYSORG.com


Posted in Clean Tech, Commodities, Equities, General Interest, Nonlinear Thinking, Technology | Tagged , , | 6 Comments