Intel Inside: Macro Notes from the Conference Call

Intel announced a 48 percent y/y jump in 4Q net income after the bell driven by strong corporate spending.  The company plans to step-up capital spending to $ 9 BN in 2011 with the emerging markets their main driver of  growth.  The stock traded up 2 percent after hours.

The macro MONEY QUOTE from the conference call:

“The drivers of our business right now are emerging markets…it’s a simple one of economics…The price of technology has come down to the point that billions more people can afford that technology and that’s highly desirable and if I may, I’ll use China as the example. If you go back to the mid-90s, it was on average of 175 weeks of income for somebody to be able to afford a notebook computer. If you fast forward to 2010, it’s now seven weeks of income in China on average for somebody to afford the computer, see a 1.4 billion people that where the price of computing is coming into a range that is affordable and it’s a big deal to them…   – Stacy Smith,  SVP and CFO

Other quotes:

– Turning to 2011, we are planning on continued growth in our core businesses resulting in approximately 10% revenue growth. We are forecasting continued strong gross margins with the mid-point of our annual range at 65%.

– In support of expected strong unit growth in our core businesses and the movement of graphics transistors to our leading edge process technology, we’re forecasting an increase in capital spending to $9 billion as we build and equip an incremental high volume manufacturing factory at 22-nanometer.

– 2010 reinforced our view that the demand drivers that we talked about in May, emerging markets, notebooks, consumers and servers translate into significant revenue growth for Intel and that the work that we have done on our cost structure translates into exceptional financial results.

– The drivers of our business right now are emerging markets. It’s the consumer segment of the market. Then we’re seeing a build out of that cloud infrastructure, which is driving our server results. I’ll really highlight the emerging market piece of this because if I just look at the business it’s 2 to 1 in terms of unit growth coming from emerging markets versus mature as we think out over the next several years. The dynamic that’s going on there, it’s a simple one of economics from my perspective. The price of technology has come down to the point that billions more people can afford that technology and that’s highly desirable and if I may, I’ll use China as the example. If you go back to the mid-90s, it was on average of 175 weeks of income for somebody to be able to afford a notebook computer. If you fast forward to 2010, it’s now seven weeks of income in China on average for somebody to afford the computer, see a 1.4 billion people that where the price of computing is coming into a range that is affordable and it’s a big deal to them, because it’s how they move into the knowledge-based economy. So, that I think is the big driver of our business, and has been last few years. It’s likely to be over the next several years.

This fits our view of CapEX accelerated growth for 2012, which we believe last quarter’s equity melt-up was signaling.  Now let’s hope Intel spends the bulk of the $9 BN in CapEX here.

Posted in Charts, Earnings, Equities | Tagged , | Leave a comment

Cartoon of the Day

Irish Prime Minister, Brian Cowan, is under fire for playing golf with Seán FitzPatrick, former CEO of Anglo Irish Bank — “the dynamo behind the breathtaking rise and spectacular crash of Anglo Irish Bank, is arguably the country’s most loathed and least trusted individual.”     The cartoon appeared alongside this article/opinion in today’s Irish Independent.   Sounds like the elections may be delayed until April.

Posted in Cartoon of the Day, PIIGS | Tagged , , | 1 Comment

Greatest Arb Ever: Cracking Gas into Big Macs

OK, time for a little fun.  You can try this and let us know if it works.

Almost everything today comes down to energy, right?

The rise in food prices is really nothing more than an energy problem.   After all, food consumption is about the digestion of calories — one metric of energy measurement – to fuel the human machine.

Scientists have learned to “crack” the energy of foodstuffs,  mainly corn and sugar, and convert these into transportation fuel.   It gives new meaning to “cracking corn.”

If we could do the reverse and crack highly efficient refined fuels into foodstuffs,  for example, we believe we have found the greatest arbitrage of all time.

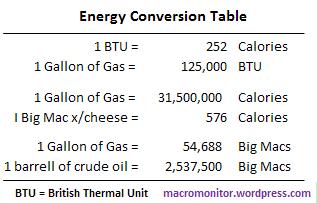
The Energy Conversion Table below shows that one British Thermal Unit (BTU) is equivalent to 252 calories and one gallon of gasoline is equivalent to 125K BTUs.   Therefore, one gallon of gasoline is the energy equivalent of 31.5M calories.

The energy component of a Big Mac without cheese, for example, is 576 calories, so one gallon of gasoline is the energy equivalent of 54,688 Big Macs.  Still with us?

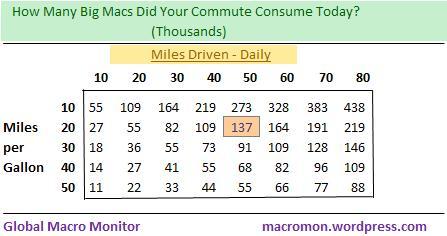
We’ve included the following table/matrix to show that if you drove 50 miles today in a car that gets 20 miles per gallon, you consumed the energy equivalent of 137K Big Macs.  Yuck!

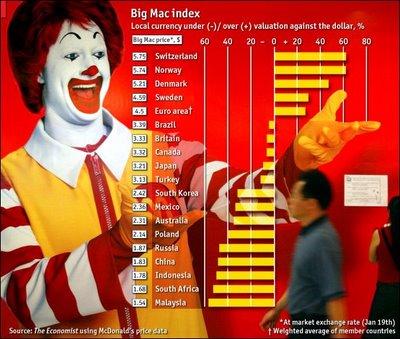
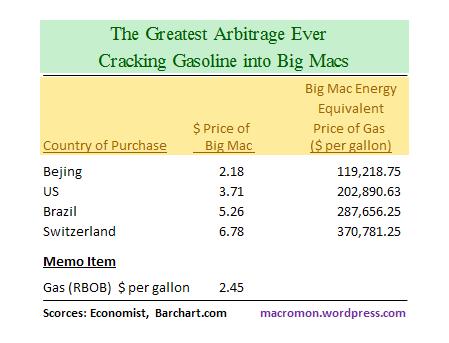
The last table, The Greatest Arbitrage Ever, shows the dollar price of a Big Mac in various countries (no wonder the Brazilians are now aligning with U.S. against China ‘s FX policy)  and the Big Mac energy equivalent price of a gallon of gas.  That is, one gallon of gas is the energy equivalent to 54,688 Big Macs and with the price of a Big Mac in Brazil at $5.26, the Big Mac energy equivalent price of a gallon of gas in, say Sao Paulo, is $287,656.25.

What an arb, no?  Buying a gallon of wholesale gasoline in Rio for $2.45, “cracking” it into 54,688 Big Macs, and selling them at $5.26 for $287,656.25 sounds like a “splendid arbitrage” to us!

Fun exercise and we can’t wait for the e-mails from the economists on this one.  Before you waste your time,  remember, we’re not serious!

Posted in Commodities, Crude Oil, Economics, General Interest | Tagged | 5 Comments

What You’re Paying For in a Gallon of Gas

Posted in Commodities, Crude Oil | Tagged | 1 Comment

Chart of the Day

This chart is a CRACK up, but not for drivers and the economy.  Where’s the “tipping point“?

Posted in Commodities, Crude Oil | Tagged , | Leave a comment

Gold a Bubble? Think Again!

Think gold is a bubble driven only by animal spirits and speculation?  We think not and have consistently maintained the fundamental driver of gold has been the massive accumulation of foreign exchange reserves by global central banks and their need for diversification.

Nothing illustrates this better than the chart below.   We have also included the table to illustrate how much gold China and Brazil would have to buy to get to the same proportional gold position as their fellow BRICs, India and Russia.

We calculate the “global monetary base” as the sum of central bank reserves less gold and the U.S. monetary base.   Notice, the gold price broke out in late 2003 along with every other commodity and asset, including housing prices.

The Fed takes a lot of heat for its role in fueling the past bubble but foreign central banks played their part through depressing their currencies, accumulating reserves, and recycling the dollars back into U.S. markets.  This created a very powerful positive feedback that drove every asset to the moon and pancaked market and implied volatility.

Our view is that investing in gold is a journey and not a destination.  There is no right target price for gold or a fair or fundamental value for the yellow metal.   When the major central banks are maintaining a zero (or close to) interest rate monetary policies and foreign central banks are accumulating reserves at a rapid clip,  the trend in gold prices is north.

In a tightening mode or when foreign central banks stop accumulating reserves the trend will turn south.   Until then, all else is noise and we will be buyers on the “french” dips as the bubbeistas provide the opportunity.    We were hoping gold will move back to its 200-day moving average to provide us a nice reentry.  We’re not so sure we’ll receive such a gift, however.

One last point.  Gold is a relatively benign “store of value” as opposed to other commodities such as crude oil, copper, and foodstuffs, which have negative economic and societal consequences during price spikes.  We believe we’re close to the “tipping point” prices in some of these commodities.  If central banks have been buying them, say, though their sovereign wealth funds,  for example, we think they may start to pull back a bit.

Posted in BRICs, Commodities, Crude Oil, Gold | Tagged , | 13 Comments

Nonlinear Thinking: Volt’s Battery Capacity Could Double

That’s what were talking about! A break through in battery technology will really change the world as we know it.   MIT’s  Technology Review reports the next generation of the Chevrolet Volt and other battery-powered cars are looking at electrode materials developed at a U.S. Department of Energy Lab for its next generation of batteries.   These materials help double their energy-storage capacity, potentially leading to substantial costs savings by allowing electric vehicles to use a smaller battery pack.   TR writes,

Cost is the biggest problem with the wave of battery-powered vehicles that started to arrive on the market last month. GM’s Volt, an electric vehicle that goes 35 miles per charge and has a gasoline generator for longer trips, costs more than twice as much as a similar-sized conventional car, in large part because of the battery. Increasing the amount of energy that a battery stores allows an automaker to use a smaller battery pack, thereby reducing costs…

We have a ways to go before electric vehicles fueled by solar chargers are the norm, but we believe that day is much closer than the markets and OPEC think,  and higher oil prices will only move it forward.  These are super disruptive technologies.  Think elbow of the exponential technology curve.  Just say no to the “new normal.”


Posted in Black Swan Watch, Clean Tech, Economics, Electric Vehicles, Rare Earth Elements, Video | Tagged , , | Leave a comment

European Commission: The U.S. is Worse

Here is a European Commission chart that appeared in the online version of Der Spiegel.  It could be a decoy to deflect the markets attention off Europe and push back to what they may perceive as America’s wallowing in schadenfreude over the Eurozone’s demise.  It is probably neither, however.

Any intelligent person in the United States understands the sovereign debt crisis is coming to America if the Administration and Congress do not address the country’s structural  fiscal deficit and debt overhang,  and does so quickly.   In fact,  this was one of, if not, the message of the November election.

The U.S.  has a one-year window, in our opinion,  otherwise expect the Nostrodomus’ 2012 prediction “The Great Dog will howl at night” to come to pass.   It is our interpretation that:  a)  because sovereign bonds x/emerging markets are now acting like “dogs that don’t hunt”;  and b)   the U.S. does have the largest stock of sovereign bonds in the world;   Nostro must have been referring to a huge U.S. bond market crash in 2012.

Seriously, as we should be careful in interpreting prophecy, so to should we when looking at data and this EC chart, in particular.  First, we have learned from this crisis, even though the rating agencies may have not,  that a country’s banking system is an implicit liability of the sovereign unless it is willing to let it collapse during a time of great stress.   One of Europe’s major economic vulnerabilities is that many countries are over banked.   Ireland and Spain’s bank assets to GDP ratio are over 300 percent of GDP, for example.  Many of those assets were put on during a huge housing bubble.

When the Irish government  backstopped its banks during the crisis they took on huge contingent liabilities that are now coming home to roost.   The U.S banking system’s  assets are under 100 percent of GDP, however.  There are other contingent liabilities of the central government, such as those of Fannie and Freddie, that may come under fire if the crisis spreads here, however.

Second,  Europe didn’t have a crisis until interest rates shot up on European periphery bonds.   If Greece and Ireland could still finance at German interest rates, the periphery banks wouldn’t be under as much pressure and there would be no sovereign debt problem, at least not yet, in our opinion.

The U.S. government’s net interest to GDP has actually fallen even during the massive debt accumulation over the past two years,  mainly because the collapse of interest rates.   As you can see from the chart, this isn’t sustainable and once interest rates begin to rise,  the net interest burden will not only become an economic problem but a huge political problem as it crowds other public spending.

There is a  “tipping point” debt level and interest rate, which nobody knows and can calculate, where markets begin to lose confidence that the government will be able to service its debt in full and the ability to rollover existing bond maturities is impaired.   This is the point where a sovereign debt crisis becomes acute and really begins to accelerate.

This is why some very smart people are watching Japan, where sovereign debt to GDP is now 200 percent, financed primarily by domestic investors with a yield curve of 12 bps at the front-end for 3-month Bills and a 2.13 percent 30-year bond.    If there is a sustained rise in interest rates in Japan — not impossible, but unlikely — its time to start channeling our inner Nostrodomus.

Related Articles
Japan’s Savings Crisis – Martin Feldstein
Hugh Hendry: Japan Is A “Nuclear Bomb Strapped Onto The Chest Of The Global Economy” – Business Insider

Posted in Black Swan Watch, Fiscal Policy, Sovereign Debt, Sovereign Risk, Uncategorized | Tagged , , , | Leave a comment

S&P500 Forward P/E Heatmap & Alcoa Earnings

This is great heat map of the forward price earnings ratio of stocks that comprise the S&P500.  Unless analysts have totally missed the mark and guidance surprises to the downside,  many stocks in the S&P500 just don’t look that expensive, especially given the alternatives of negative real returns on cash and the recent performance in the bond markets.   Our sense is the integrity of the metrics and comps have been a little more than compromised given we’re in uncharted waters of zero interest rates and mass government intervention into the markets and economy.   We never, ever, thought we’d see the day where major central banks would explicitly target stock prices.

We’ll be watching earnings closely to see if last year’s growth was just an inventory rebuild and only a dead cat bounce off the 2007/08 collapse.  The basis for comparison will certainly be higher now and the market may have trouble with what looks like a slowing of the acceleration of growth,  i.e., a negative second derivative.    The market is overextended and we wouldn’t be surprised to see some “sell the news” profit taking.    On the other hand, this sure feels like a market that won’t let the underinvested in.

Alcoa kicked off earnings season tonight and beat both EPS and revenue expectations.  Shares slid a bit in after hours, hour.   Management presented this interesting chart on the conference call, which illustrates their 2011 expectation in both sectors and regions.   Note the growth in North American trucking.   Alcoa CEO, Klaus Kleinfiled had this to say,

We expect 2011 to continue to grow and 9% to 14% is our number. Heavy trucks and trailer, we expect a global growth between 0% and 5%. North America, pretty good — a pretty good improvement, truck demand up by 25%, production year-on-year November up to 32%, 150,000 units. Trailer shipments up 50%, trailer backlog has grown by 225%. We expect an increase of 27% to 33% in 2011.


S&P 500 Forward P/E   January 10, 2011

Posted in Equities | Tagged | Leave a comment

Whoops!

The Oregon call in the prior post illustrates:  a)  I am right, it’s the market final score that’s wrong;   b)  confirmation bias; and c)  unlike traders and money managers, who have skin in the game,  those with little or none,  such as economists,  strategists, and market gurus,  can make outlandish “shock jock” market calls with little consequence.    If you’re gonna’ bet the ranch in Oregon,  you better have deep pockets.

Feel bad for Oregon the game really came down to a tackle that really wasn’t a tackle.   Congrats to Auburn.  What a great QB!

Posted in General Interest | 1 Comment