Though not the norm in the U.S., this is the type of inflation I saw in Argentina in the late 1980s for almost all goods and services and is unlikely to be the convention here unless the Fed is forced to support and finance the Treasury market. More likely today than six months ago, but highly unlikely, nonetheless.
‘It was March 2021, and the Federal Reserve Bank of St. Louis president couldn’t find the model he wanted in the local store, which was 90% empty. So he ordered online — only to be asked, when the bike was delivered four months later, for an inflation surcharge of around $200. He refused to pay, but came away distressed.
“The idea that you’re changing prices in the middle of some transaction was alarming to me,” Bullard recalled in an interview last month. “It was very telling about the environment.”’ – James Bullard, St Louis Fed President, Bloomberg
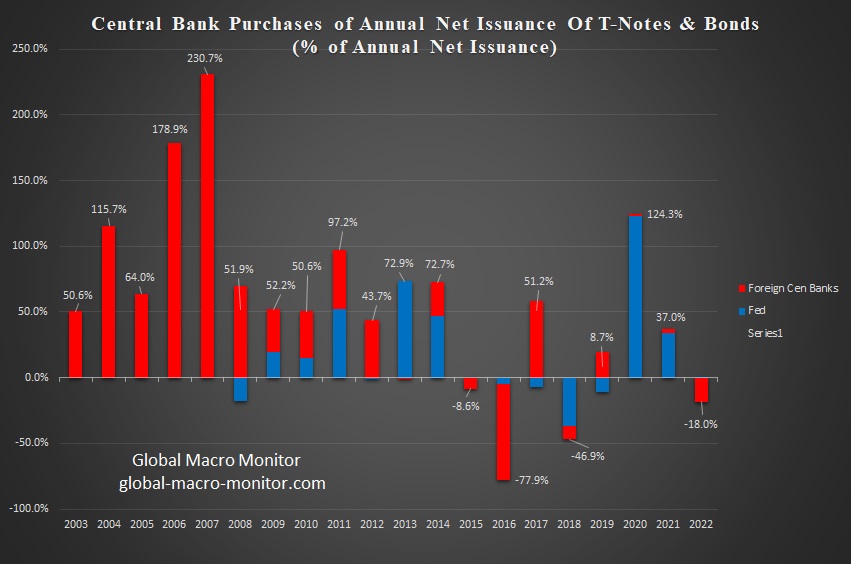
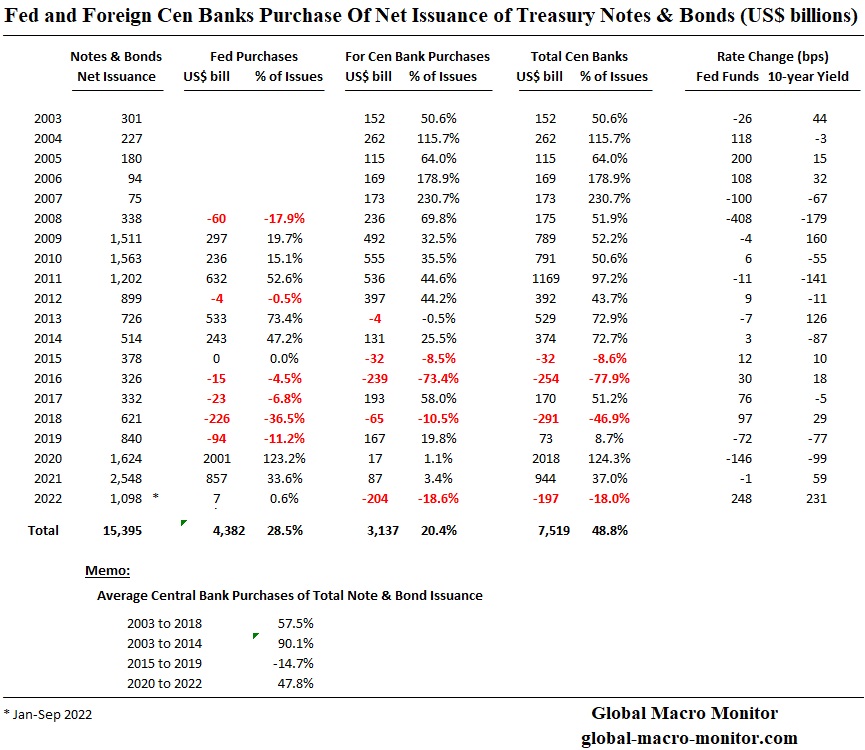
We have updated the data we promised in our recent post of a repost, Where The Next Financial Crisis Begins. Our narrative for why the Treasury market is convulsing with a lack of liquidity is that the largest buyers of notes and bonds over the past twenty years have been central banks, both the Fed and foreign, and now have become net sellers. This will have huge implications for other markets.
It’s just simple math, folks. The money to finance the U.S. deficits has to come from somewhere. With the central banks gone, it is now a zero-sum game.
Time to familiarize yourself with the term “crowding out.”
Our good friend, King David, just forwarded this Bloomberg headline to remind us of a post we made back in 2018, which we have reposted below. Maybe, or maybe not, but you should have the following analysis in your quiver, at the very least to stress test your market narrative. We do need to update the data, which are quite stunning and rather surprising.
We are not sure of how the next financial crisis will exactly unfold but reasonably confident it will have its roots in the following analysis. Maybe it has already begun.
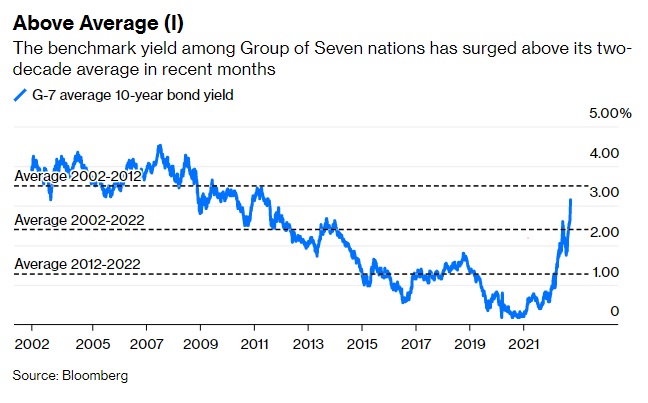
The U.S. Treasury market is the center of the financial universe and the 10-year yield is the most important price in the world, of which, all other assets are priced. We suspect the next major financial crisis may not be in the Treasury market but will most likely emanate from it.
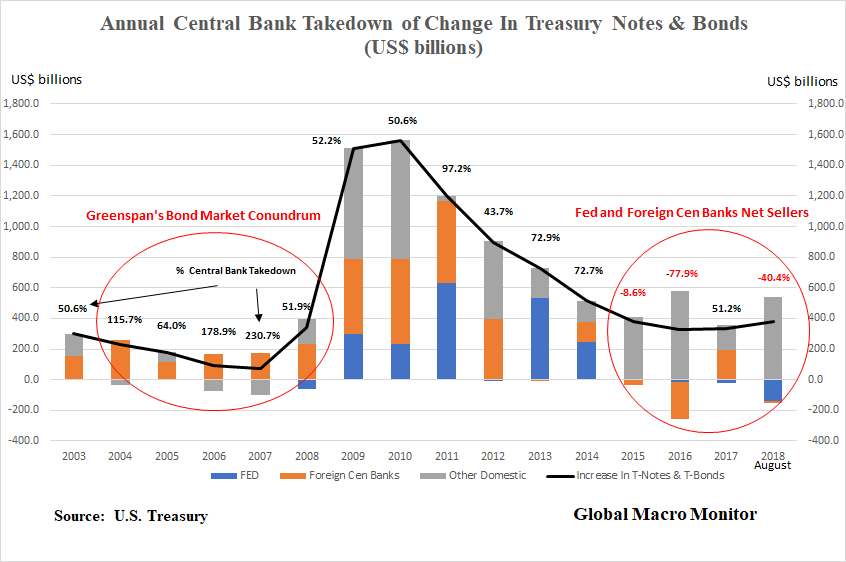
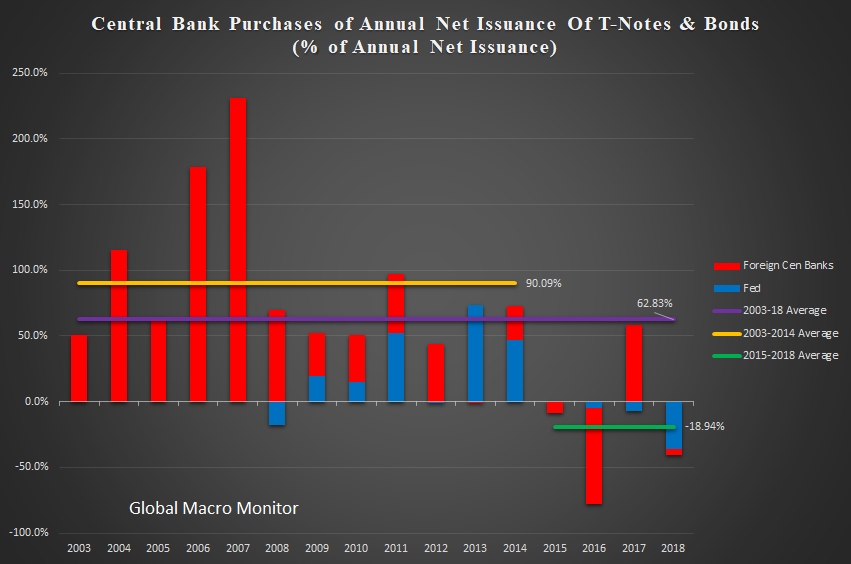
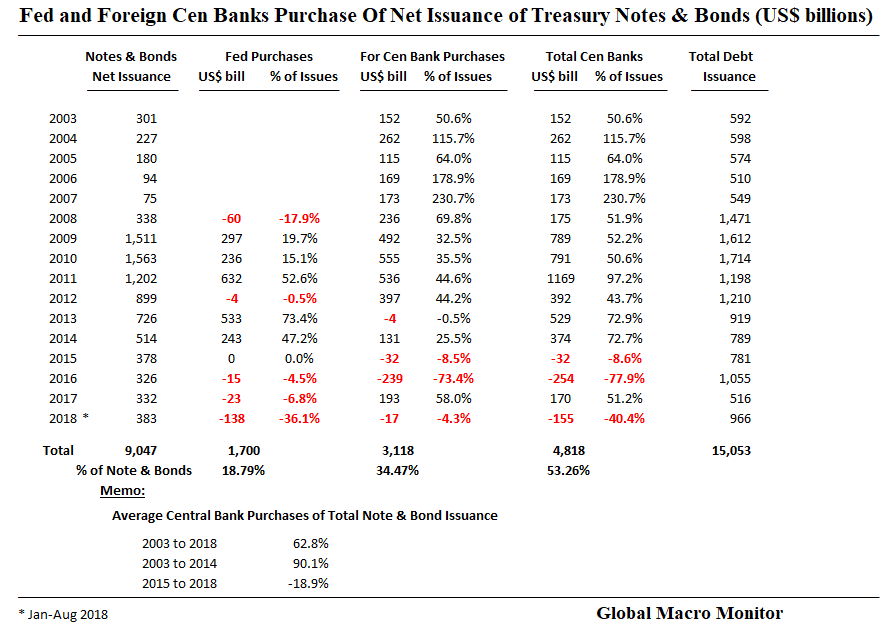
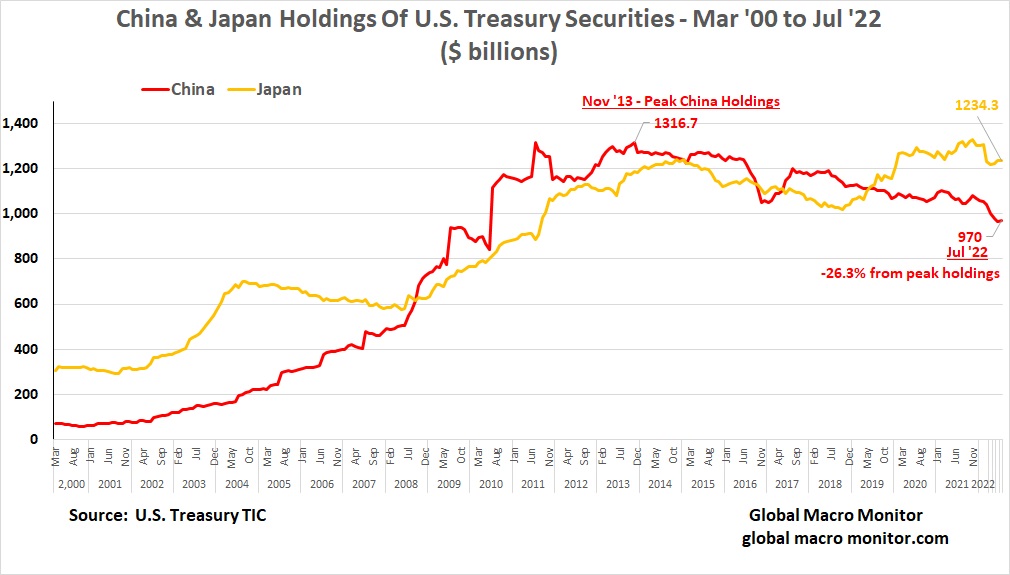
U.S. Public Sector Debt Increase Financed By Central Banks
The U.S. has had a free ride for this entire century, financing its rapid runup in public sector debt, from 58 percent of GDP at year-end 2002, to the current level of 105 percent, mostly by foreign central banks and the Fed.
Marketable debt, in particular, notes and bonds, which drive market interest rates have increased by over $9 trillion during the same period, rising from 20 percent to 55 percent of GDP.
Central bank purchases, both the Fed and foreign central banks, have, on average, bought 63 percent of the annual increase in U.S. Treasury notes and bonds from 2003 to 2018. Note their purchases can be made in the secondary market, or, in the case of foreign central banks, in the monthly Treasury auctions.
In the shorter time horizon leading up to the end of QE3, that is 2003 to 2014, central banks took down, on average, the equivalent of 90 percent of the annual increase in notes and bonds. All that mattered to the price-insensitive central banks was monetary and exchange rate policy. Stunning.
Greenspan’s Bond Market Conundrum
The charts and data also explain what Alan Greenspan labeled the bond market conundrum just before the Great Financial Crisis (GFC). The former Fed chairman was baffled as long-term rates hardly budged while the Fed raised the funds rate by 425 bps from 2004 to 2006, largely, to cool off the housing market.
The data show foreign central banks absorbed 120 percent of all the newly issued T-notes and bonds during the years of the Fed tightening cycle, freeing up and displacing liquidity for other asset markets, including mortgages. Though the Fed was tight, foreign central bank flows into the U.S., coupled with Wall Street’s financial engineering, made for easy financial conditions.
Greenspan lays the blame on these flows as a significant factor as to why the Fed lost control of the yield curve. The yield curve inverted because of these foreign capital flows and the reasoning goes that the inversion did not signal a crisis; it was a leading cause of the GFC as mortgage lending failed to slow, eventually blowing up into a massive bubble.
Because it had lost control of the yield curve, the Fed was forced to tighten until the glass started shattering. Boy, did it ever.
Central Bank Financing Is A Much Different Beast
The effective “free financing” of the rapid increase in the portion of the U.S debt that matters most to markets, by creditors who could not give one whit about pricing, displaced liquidity from the Treasury market, while, at the same time, keeping rates depressed, thus lifting other asset markets.
More importantly, central bank Treasury purchases are not a zero-sum game. There is no reallocation of assets to the Treasury market in order to make the bond buys. The purchases are made with printed money.
Reserve Accumulation
It is a bit more complicated for foreign central banks, which accumulate reserves through currency intervention and are often forced to sterilize their purchase of dollars, and/or suffer the inflationary consequences.
Nevertheless, foreign central banks park much of their reserves in U.S. Treasury securities, mainly notes.
Times They Are A-Changin’
The charts and data show that since 2015, central banks, have, on average been net sellers of Treasury notes and bonds, to the tune of an annual average of -19 percent of the yearly increase in net new note and bonds issued. The roll-off of the Fed’s SOMA Treasury portfolio, which is usually financed by a further increase in notes and bonds, does not increase the debt stock, but it is real cash flow killer for the U.S. government.
Unlike the years before 2015, the increase in new note and bond issuance is now a zero-sum game and financed by either the reallocation from other asset markets or an increase in financial leverage. The structural change in the financing of the Treasury market is taking place at a unpropitious time as deficits are ramping up.
Because 2017 was unique and an aberration of how the Treasury fnanced itself due to the debt ceiling constraint, the markets are just starting to feel this effect. Consequently, the more vulnerable emerging markets are taking a beating this year and volatility is increasing across the board.
The New Market Meta-Narrative
We suspect very few have crunched these numbers or understand them, and this new meta-narrative, supported by the data, is the main reason for the increase in market gyrations and volatile capital flows this year. We are pretty confident in the data and the construction of our analysis. Feel free to correct us if you suspect data error and where you think we are wrong in our analysis. We look forward to hearing from you.
Moreover, the screws will tighten further as the ECB ends their QE in December. We don’t think, though we reserve the right to be wrong, as we often are, this is just a short-term bout of volatility, but it is the beginning of a structural change in the markets as reflected in the data.
Interest Rates Will Continue To Rise
It is clear, at least to us, the only possibility for the longer-term U.S. Treasury yields to stay at these low levels is an increase in haven buying, which, ergo other asset markets will have to be sold. If you expect a normal world going forward, that is no recession or sharp economic slowdown, no major geopolitical shock, or no asset market collapse, by default, you have to expect higher interest rates. The sheer logic is in the data.
Of course, Chairman Powell could cave to political pressure and “just print money to lower the debt” but we seriously doubt it and suspect the markets would not respond positively.
Repost of an oldie but goldie, (as in a decade old), especially relevant given the rumors in today’s market. Here’s to hoping the policymakers have rectified some of the issues, but in our experience goveventments are reactive to a crisis rather proactive to prevent one. More research needed, another post coming.
Here’s in an interesting chart, originally posted over at Zero Hedge, that makes us wonder do we really want to be long the Swiss franc during a European banking crisis? Note the chart may be a little dated, but we think you get the picture. Click chart for bigger picture and better resolution.
We’ve been all over the “Big Reset,” which is upending many things. It’s disheartening to hear most of the Street analysts speak as if nothing has changed but prices.
All things as we have known and have become comfortably numb with, such as zero interest rates, negative real interest rates, quantitative easing (digital money printing), [Chimerica, a placid labor market, trade and investment flows] and Pax Americana, [and central bank dominance of the U.S. bond market] are being upended and overturned. Beware of recency bias, folks, as the global structural shifts and changes are now ubiquitous. – GMM, Sep 23rd
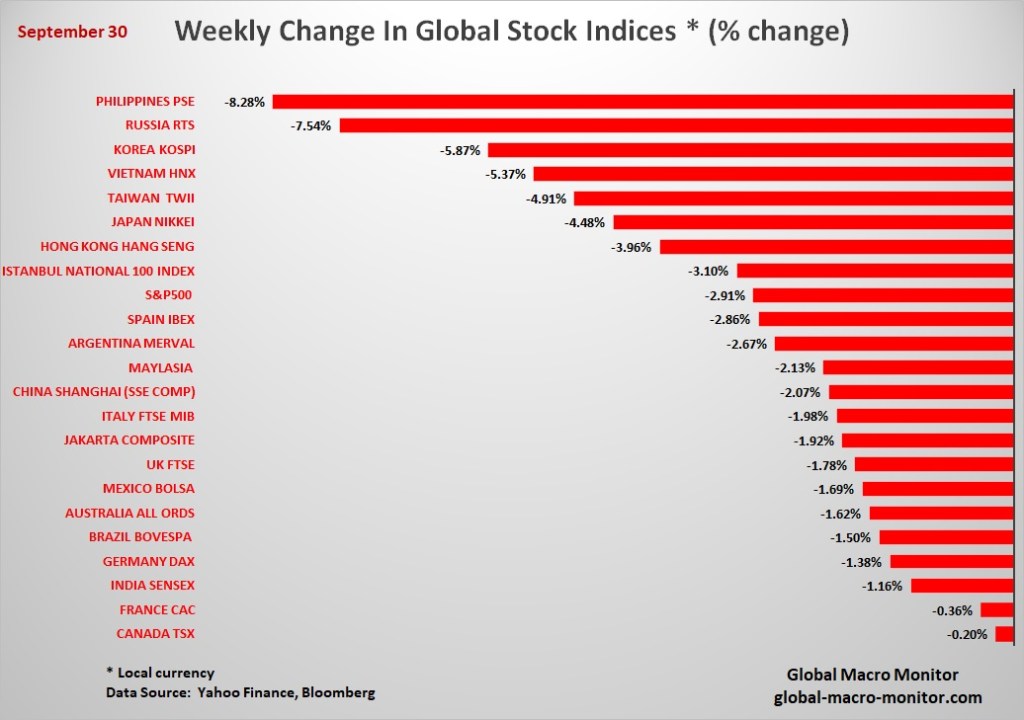
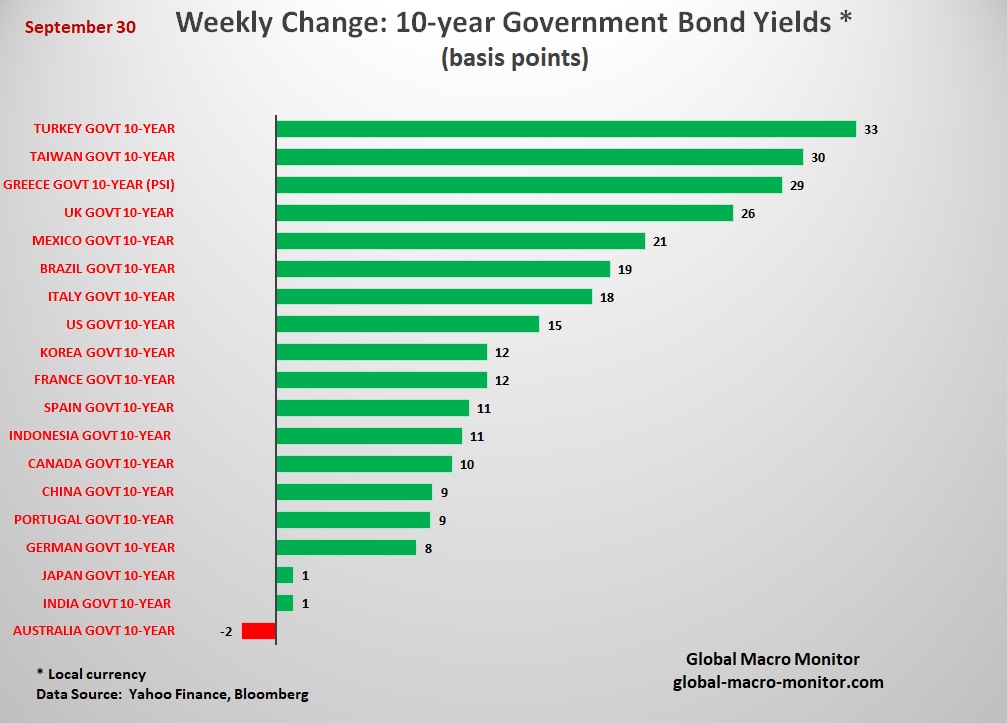
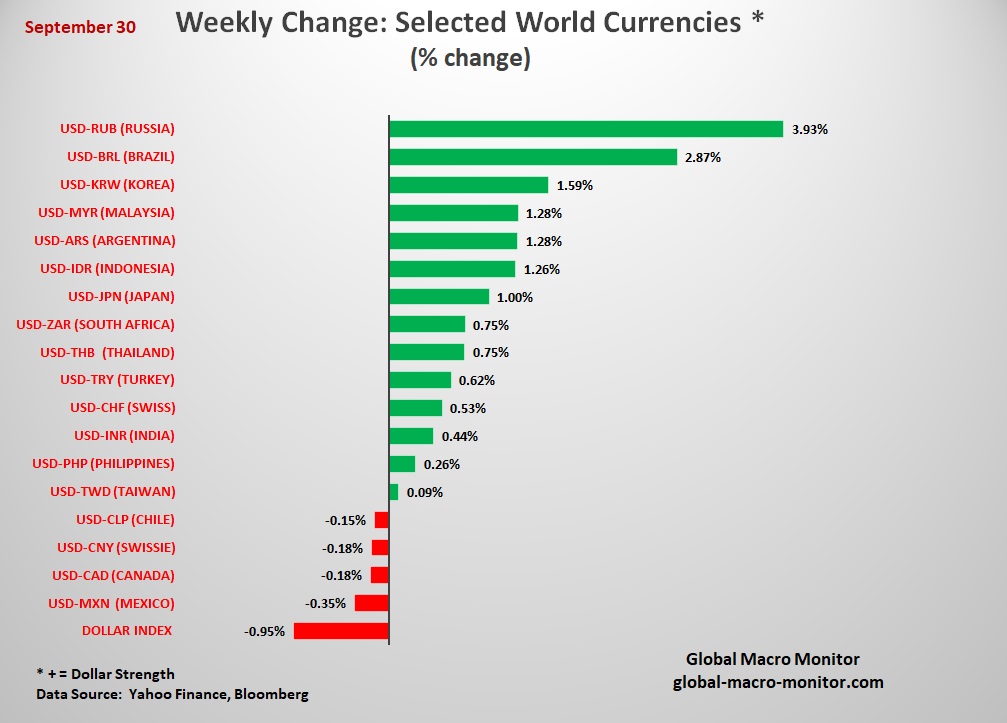
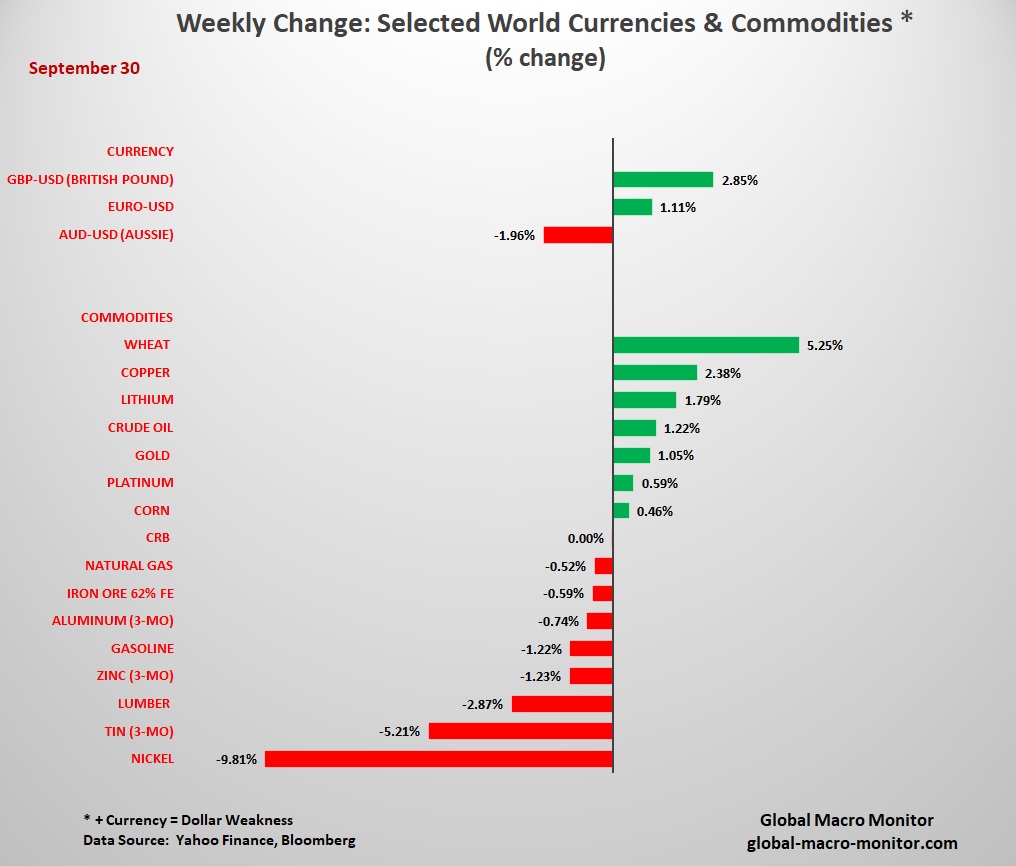
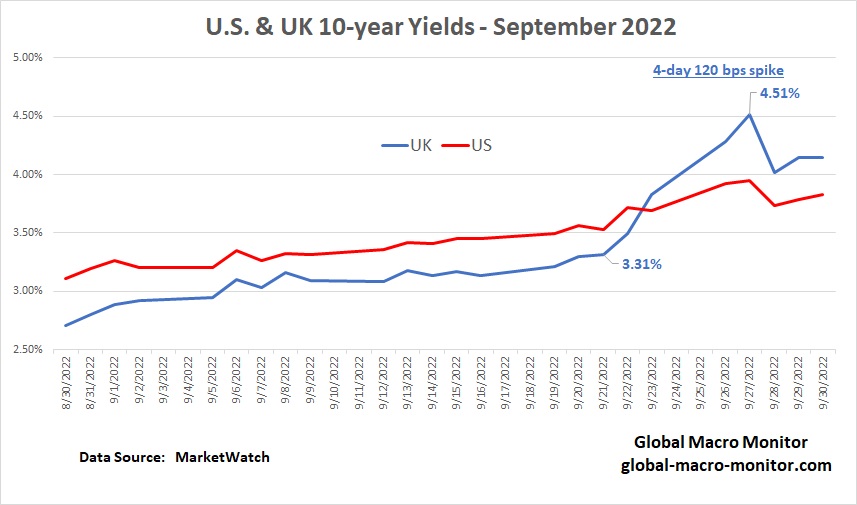
Here’s an example of how markets are convulsing to the Big Reset.
“Painful Regime Change”
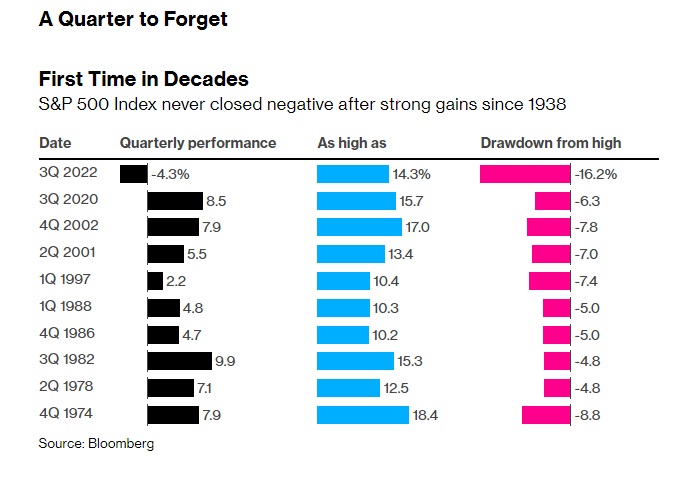
The third quarter will also get its place in the history books for one of the biggest reversals: It is the first quarter since 1938 that the S&P 500 Index closed in the red after gaining more than 10%.
All in all, 2022 is the year that reflects a “painful regime change,” said Michael Hartnett, BofA’s chief investment strategist. – Bloomberg
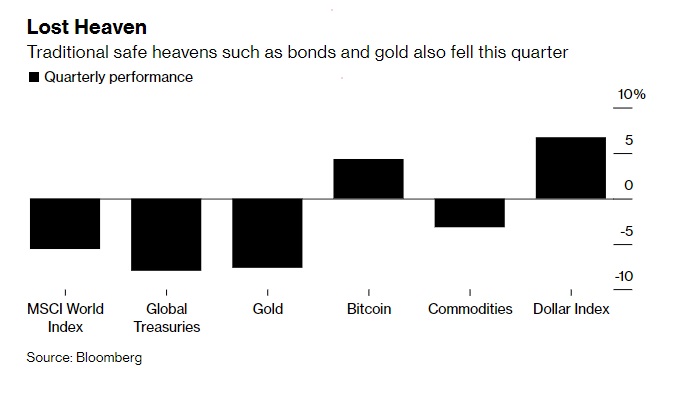
Nowhere To Hide
Even during the Great Depression, bonds made money, but not in stagflation, including during the 1970s. There has been nowhere to hide this year.