
The next big number on the downside for the S&P is 3838.79, which brings the first Fib retracement level of the secular bull market that began in March 2009 into play. It will get some attention. Watch that space.

The next big number on the downside for the S&P is 3838.79, which brings the first Fib retracement level of the secular bull market that began in March 2009 into play. It will get some attention. Watch that space.
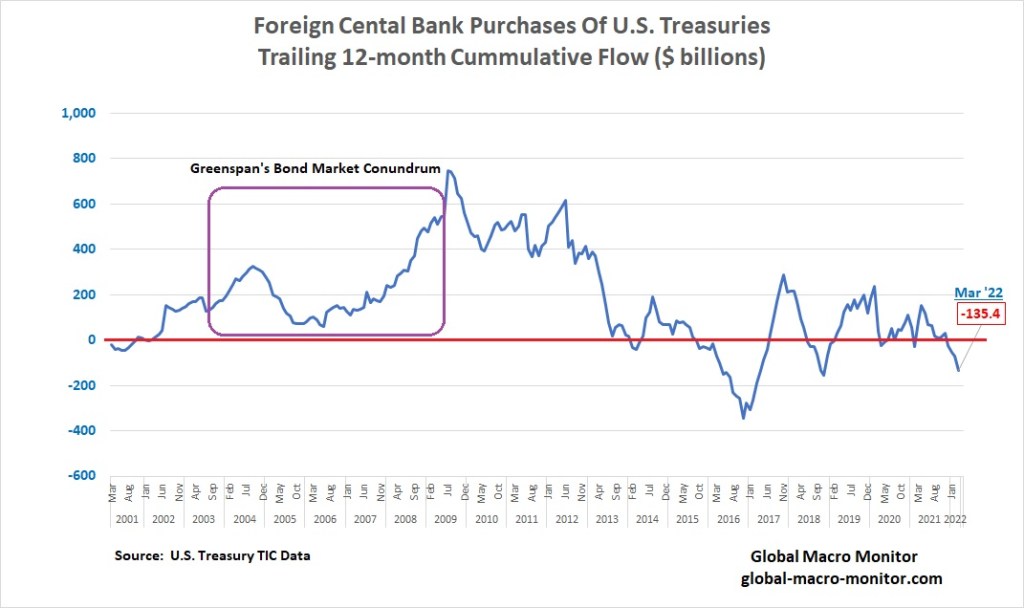
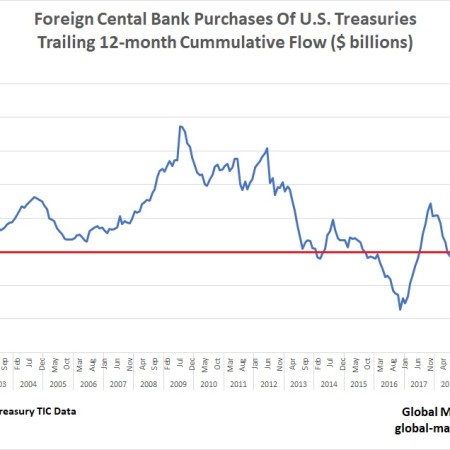
The U.S. Treasury released its TIC data this afternoon, which confirmed our priors that foreign central banks continue to sell off their Treasury holdings, down $98.4 billion in March and -$135.4 billion over the past 12 months. Surprisingly, Japan was the biggest seller in March and not China, as we speculated. The cost of hedging dollar/yen FX risk has risen and dramatically reduced the return on U.S. Treasuries for yen investors.
The fact that both the foreign central banks and now the Fed are net sellers in aggregate, who have been the largest buyers this century, is not market positive and suspect it is going to a number on Treasury yield volatility over the next few years. No doubt there will be occasional bursts of buying from haven flows, duration jockeys, private foreign investors, reallocators (sellers as stocks fall) and hedge funds using bonds as a proxy for shorting stocks but at a -5.0 percent 10-year real yield will not get many real long-term investors lathered up.
The era of yields detached from fundamentals, as the major buyers, who have not been price sensitive, become net sellers is coming to an end, in our opinion. It’s a big deal, folks.
Recall, Greenspan partially blamed the Fed’s loss of control of the yield curve during its 2004-06 tightening cycle on foreign central bank inflows into the Treasury market, which repressed long-term rates and kept the housing bubble raging even as the Fed raised the Fed Funds rate 425 bps.
Don’t be complacent and blindsided by what is going on in this corner of the world. We suspect this space, it will soon be on the market’s radar.


#CKStrong
GMM will be going dark for a few weeks.
Watch This Space
We are waiting anxiously for Monday’s U.S. Treasury release of the TIC data, particularly the major foreign holdings of U.S. Treasury securities. We are closely monitoring the foreign official flows into/out of the U.S. Treasury market. March will be the first data point after Western nations sanctioned the Russian Central Bank at the end of February.
Foreign Central banks, which are not price or market-sensitive with their securities holdings, are now net sellers of Treasuries, albeit only slightly, with their holdings hovering around $4 trillion since 2012.. At the end of the aughts, central banks owned almost 75 percent of total foreign investments. They were recycling their reserves from current account surpluses back into the Treasury market to protect exchange rates from strengthening and becoming overvalued. Today, foreign central banks hold a little over 50 percent.
China
China’s holdings peaked in November 2012 at $1.3 trillion and are down about 20 percent to $1.05 trillion in February. We suspect China has accelerated its sales after the West sanctioned the Russian Central Bank. We believe the Chinese may perceive it to be foolish to keep $1 trillion of their $3 trillion in reserves in a country they view as an increasingly hostile power. Stay tuned.
New World Order
Russia’s invasion of Ukraine will likely usher in a multi-block New World Order with contracting international trade and capital flows, reversing many of the disinflationary forces of the past 25 years.
The numbers to monitor in the TIC data on Monday to realize if the “big bang” has commenced are China’s and foreign official holdings. We suspect both will be lower.
See you in a few weeks.

#CKStrong
The U.S. budget deficit (12-month trailing) has fallen from almost 20 percent of GDP in Q1 2021 — most of which was indirectly financed by the Fed and an increase in Treasury bill issuance — to our estimate of 4.91 percent for April. That’s an incredible fiscal adjustment – albeit from an extraordinary level — and explains much of the growth slowdown.
During my emerging market days, the first impression of seeing such a massive budget adjustment was that a dramatic fall in interest payments had occurred as inflation plummeted along with nominal interest rates falling. It was one reason why the “primary deficit” concept- the difference between government revenues and spending, excluding interest payments- was developed.
If U.S. interest rates rise to their true market-clearing levels, it probably won’t be long before we hear primary deficit debates at the kitchen table. Interest payments on the Federal debt in Q1 2022 totaled $561 billion annualized or about 2.3 percent of GDP, down from the high of 5 percent in the 1980s.
April Performance
Revenues for the Federal government were up 97 percent y/y in April (tax payment cycle getting back to normal coupled with strong “normal” growth), and expenditures fell 16 percent, resulting in a budget surplus for the month of $308 billion, the largest on record.
The normalization of the deficit helps the Fed exit its bond-buying business leaving private markets to finance the government shortfalls, which will still be more than $1 trillion per annum.
We suspect, without the Fed, it will take higher longer-term interest rates from current levels to attract buyers in a high inflation world, and is a, if not, the. major factor rocking stocks.
No Free Lunch
To finance itself, the government can’t rely on foreigners, haven flows, and stock short proxies (probably the dominant buyers over the past few days).
Time to pay up, Uncle Sam. Yields need to rise as and when the economy gets back to normal.
Otherwise, consumers will pay up with higher prices, just as they are now.
There are no free lunches in economics, folks.
Maybe delayed payment, at best, but someone eventually pays the price.

#CKStrong
Apple’s air pod revenues alone generated $23.05 billion in revenue during their 2020 financial year – this is more revenue than Twitter, Spotify and Square combined. It gives Netflix’s entire business a run for its money as well – coming in less than 10% shy of their total revenue. According to the financial markets as of today, Netflix is worth somewhere in the region of $260 billion which would indicate that based on revenue alone, Apple’s AirPod business is worth somewhere in the region of $240 billion… it is completely mind-blowing how successful Apple are at creating wants, needs and then delivering a product to satisfy. – Acumen, Dec ’21
#CKStrong
Those are the words of Matthew Shay, the CEO of the world’s largest retail trade association on CNBC today (1:07 minutes in). Does that sound familiar, folks?
Mr. Shay notes the consumer remains strong despite the recent inflation spike. He also added this zinger, making him sound like an analyst at GMM.
“The excess demand is driven by all the money that is out in the marketplace.”
[48 seconds in]
Refreshing view rather than the typical obfuscation of “the supply chain disruptions are causing the inflation.” The stimulus-driven demand has swamped the supply chain, though we do concede there are real supply chain disruptions, which are affecting inflation. Not the predominant factor, however.
#CKStrong
Updated: Post-CPI release @ 9:12 pm PT, May 11, 2022
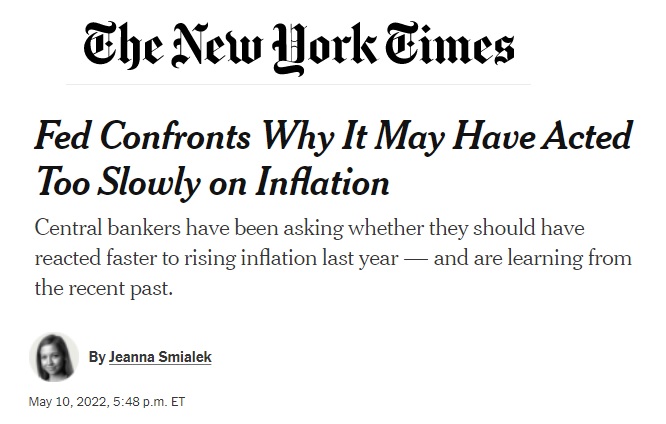
But the Fed seems to be learning lessons from its 2021 experience. – NY Times
The Fed is under a lot of heat for letting inflation get out of control, which is now generating super hawkishness even among the most gentle of monetary doves. The scorching is illustrated in the above NY Times headline.
We are reposting our piece from last April 2021, Just In Case, You Think The Fed Has A Clue, in which we questioned the Fed’s economic sanity to keep buying mortgages while the housing market was in a massive bubble.
Bond yields are now spiking, and the stock market suffers because of the monetary authorities’ ineptitude as the economy contemplates a bond and stock market without central banks. The major buyers of Treasury securities since the beginning of the century have now morphed into net sellers in aggregate.
Nevertheless, making monetary policy is difficult, especially in the last few years, so we grant policymakers considerable grace.
Valuations and multiples have to come down as interest rates rise.
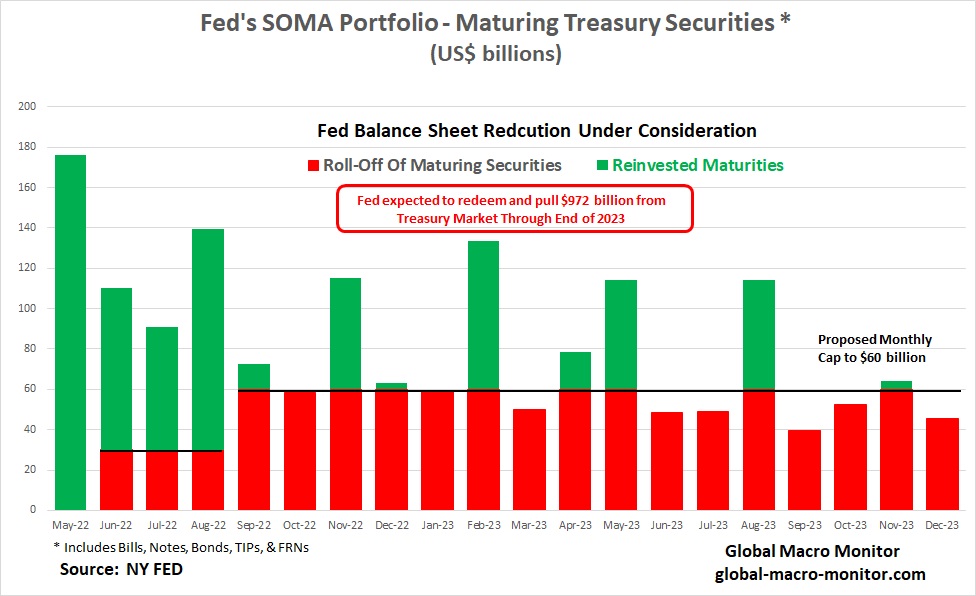
Given the FOMC’s latest statement on balance sheet reduction, we estimate the Fed will be extracting almost $1.5 trillion from the economy throughout 2023, approximately $972 billion from the Treasury market, and a maximum of just over $500 billion in mortgages.
Inflation As The End Game
However, we doubt the Fed and the American body politic have that high of a pain threshold for the subsequent economic and financial pain such a monetary tightening will bring. We, therefore, expect inflation will be the end game but only after, at the very least, a few deflation scares. When the going gets tough, the Fed will default to the mantra of most central banks and monetary authorities throughout history,
Print [debase], baby, print [debase]!
Housing Is Now The Problem, And Its Measurement Is Fatally Flawed
We estimate the Fed bought over $525 billion in mortgages between March 2021 and March 2022. During this period, the housing market was in Fuego with FOMO panic buying, driving up the National Price Index by 18 percent during the same period.
Moreover, the 30-year fixed-rate mortgage rate was up 150 bps, or 47.3 percent, driving up the cost of the monthly mortgage payment on the average house price in the United States by almost 75 percent. Let’s repeat that, folks, our best approximation of the cost of a monthly 30-year fixed-rate mortgage payment is up 75-100 percent in the past year.
The official measure for owners’ residential home inflation in the CPI basket is up a relatively measly 4.5 percent year-on-year as measured by Owners Equivalent Rent (OER), 24 percent of the CPI basket. What a complete joke.
Watch this space in tomorrow’s CPI release. [OER came in today up 4.8 percent y/y, which kept the overall number hotter than expected.]
The spike in mortgage payments has priced out most first-time buyers, forcing them into the rental market (7.4 percent of the CPI), raising rents by over 4 percent in the past year.
Different Housing Market Than The GFC
Of course, the housing market is in a much different condition than it was at the onslaught of the Great Financial Crisis (GFC), as all cash payments — an acute reflection of too much “money” in the system — have replaced the funky, highly levered subprime mortgages.
The result should be the reverse of the GFC, where housing prices collapsed almost overnight. This time, we expect a slow and chronic leak in housing prices with fewer forced bankruptcies, and less sensitivity to mortgage rates as they continue to climb until the Fed gets rolling in draining the excess money from the economy.
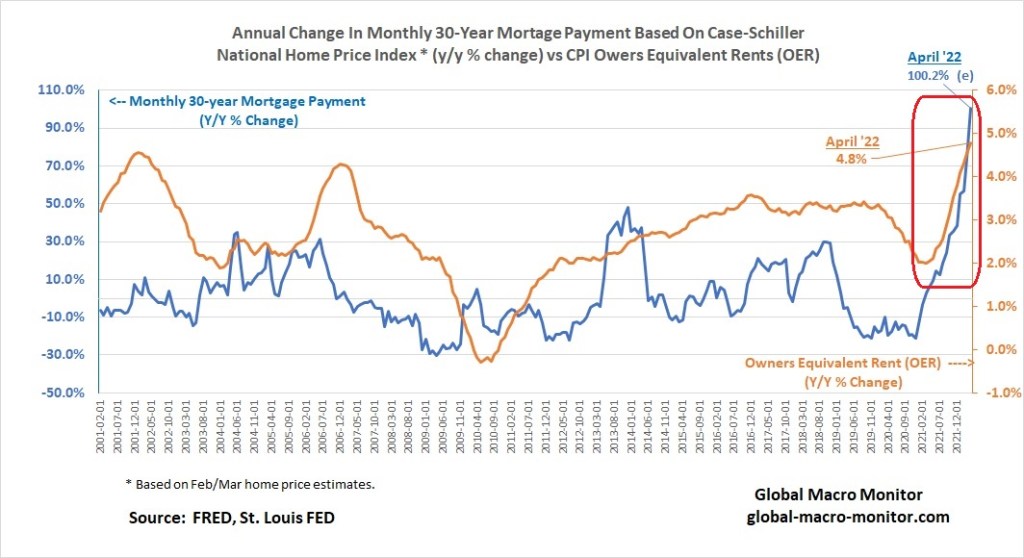
OER Starting To Track Real Housing Costs
Let us beat this dead horse one more time.
The above chart also illustrates that OER is starting to track the monthly mortgage payment for the first time, which is not a positive for the Fed or inflation.
The reason for this apparent disconnect is that most homeowners and renters did not move in 2021. They thus did not have to pay the spot price for shelter as it rose rapidly. Instead, many had to pay the rate that they signed for earlier in the year or the rate they signed for years earlier that had been modified slightly by their landlord or bank. These prices should tend to converge to the market price, but the lag time may be significant and the convergence incomplete. – VOX.eu
If homeowners have changed their perfunctory answer to the BLS survey question used to calculate 24 percent of the CPI
“If someone were to rent your home today, how much do you think it would rent for monthly, unfurnished and without utilities?” – BLS
to one where homeowners perceive themselves as real renters that track real mortgage costs, or if they get the Airbnb bug, the measured inflation rate for shelter will continue to rise. This may or may not be happening but keep it on the radar.
If it does, expect the Washington bureaucrats to start tinkering with the cost of shelter in the CPI as they did in 1983. See our post, Today’s Inflation Rate And Nolan Ryan’s Fastball.
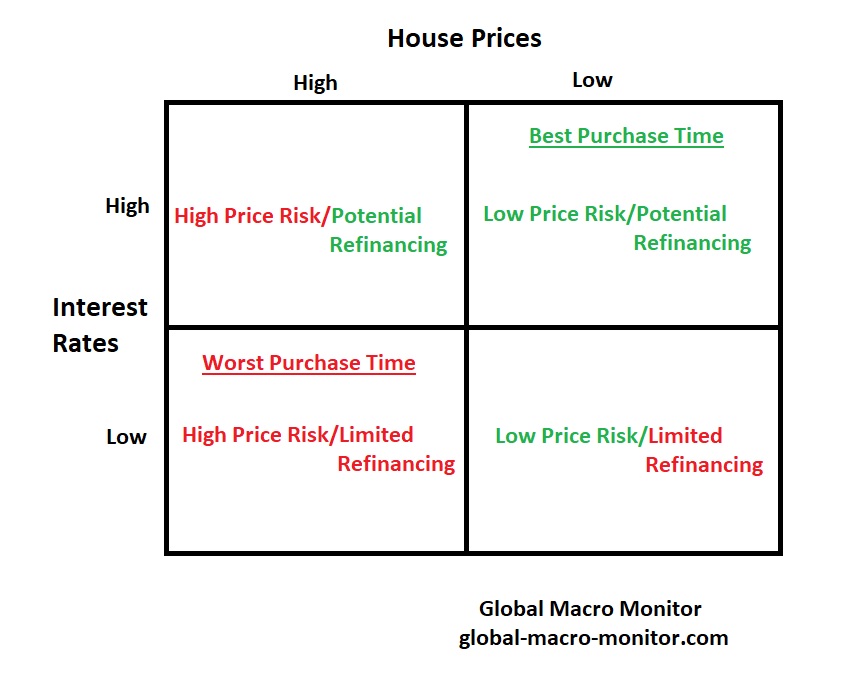
Best & Worst Time To Purchase A House
We feel for first-time homebuyers caught up in the FOMO bubble of the past year. We concede they may have some inside knowledge of a potential spooky inflation to come, but stretching to buy a starter home on a limited budget when interest rates are at artificial and historic lows, and prices at record highs can, and most likely, will be a toxic cocktail. Of course, we are not talking about the properties or “LifeStyles Of The Rich And Famous.”
Originally Posted on April 29, 2021 by macromon
This should dispel the notion.
Can’t wait to hear the Chairman justify zero rate policy and deficit monetization with inflation roaring at > 5 percent. It would be entertaining if it weren’t so damaging.
Where To Inflation?
Here’s a pretty good theoretical model (follow the entire thread) estimating that U.S. inflation may reach double digits by Q1 2022. One of the premises is that monetary authorities have no way out of this rabbit hole and are constrained by the risk of severely disrupting financial markets in an asset dependent economy.
Recall our view that deflation/inflation is a corner solution and Wall Street’s “Goldilocks” scenario is still just a marketing gimmick. Deflation as markets try to move back to mean valuations – a lot lower – or inflation, and lots of it.
h/t CG
Anyone with a better model, lay it on the table. Stop with the “fake news” or “don’t worry” nonsense. CPI prints > 4 percent in May and you heard it here first.
GMM’s Health Wars
CK and I are battling some serious health issues. Mine, an acute skirmish, which I am now recovering.
CK’s, a three-front protracted war. Her courage to get up and fight everyday has been such an inspiration during my little battle. She also saved my life by forcing me to “ignore my primary doctor’s diagnosis of “all is well” and aggressively pursue my symptoms.” If not for that, the Grim Reaper would have liquidated my position and GMM would be no more. Thanks, CK.
#CkStrong
When your fave local coffee house has eliminated the 15 percent gratuity option on Square. That is today relative to a fortnight ago, folks.
Racking my brain to find the Gruatity supply chain disruption here. Anyone?
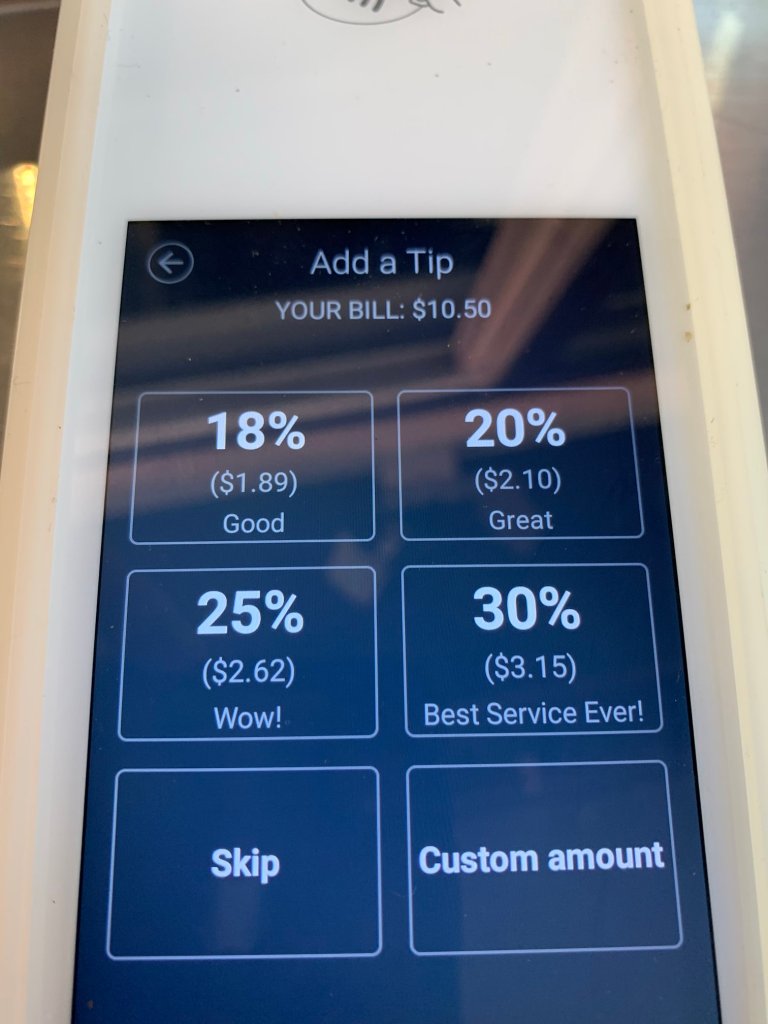
Classic case of inflationary expectations becoming deeply imbedded in the economy or is it possibly a relative price shift as political power moves to favor labor vs. Das Kapital? We think a bit of both.
Mr. Powell has a lot of wood to chop, if he could chop wood. But can and will he?
Serious doubts about the number and strength of his and the FOMC’s vertebrate when the going gets tough. And it will get tough.
We suspect today’s stock market mega ramp is not exactly what the Fed wanted. “Reducing demand to dampen inflation?” Total the oppo today, folks. Wealth effect.
The Fed needs asset prices lower in the near term.
A Slave To Goods & Serivces Inflation vs. Asset Inflation
That is the economic trade-off now, folks.
You can’t serve two masters: reducing inflation while serving asset inflation.
No one can serve two masters. Either you will hate the one and love the other, or you will be devoted to the one and despise the other. – Gospel of Luke

