
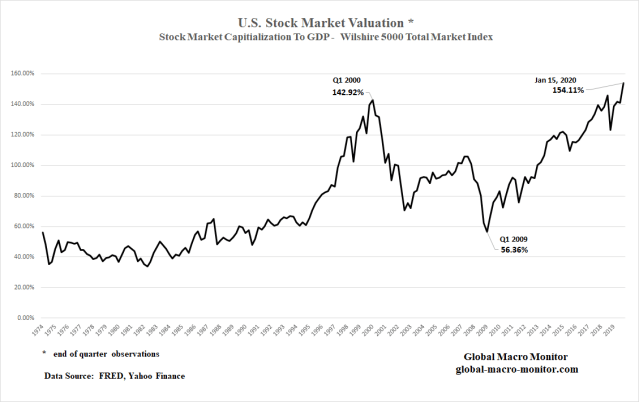
This is some chart. Even if you assume a structural shift in valuations began when the Fed started backstopping markets after the 1987 crash, that puts the average valuation of the Wilshire Market Cap to GDP at 92.58 percent. That’s an extremely mean regression to the mean from current levels.
Upshot?
We are all momentum algo traders now. When it stops, nobody knows.
Patience, grasshopper. We wait patiently on the beach for the fever to break.
Stock prices are likely to be among the prices that are relatively vulnerable to purely social movements because there is no accepted theory by which to understand the worth of stocks….investors have no model or at best a very incomplete model of behavior of prices, dividend, or earnings, of speculative assets. – Robert Shiller, GMM Dec’ 10


Pingback: This Week’s Best Investing Articles, Research, Podcasts 1/17/2020 - Stock Screener - The Acquirer's Multiple®