
CPI inflation hit 9.1 percent in June. The FinMedia is quick to point out it was “the highest level in more than forty years,” We doubt you will hear (at least from them) any context or the rest of the story. So here you go:

History Not On Inflation’s Side
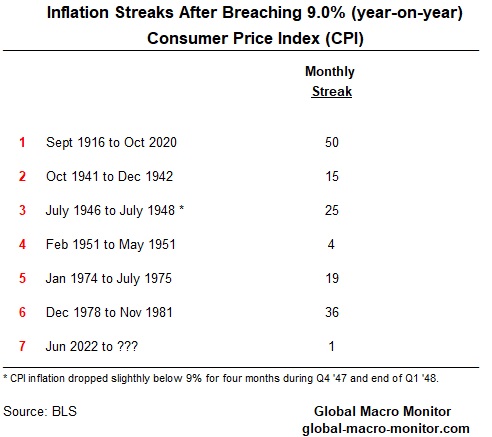
We looked at the inflation data going back to 1914, and our analysis surprised even us. Monthly annual CPI inflation has initially breached 9.0 percent only six times over the past hundred years – seven counting June 2022 (see chart above).
Once busting through the 9 percent (y/y) mark, inflation has never peaked or retreated from that level but only accelerated or stayed elevated for several consecutive months. The four-month streak during the Korean War was the shortest and is referenced by the following:

Worth Reiterating: Inflation Streaks When It Surpasses 9 Percent
Let’s repeat that. Once inflation initially breaches 9 percent, there has never been a case in the history of the data that it peaked or stopped there. This is so au contraire to the conventional wisdom of the markets that inflation has peaked, and the Fed is ready to “pivot.” Maybe “this time is different,” but we loathe those words and always make it a point to run away and fast when we hear them.
Behavior Changes As Inflation Increases
Economic agents change their behavior when inflation increases, especially as it approaches double digits. The willingness to hold cash balances diminishes, and money velocity, the inverse of money demand, increases when inflation starts to creep higher, causing more inflation. Central banks have found this feedback loop very difficult to break.
The problem is there is no clear or realistic definition of “money” and how to measure it. There is both exogenous money created by the central banks and endogenous money created by the private sector.
Inflation Is A Macro Concept
Quantity Theory Of Money
MV = PY
where,
M = Money
V = Velocity
P = Price Level
Y = Real GDP or production
Moreover, inflation, similar to the trade deficit, is a macro concept. Supply shocks don’t cause inflation unless they are monetized. Supply shocks cause relative price shifts, either temporary or permanent, and consumers and producers adjust their behavior and budgets accordingly.
Similarly, the overall trade or current account deficit is not the result of tariffs or trade policies but a macro concept:
Trade Deficit = Investment (private + public) – Savings (private + public)
In our recent observations, we suspect few genuinely understand the difference between changes in relative prices and inflation, even among some “so-called” economists.
Exogenous vs. Endogenous Money
We have a pretty good idea of how much “exogenous money” has increased, more than $10 trillion, or around 50%, by the major central banks, over the past few years. It is nearly impossible to quantify or measure the money, as loosely defined, that the private sector has created, which the Fed is fighting hard to control and slow by raising interest rates.
Bathtub Overfloweth
If I had to use one simple example today to explain what is going on with inflation, it would be the following picture of a bathtub overflowing:

Assume the water in the tub above is the global economy’s liquidity, which drives aggregate demand for goods and assets. It consists of the exogenous or base money created by the central banks and endogenous money created by the private markets.
My 19-year daughter, for example, recently received an offer for an $18k line of credit and was able to take out a car loan with no cosigner at a rate less than 3.0 percent.
The overflow is also the inflation now wreaking havoc in the goods & services market.
Interest Rate Hikes To Slow Endogenous Money
The Fed is trying to slow or reduce the flow of endogenous money through interest hikes. July’s massive stock and credit rally are indicators that financial conditions in the U.S. are easier than last month, even as the Fed tightens. That’s not inflation (as in going down) positive, folks.
Quantitative Tightening
The Fed plans to extract $2 trillion of exogenous money from the liquidity tub throughout 2023, which should make life interesting.
Money will get tight (the water level in the bathtub will recede) if the Fed follows through with its tough talk, but given the action of the markets over the past few months, the markets don’t believe the Fed and/or the “neutral rate” is nowhere even close.
Come on, man, a neutral funds rate at a negative 7 percent real rate? Seriously?
High inflation is a positive for nominal corporate revenues, which are showing up in the recent earning releases adding vigor and rationalizing the market rally. Monetary policy has yet to really bite.
Yeah, yeah, the yield curve inversion in a distorted bond market. Someday we will have a recession, and eventually, someday, I am going to die — the yield curve inversion is telling me so. Timing is everything.
Where is a law that states inflation can’t coexist with lower economic growth or recession? Not a bad “useful delusion” for the markets to grasp onto, however.
Old Monetary Aggregates
We view the old monetary aggregates – M1, M2, etc. – about as useless as the price of horseshoes as a leading indicator for the economy. Why isn’t my Schwab margin account counted as a deposit in the monetary aggregates? I can write checks from it.
Nevertheless, we can still glean a slight sense of what the economy is doing by looking at the old aggregates. Still, when, say, an asset class such as crypto can be created out of nothing, produce nothing, be leveraged and monetized to buy, say, Teslas, we consider that money in the true sense as it creates purchasing power. It is inflationary, by the way. In contrast, the crypto crash has been deflationary on the margin.
The recent massive rally in stocks, spread product, credit, and the growth and creation of alternative spec assets, such as crypto and NFTs, are money to us and becoming more authentic. As FinTech advances, assets become more liquid, complicated, and easier to use as collateral and leverage, understanding and making monetary policy becomes much more difficult.
Inflation “Hitting Streaks” Throughout History
The table below illustrates how and for how long inflation streaks when it blows through 9 percent. Notice all periods occurred during or near wars and/or significant supply shocks – WWI, Spanish Flu, WWII, OPEC I & II, COVID & Ukraine. This renders the deflationitas’ arguments that current inflation is a special case due to supply shocks almost laughable.

Comparable Months
The “in the past forty years” 9 plus percent inflation print the financial media uses to compare the June 9.1 percent print occurred in November 1981, when inflation was dropping -like a stone and financial conditions in the U.S. were very tight. A more correct comparison should be the 9 percent inflation prints of 1975 when inflation exceeded 9 percent, and financial conditions were as easy as they are today.
Similar To 1975, The Fed Is Way Behind The Curve
The following scatter diagram graphs all 55 prints of the 9 percent plus monthly year-on-year inflation against the Chicago Fed’s National Finanical Condition Index (NFCI), for the past sixty years.
The NFCI provides a comprehensive update on U.S. financial conditions in money markets, debt and equity markets, and the traditional and “shadow” banking systems.
Positive values of the NFCI are associated with tighter-than-average financial conditions, while negative values with looser-than-average financial conditions. The NFCI is a weighted average of a large number of variables, 105 financial indicators that can be found here,
Current Financial Conditions
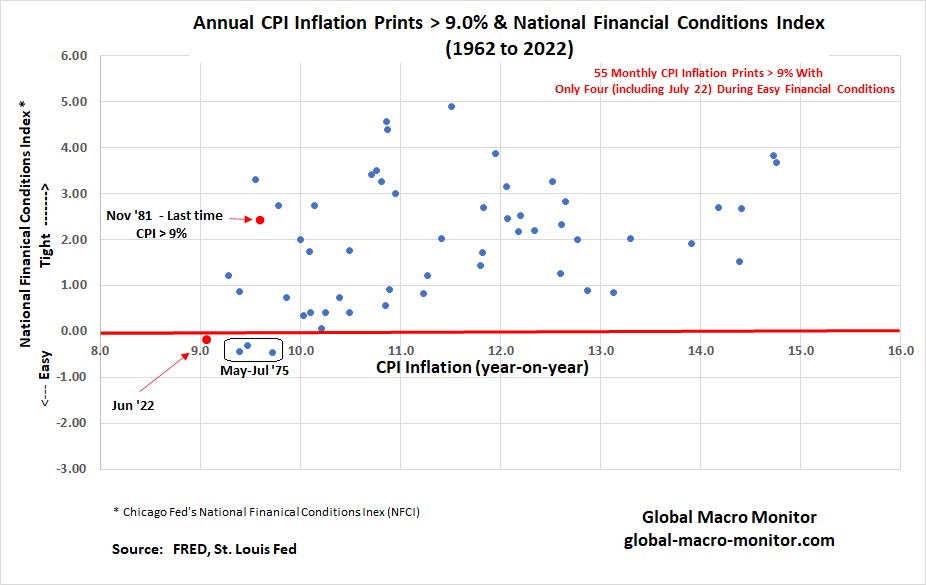
Even with the Fed’s mega rate hikes since March, financial conditions are still loose in the U.S., as reflected by the red dot in the lower left corner of the scatter diagram.
Upshot
A 9 percent monthly year-on-year inflation rate with still loose financial conditions doesn’t take a genius to project the most likely trajectory for inflation over the near term. Yes, gas prices are falling but only make up less than 4 percent of the CPI basket.
The inflation problem is now in housing, 42 percent of the basket, partly the fault of the Fed, which continued buying mortgages with a dearth of houses on the market.
We do hope this time is different.

