


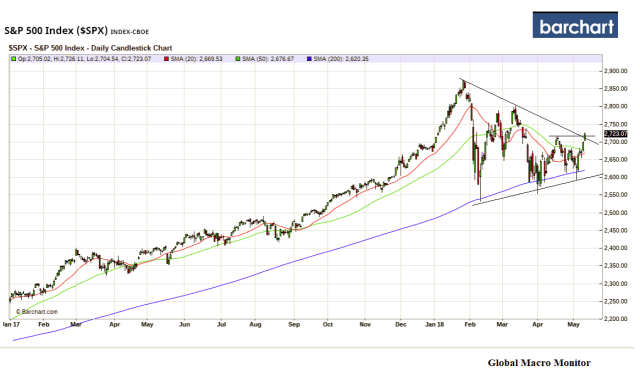
In our Monday post on Bull and Bear Traps we noted the bulls had to do three things, and we also noted the bullish pennant technical formation.
It is imperative the S&P bulls: 1) hold the 20-day moving average at 2,663.04; 2) bust and close above the 50-day at 2,679.56. The slope of the 50-day is now negative and in a downtrend, which, on its own, is bearish, and 3) take out, close , and stay above the recent high at 2,717.49
…Pennant Forming
It looks like a pennant is forming here, which is bullish if you ignore rising interest rates and oil prices, tighter money, rising inflation, and geopolitics. Macro traders cannot adhere solely to technical patterns but must consider them. Just another arrow in the global quiver. – GMM, May 7
Check, check, and semi–check. That was fast.
Trading Range
The MoMo bulls are touting the pennant breakout and the close above the recent higher low, but six green candlesticks does not make a new uptrend, in our book. We are in a trading range until the recent low breaks or the January 26th all-time high is taken out.
We still maintain stocks are in a bear market and will see much lower prices before year-end based on the macro environment. The Fed is on schedule to reduce its balance sheet by another $330 billion by year end, including a reduction of $198 billion in Treasuries and $132 billion in MBS. Moreover, more rate hikes are coming.
That’s tighter than me trying to fit into a pair of skinny jeans.
Mr. Market, with a nanosecond attention span, may not think or believe the unprecedented Fed tightening is an issue as significant as we do. Come October, however, the Fed will be in full tightening mode, reducing the balance sheet by $50 billion per month, and still in rate hike mode.
We don’t fight the market and we don’t fight the Fed. ‘Nuff said.

(TOTD = Tweet of the Day)
Risk does not like prophets. It’s not even fond of historians. You can plan for every risk except the things that are too crazy to cross your mind. —
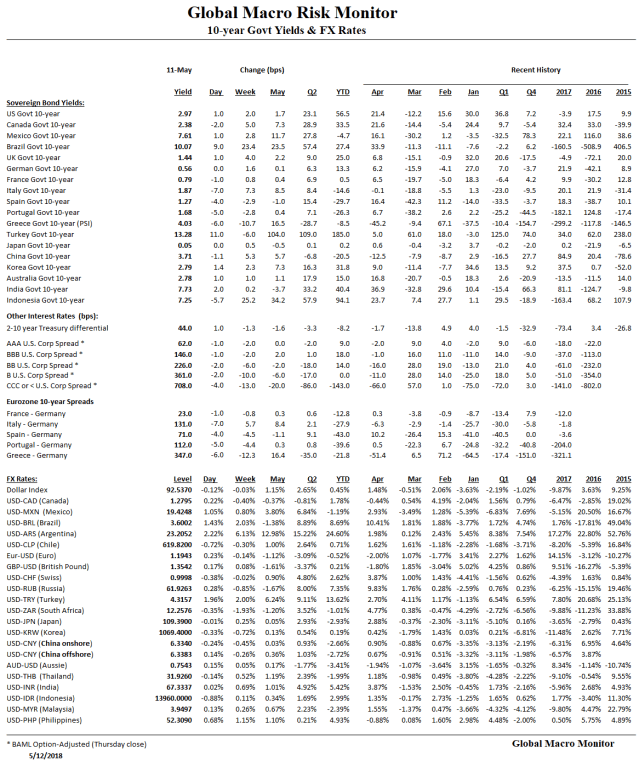
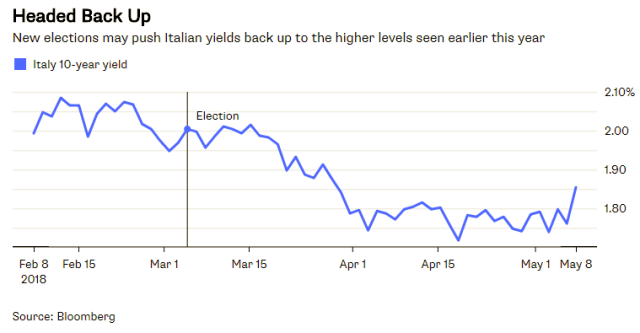
The Italian 10-year government bond is 112 bps through the U.S. 10-year note yield, and the country doesn’t have an independent central bank! Moreover, the Germans are coming to town at the ECB very soon. How is that for pricing risk?
President Sergio Mattarella has given Italy’s divided political parties 24 hours to try to reach a deal on a new government before he appoints a caretaker cabinet. – Local Italy, May 9
All of a sudden politics matters to Italian bonds. Disruption around an election process that was never smooth to begin with drove 10-year yields up 10 basis points on Tuesday to 1.85 percent, the highest level for six weeks – Bloomberg, May 8
Note, no mention of “recession”, the trigger for the cheerleaders. The bear market of 1962 and 1987 occurred with robust economic growth.
You look at every bear market and they’ve always basically occurred because of an uptick in inflation and an uptick in interest rates. – Paul Tudor Jones
It’s getting tighter out there, folks.


