Saudi Arabia’s Economic and Demographic Reckoning – Stratfor

Stratfor Middle East Analyst Emily Hawthorne looks at the factors complicating Riyadh’s latest effort at reform.
For more analysis, visit: http://www.Stratfor.com

Posted in Crude Oil, Geopolitical | Tagged , , | Leave a comment

Inflation Cometh

Our view that inflation in the U.S. is going to be the biggest market risk of 2017 is starting to take shape.   Take a look at rents in the second chart below.

European political risks?   Nah.

The March 15 elections in the Netherlands will probably result in Geert Wilders’ PVV far right party almost tripling his seats in the lower house from 12 to maybe 35,  but far from a 75 seat majority and it will be hard for him to find coalition partners to form a government.

France?  Betting markets have Fillon at 51 cents and LePenn at 34 cents.   These guys have been wrong before, but, think about it, Fillon will take most votes to the left of LePenn.  He is pretty conservative himself.  A Fillon victory will spark a massive equity rally in Europe, in our opinion.

The German elections in September?  Life is good in Germany, doubt they make big changes to their government.

China?   Wild card. Opaque and hard to figure out.  The financial sector is unlike other western economies.  How does it fund itself?   Interbank lines, deposits,  borrowing from the PBOC?   All of the above?  At the end of the day,  China is still a command economy.  But, we are working hard on trying to get our hands around the Middle Kingdon.  We do expect increased political tensions between China and the U.S. that could rattle markets.

So, as the U.S. closes its borders, implements border taxes,  and restricts trade, inflation can only go north.  Not priced.  Stay tuned.

cpi2_jan23cpi1_jan23

Posted in Uncategorized | Tagged | Leave a comment

America-first and the dollar-yen trade – FT

The FT’s Leo Lewis looks at how uncertainty over US President Donald Trump’s America First policy affects the dollar-yen currency trade.

► Subscribe to FT.com here: http://on.ft.com/2eZZoLI

Posted in Japan, Policy, Politics, Uncategorized | Tagged , , , | Leave a comment

The Transition Trade

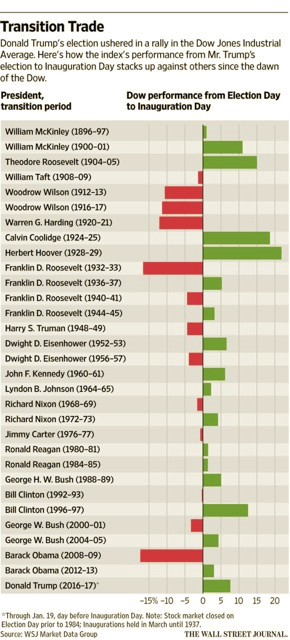
Nice chart (hat tip King David over at thinkinthemoring.com) from Wall Street Journal on the return of the Dow Jones after election day to the inauguration of presidents all the way back to McKinley when the Dow index was created.

Note Herbert Hoover leads the pack.  Like we have said the return on the Dow during the transition is meaningless in terms of predicting future performance.   Hoover had the momentum of the 1920’s and the 262 percent return of Calvin Coolidge’s bull market behind him at the start of his administration.

The Dow continued to rise 19.44 percent from Hoover’s inauguration on March 4, 1929 to September 3, 1929, where it peaked at 381.17.   The Dow then fell 31.62 percent by October 28, 1929, the day before the Black Tuesday crash, when it fell 11.7 percent in one day.  Interestingly, the markets usually give a sign they are not healthy before a big puke happens.

In spite of the Dow’s good performance during the Hoover transition and first 100 days,  the Dow’s total return during Herbert’s Hoover’s reign was the worst of all presidents, down over 80 percent.   Conversely, the Dow’s performance during  FDR and President Obama’s transition were among the worst as the economy at the time were in throes of the two worst crises the nation has faced.   Yet, FDR and Obama’s bull markets ranked among the best of all presidents.

The Dow did not recover the September 3, 1929 high until November 23, 1954.   And, no, folks,  that is not a typo.   It took more than 24 years to recover the 1929 high.

transition-trade_jan23


Posted in Equities, Politics | Tagged , , , , , | Leave a comment

Reagan-Trump S&P500 Analog

We continue to track the meaningless (in terms of projecting trajectory)  Reagan-Trump S&P500 analog.  At their respective inaugurations, the Trump S&P is outperforming Reagan by 4.4 percent.  Note, Trump was inaugurated 51 trading days after the election whereas Reagan’s inauguration took place 53 trading days after the election.  In terms of the exact days after the election, 51 days,  Trump outperforms Reagan by 2 percent.

Our sense the markets will be spooked by Saturday’s global protests and may perceive that Trump has been weakened politically.  Thus, we expect a sell off next week.

But what do we know?   Absolutely nuttin’.

reagan-v-trump_analog

Posted in Equities, Uncategorized | Tagged | Leave a comment

French Oat-German Bund 10-year Spread

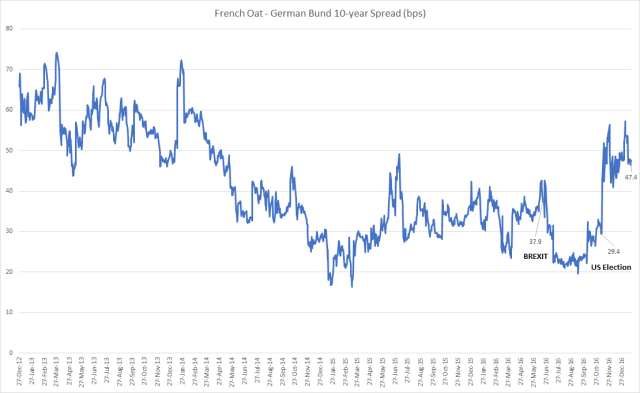
Stabilizing at around 50 bps.

predictit_france

oat_bund_spread_jan14

Posted in France, German Bund, Germany, Politics, Uncategorized | Tagged , , | Leave a comment

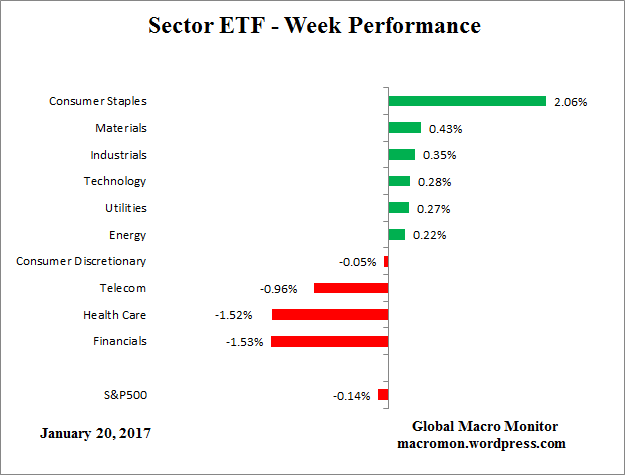
US Sector ETF Performance – Jan 13

etf_dayetf_monthetf_month

Posted in Daily Risk Monitor, Sector ETF Peformance, Uncategorized | Tagged , | Leave a comment

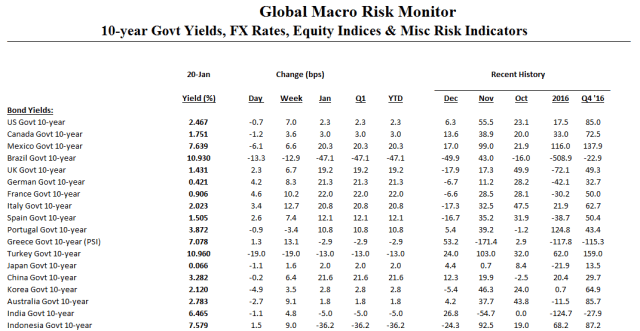
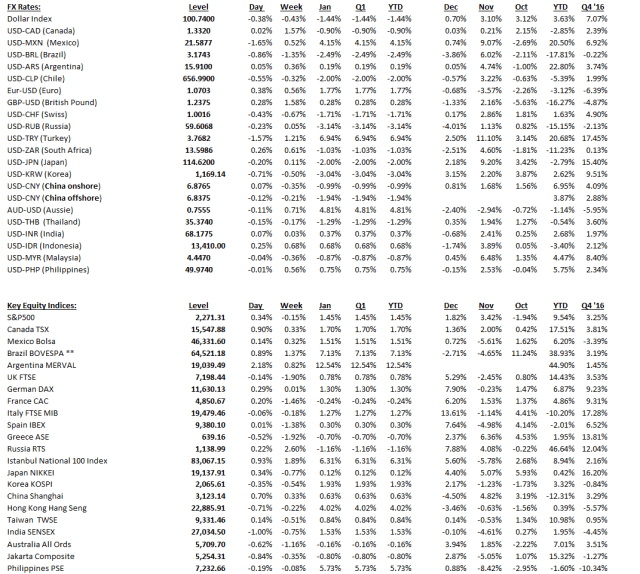
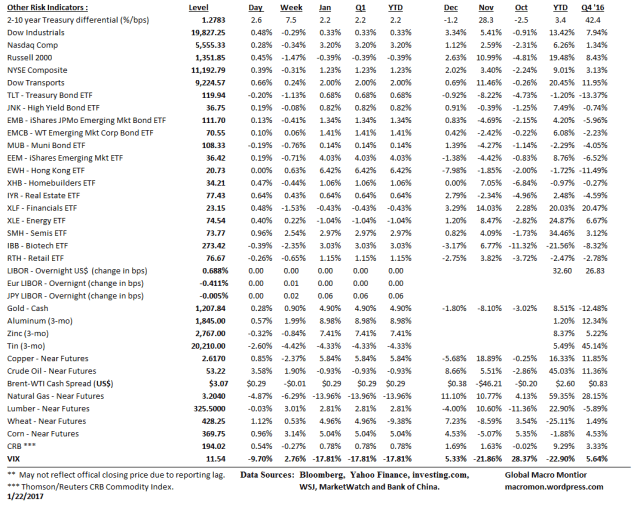
Global Risk Monitor – January 20

Click on table to enlarge and for better resolution

riskmon_1riskmon_2riskmon_3

Posted in Daily Risk Monitor, Uncategorized | Tagged , , , , , | Leave a comment

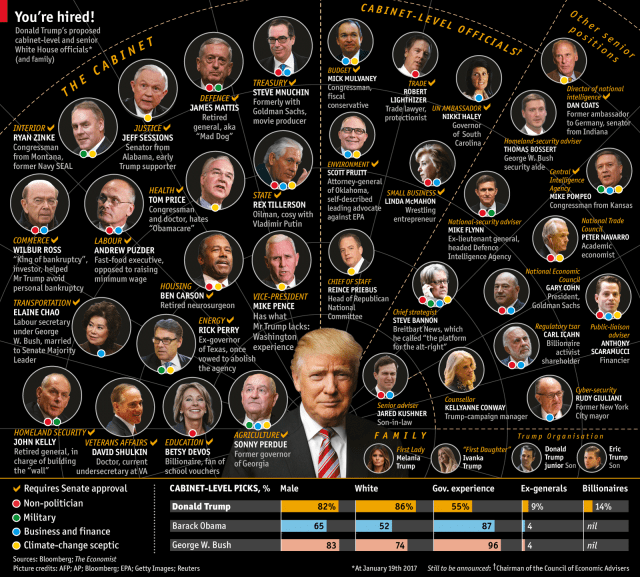
You’re Hired!

trump-cabinet

S0urce:  Economist


Posted in Politics, Uncategorized | Tagged , | 1 Comment

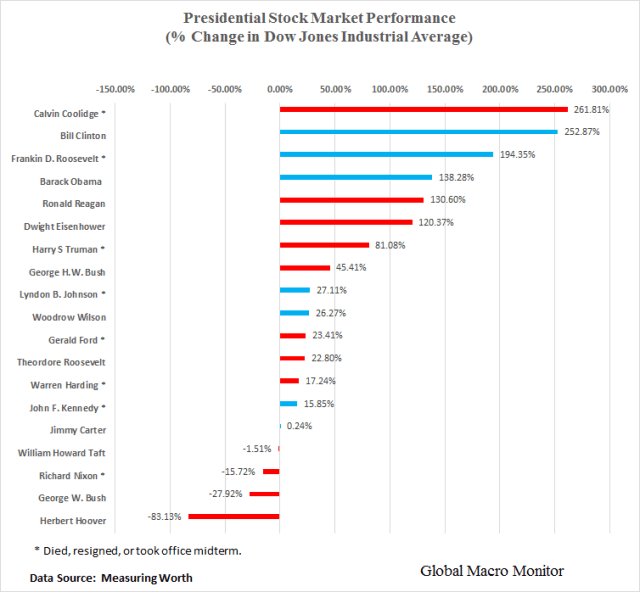
Obama’s Bull Market

president-dow_table_jan20president-dow_chart_jan20

Posted in Equities | Tagged , , , | Leave a comment