
Click on table to enlarge and for better resolution


 (click here if table is not observable)
Click on table to enlarge and for better resolution
(click here if table is not observable)
The Russell 2000, which was selling off while the S&P500 was making new highs, is behaving better and worth watching here as it has turned up before the other indices (see chart). Whether this is just short covering or a market turn is anyone’s guess.
The Russell is a favorite hedge and short vehicle for many of the big players. The index is down almost 3 percent on the year and 6.77 percent from its July 1st high. It sits just below the 61.8 percent Fibo retracement of the May 15 – July 1 move and November 2012 trendline. Stay tuned.


 (click here if charts are not available)
Barron’s is reporting the seven year bear market in China is over as stocks have rallied 20 percent off their March lows.
Francis Cheung, China strategist for CLSA in Hong Kong, notes that other factors are channeling money toward China. Some investors have redirected funds to China from sanction-ridden Russia. But more important is this fall’s loosening of restrictions on both foreign and local investments. As of Oct. 13, overseas buyers will be able to own China’s listed A shares, available in Shanghai, previously the exclusive domain of Chinese investors, and local buyers will for the first time be able to invest in H shares, now available in Hong Kong. In essence, the stocks will trade as if they were dual-listed. It has been dubbed the “through train” in China because the shares will travel freely between the two markets. At the outset, Hong Kong investors will be able to invest in 568 of the most liquid A-share stocks and Chinese buyers will be able to trade 266 Hong Kong H shares.
How long will the rally last?
How long will the rally last? Even after their recent gains, China’s stocks are still the cheapest in Asia, selling at book value with 8% earnings growth forecast for this year and 10% for next year. Mansfield Mok, a portfolio manager with EFG Asset Management in Hong Kong, claims that “China is now poised for a longer-term rerating because we will see an acceleration of the reform process” as Beijing tries to improve the quality and competitiveness of its businesses.
Great article and graphic in Monday’s Investor’s Business Daily about the country’s shale plays and how Texas is becoming a top oil producing region.
Oil coaxed from the rapidly developing Eagle Ford and Permian Basin production areas recently lifted the state’s output back above 3 million barrels per day (bpd) for the first time in more than three decades. That put the Lone Star state at more than a third of total U.S. oil production, vs. about 12% for No. 2 North Dakota. Texas is on track to outpace Iraq, which, at 3.2 million bpd in April, is the Organization of the Petroleum Exporting Countries’ second-largest producer, behind Saudi Arabia.
 (click here if chart is not observable)

 (click here if charts are not observable)
Click on table to enlarge and for better resolution


 (click here if table is not observable)
A friend sent over the following article from EnerCom Consulting quoting Reuters that Exxon and Chevron evacuated their staffs from Iraqi Kurdistan this morning. They also reported,
ABC News reports that analysts estimate ISIS currently makes $1 million a day selling the oil they have captured, and the number could get as high as $3 million a day if they seize the Shaar gas field. They have been selling the oil for $30 a barrel on the black market. The international price standards for oil is over $100 a barrel.
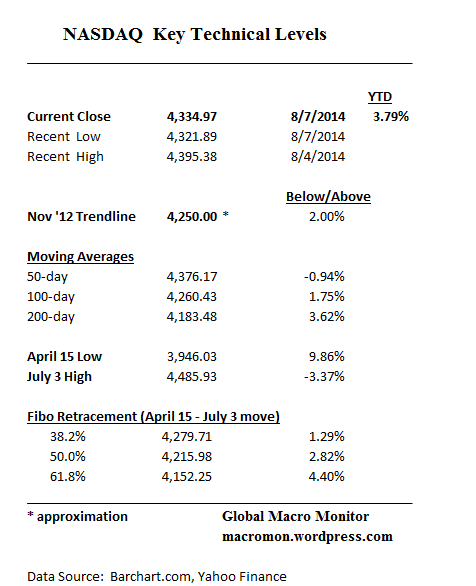
The Nasdaq is holding up better than the S&P500 and Dow, off only 3.37 percent from its recent high, and yet to test its 100-day. The index has even yet to break its 38.2 Fib retracement of the April 15 to July 3 move. Nevertheless, the Nasdaq has pierced some minor support at 4,350 (see chart). Tough call as to whether it swan dives to catch up with other indices on the downside or holds in and leads the market out of its current funk. We choose risk aversion. Stay tuned.

 (click here if charts are not observable)
 (click here if charts are not observable)
Click on table to enlarge and for better resolution


 (click here if table is not observable)

 (l
(l
