
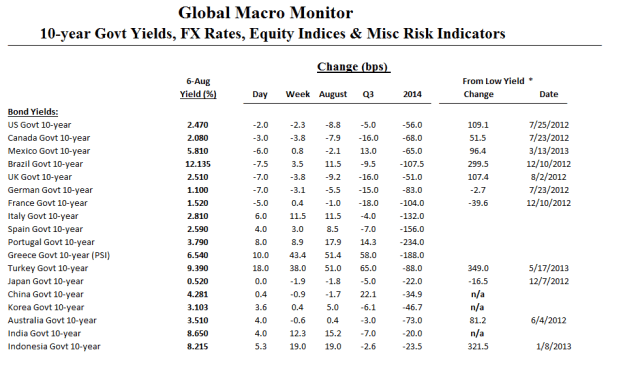
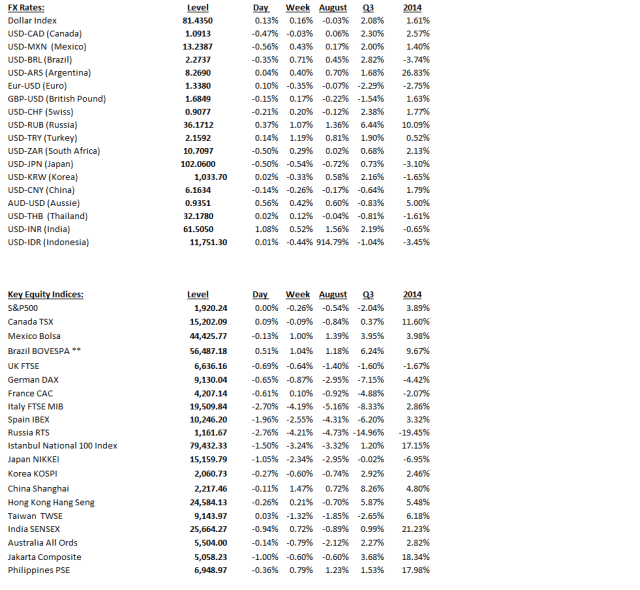
Click on table to enlarge and for better resolution


 (click here if table is not observable)
Click on table to enlarge and for better resolution
(click here if table is not observable)
A friend sent over the following article from EnerCom Consulting quoting Reuters that Exxon and Chevron evacuated their staffs from Iraqi Kurdistan this morning. They also reported,
ABC News reports that analysts estimate ISIS currently makes $1 million a day selling the oil they have captured, and the number could get as high as $3 million a day if they seize the Shaar gas field. They have been selling the oil for $30 a barrel on the black market. The international price standards for oil is over $100 a barrel.
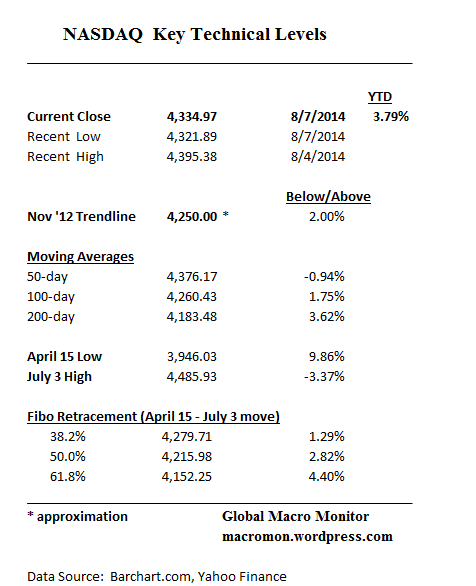
The Nasdaq is holding up better than the S&P500 and Dow, off only 3.37 percent from its recent high, and yet to test its 100-day. The index has even yet to break its 38.2 Fib retracement of the April 15 to July 3 move. Nevertheless, the Nasdaq has pierced some minor support at 4,350 (see chart). Tough call as to whether it swan dives to catch up with other indices on the downside or holds in and leads the market out of its current funk. We choose risk aversion. Stay tuned.

 (click here if charts are not observable)
 (click here if charts are not observable)
Click on table to enlarge and for better resolution


 (click here if table is not observable)
The Dow Jones Industrials briefly traded below its 200-day and managed to bounce into the close. The index is in trouble as it has penetrated the 61.8 retracement level of the April 11 – July 17 move. The last line of support before a likely full blown correction is the 200-day, 25 Dow points below today’s close. Note also, the S&P500 closed below its 100-day moving average for the first since April. Stay tuned.


 (click here if charts are not observable)
The soaring cost of London living is pushing the finances of young people to the brink. Katie Morley reports on how a number are now starting to question how much longer they will be able to call the UK capital their home.
For more video content from the Financial Times, visit http://www.FT.com/video
(click here if video is not observable)
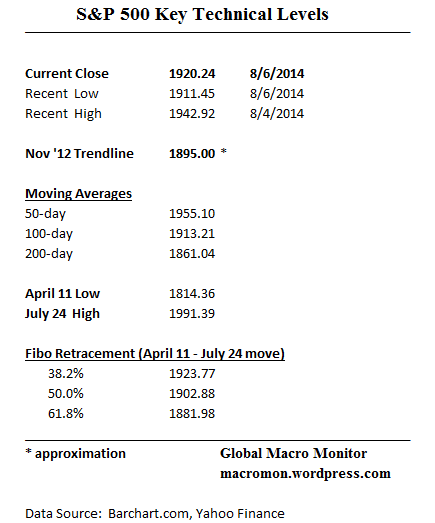
It’s showtime for the S&P500, which managed to hold and bounce from its 100-day moving average today. The bulls must continue their defense of the November 2012 trendline and the 50% retracement at the 1895-1900-ish level. Would love to see a move down t0 and hold the 200-day at 1860 to flush the excesses, restart the charts and base counts, and provide a new entry for a fresh bull move into year-end. Unfortunately, the market is not Santa Claus and rarely grants what you wish for. Stay tuned.

 (click here if charts are not observable)
 (click here if charts are not observable)
Click on table to enlarge and for better resolution
 (click here if table is not observable)

