Mo’ Stim’ Can’t Save Apple

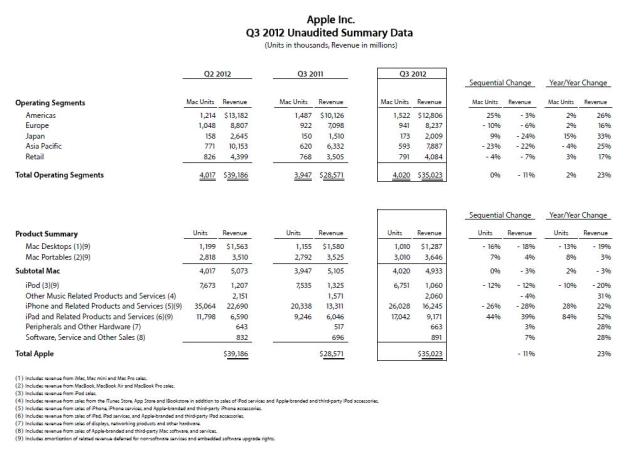
Jon Hilsenrath’s the Fed’s coming with more (mo) stimulus (stim)  WSJ story in the last 1o minutes of trading couldn’t save Apple from the wrath of Mr. Market in after hours trading.  The stock is getting spanked, down $33 plus after missing top and bottom line estimates.   Can’t see a catalyst x/ a trading bounce to take it higher in the near term.

The bears will argue the company is finally bumping up against the upper bound of the law of large numbers and its growth days are over.   Clearly past growth rates are not sustainable, but take a look at the annual growth of iPad revenues at 52 percent.

We don’t believe the era of innovation is over at Apple.  Still like it long-term though could see further downside as the crowd thins out thinking the party is over.

Click on table to enlarge and for better resolution.
(click here if table is not observable)
Posted in Apple | Tagged , | Leave a comment

Spain bailout pressure mounts

(click here if video is not observable)

Posted in Black Swan Watch, PIIGS, Sovereign Debt, Sovereign Risk, Spain | Tagged , , | Leave a comment

Quote of the Day: Rotten to the Core?

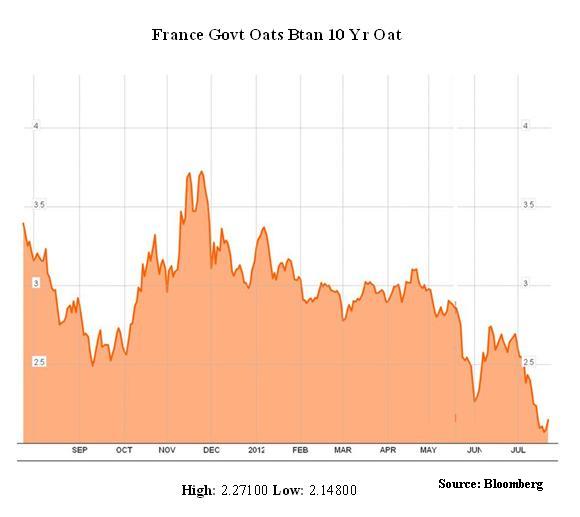
May brought the end of the “Merkozy” approach to the Euro crisis as the French voted out the austerity-loving Conservative and voted in Socialist President François Hollande. Under the new regime, France is now cozying up to its new anti-austerity, pro-money-printing allies,Italy and Spain. This makes sense when one considers that France’s economy is more akin to that of its southern neighbors than it is to the German economy. Strangely, the French bond market hasn’t figured this out just yet.

– David Einhorn, Greenlight Capital

Gulp!

(click here if chart is not observable)

Posted in Quote of the Day | Tagged , , | 3 Comments

Eurozone Flash PMI At 46.5, Contracts 10 of Last 11 Months

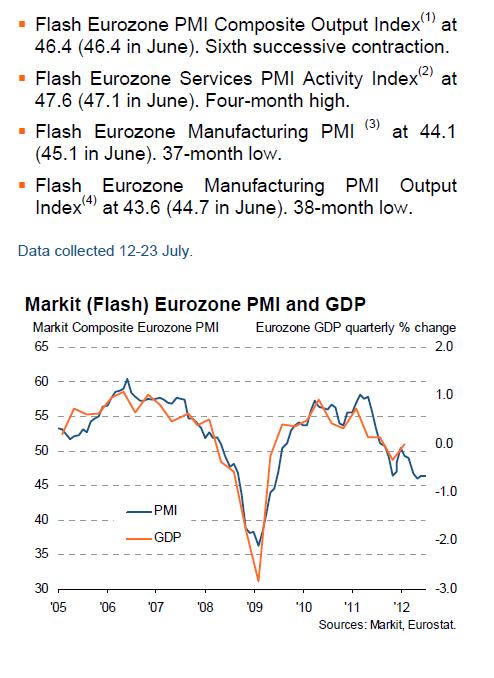
Markit reported this morning the Eurozone PMI Composite Output Index was unchanged at 46.4 in July as the private sector contracted for the tenth time in the past 11 months.    Chris Williamson, Chief Economist at Markit, commented,

The flash PMI for July suggests the euro area downturn showed no signs of letting up at the start of the third quarter and is consistent with GDP falling at a quarterly rate of around 0.6%, which is similar to the rate of decline we expect to see for the second quarter.

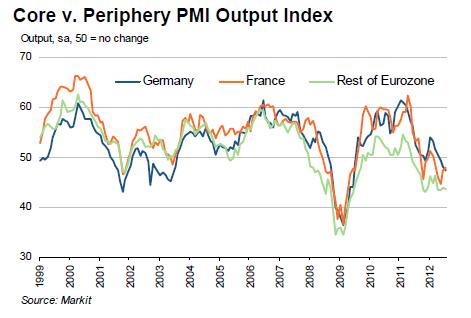
“The downturn is being led by an increasingly severe slump in manufacturing, where output is falling at a quarterly rate of around 1%.  “Germany is now contracting at the steepest rate for three years, while the rate of decline in the periphery is also among the highest seen since mid-2009. The only sign of improvement was limited to the French services sector, which is likely to be due to domestic business settling down again after the general elections and could therefore prove temporary.

“Companies across the region are cutting staff numbers at the fastest rate for two-and-a-half years as the outlook darkens. Service providers are now the gloomiest since March 2009, while manufacturers are slashing their inventories of raw materials in the expectation of ongoing weak sales in coming months.

“Companies also cut prices to the greatest extent since early-2010 to help boost ailing sales, which should help alleviate inflationary pressures but may hit profits. Falling input costs should help protect profit margins in manufacturing, but costs continue to rise in services.

(click here if chart is not observable)

Posted in PMIs | Tagged , , | Leave a comment

HSBC China Flash PMI At 49.5, 5-month High

Markit reported the HSBC China Flash PMI increased to a 5-month from 48.2 in June to 49.5 in July.  Manufacturing is still contracting but the reading shows the Chinese economy may be bottoming.   Here’s  Hongbin Qu, Chief Economist, China & Co-Head of Asian Economic Research at HSBC,

“July’s headline PMI picked up modestly to a five-month high of 49.5, suggesting that the earlier easing measures are starting to work. That said, the below-50 July reading implied demand still remaining weak and employment under increasing pressure. This calls for more easing efforts to support growth and jobs. We believe the fast falling inflation allows Beijing to do so and a more meaningful improvement of growth is expected in the coming months when these measures fully filter through.”

(click here if chart is not observable)

Posted in China, PMIs, Uncategorized | Tagged , , | 2 Comments

World’s Ugliest Chart Contest

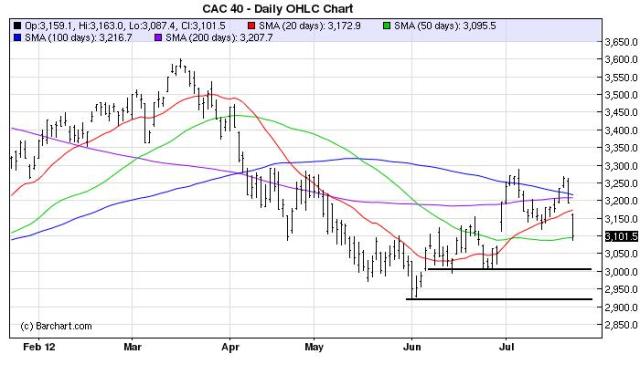
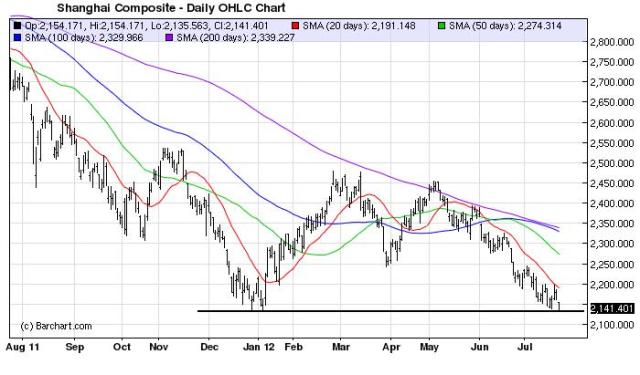
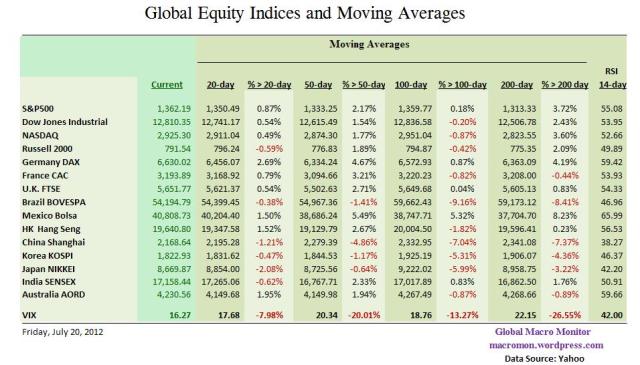
Here’s a couple fugly charts from the major equity indices that we track.    The ugliest are China related such as its de facto suppliers — Japan, Korea, and Brazil.

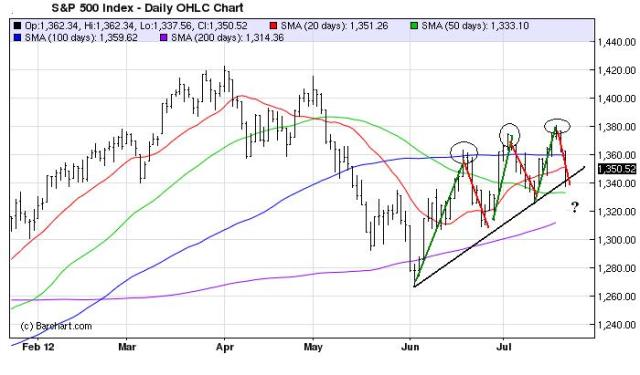
Let’s start with S&P500 —  a relatively good looking chart —  for a comparison.  The index has been zigzagging off its short-term uptrend line making higher highs and higher lows since bottoming in June.   It feels the world wants large cap U.S. stocks and this is where the global allocation is taking place.    Currently at uptrend support the S&P needs to hold the 50-day at 1333, which it did today bouncing off 1337.   A close below 1325 “breaks the mirror.”

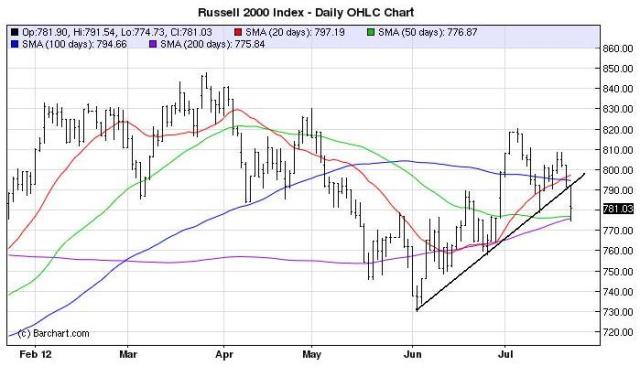
The Russell 2000 broke its uptrend and made a lower low today.   Though it closed above the 50-day, we now view this chart as damaged goods.  Note the Russell is a fave hedging vehicle of the fast money crowd betting on an economic slowdown.

The CAC 40 looks like a classic double top.  ‘Nuff said.

The Nikkei broke the neckline of its head and shoulders formation and a test of the June 4th 8230 low looks to be in the works.

The Kospi needs to hold support at 1774 or a test of last September’s low of 1644 is likely.

The Brazilian BOVESPA is the worst YTD performer on our watch list.  The index made a new 2012 low today.  Let’s see if the BOVESPA can bounce on the stronger than expected PMI data from China.

The Shanghai Composite wins the ugly chart contest.  The index is down almost 40 percent from its August 2009 post-crash peak and remains in an ugly downtrend.  A break of the January 2012 low of 2132 could get ugly.

(click here if charts are not observable)

Posted in Ugly Chart Contest | Tagged , , , , , | 2 Comments

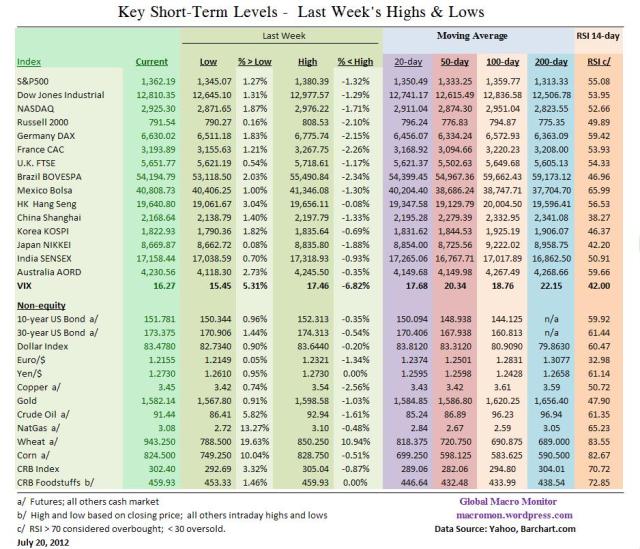
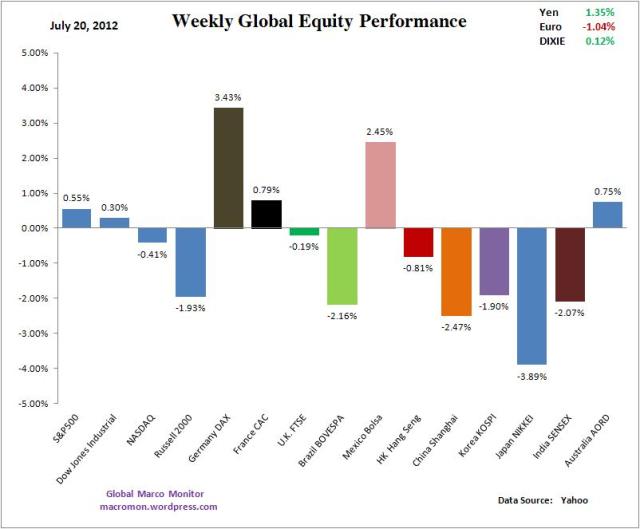
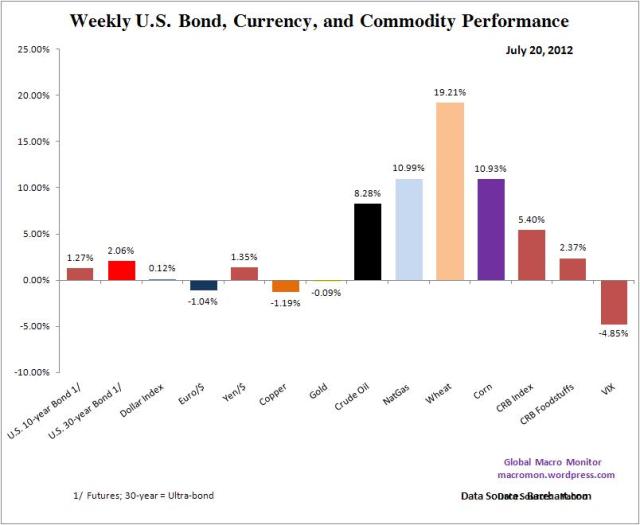
Week in Review

(click here if charts are not observable)

Posted in Week in Review | Tagged , , , , , , , | 1 Comment

Parabolic Moves and Gold

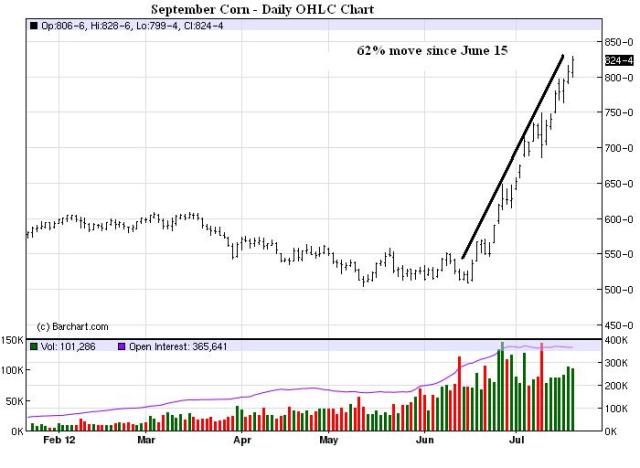
The Fed finds itself extremely unlucky once again as it talks up quantitative easing while food prices, mainly wheat and corn,  are making a parabolic and historic move as crops suffer from extreme drought.   You can’t prove causation with correlation (or a counterfactual) so is there any doubt the hard money crowd — which, we, by the way, have a favorable bias — will try and make a connection?   Note the CRB made its low in June.

The gold chart merits attention as a big break out of the symmetrical triangle seems likely.   The direction?   We suspect higher with further QE but it has yet to catch the printing press fever and enthusiasm that has infected equities.   If gold can’t move up on another round of Fed balance sheet expansion, the yellow metal could be headed for big trouble,  in our opinion.

Stay flexible and stay tuned!

(click here if charts are not observable)

Posted in Black Swan Watch, Commodities, Gold, Inflation/Deflation | Tagged , , , , , | 1 Comment

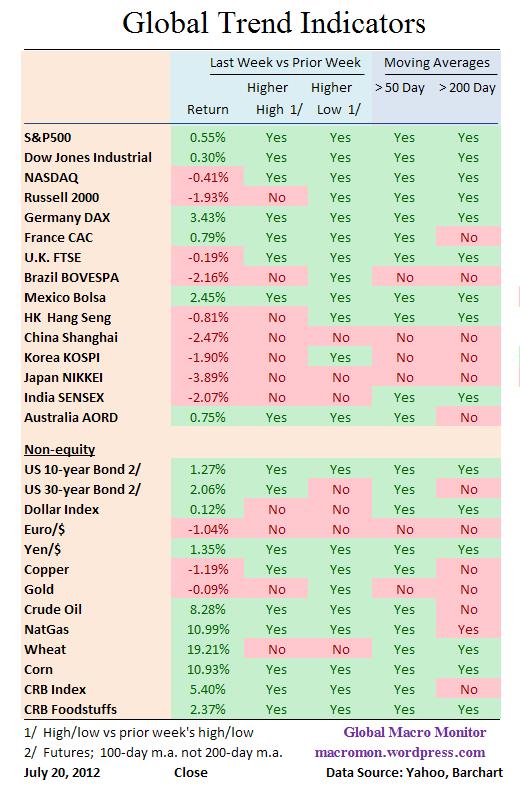
Global Trend Indicators

(click here if tables are not observable)

Posted in Global Trend Indicators | Tagged , , , , , , , | 2 Comments

Revolutionary Cycles and the History of Financial Bubbles

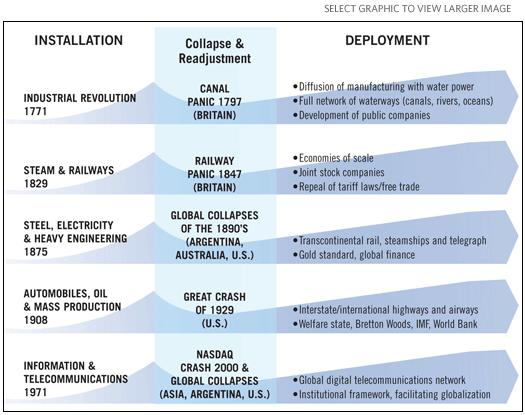
Are we on the verge of a “Golden Age of Global Sustainability”?   Interesting thesis ala Kondratieff waves by the neo-Schumpeterian,  Carlota Perez-Perez.   Have a Listen.

(click here if video is not observable)

Posted in Black Swan Watch, Economics, General Interest | Tagged , , | 1 Comment