Yen Continues to Swan Dive…

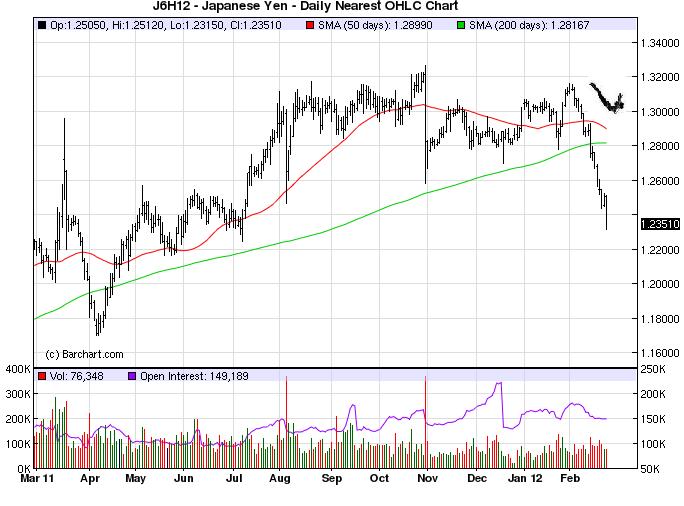
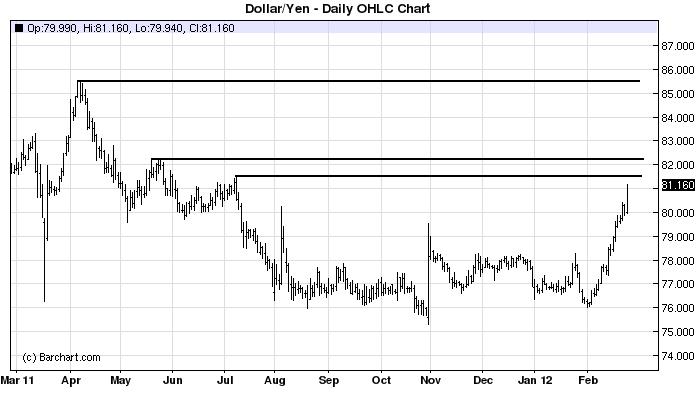
The Yen got hammered again this week breaking through almost all technical support and looks to at least test last year’s lows, equivalent to an 85 dollar/yen.  It must first clear a key zone of resistance  at 81.50-82.25.

Lots of factors lining up against the Japanese currency, including the BoJ’s recent announcement it would fire up the printing press in the global “race to debase.”

Bloomberg BusinessWeek writes,

Japan’s status as an export superpower has taken a pummeling lately. First came news last month that the country had posted a $32 billion trade deficit for all of 2011, the first time that’s happened since 1980. Then, on Feb. 20, Tokyo announced a record shortfall for January of $18.5 billion, citing a strong yen that’s depressing exports and rising prices for energy imports. Japan may well record another yearly trade deficit in 2012. Now economists are worried that the nation’s current account could turn negative, raising questions about Japan’s ability to handle its $10 trillion-plus government debt load. That burden is equivalent to about 220 percent of Japan’s total annual economic output, the highest debt-to-gross domestic product ratio in the world. (That’s right: Greece’s debt level is a more manageable 164 percent of GDP.)

The government does want to see a weaker currency  so no reason to panic until we see simultaneous moves of a falling currency, rising bond yields, and falling stocks.  Just make sure you panic before everyone else does!

Keep this one on your radar, folks.
St(click here if charts are not observable)
Posted in Japan | Tagged , | 2 Comments

Weekly Eurozone Watch

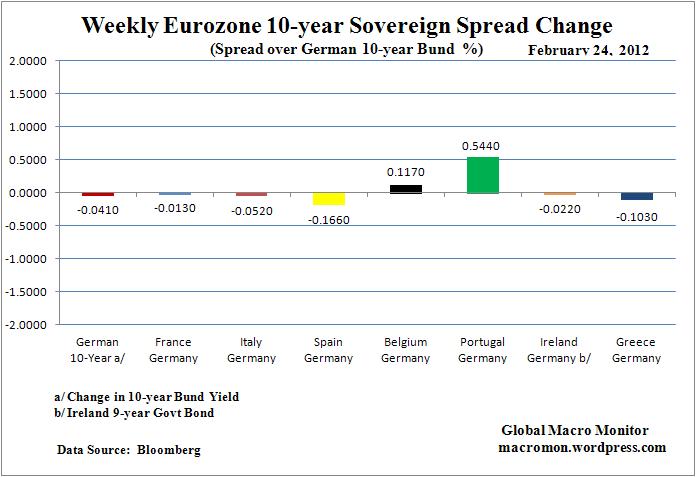
Q:  How does the market respond to all the doubts and scepticism about the second Greece bailout?   A:  They tighten Italian and Spanish spreads and take the Euro higher, although Portugal did widen on the week.

We’ve learned a very important and costly lesson not to get too emotionally invested in a position or market view.   Those, such as economists and strategists,  have very little skin in the game and can afford to stick with their views as markets move against them.   Traders and investors cannot.

LTRO2 on deck next week.  Going to be interesting week in EuroLand.

(click here charts are not observable)

Posted in Weekly Eurozone Watch | Tagged , , , , , | Leave a comment

Nonlinear Thinking: Test Tube Big Macs

Stunning!  We are truly on the elbow of an exponential curve of technological innovation.   Think of what this does to agriculture and society if it is scalable.

(click here if video is not observable)

Posted in Nonlinear Thinking | Tagged , | 1 Comment

The Great Repression: Freedom of Speech in the Bond Market

We’re baffled anybody still looks to the U.S. bond market for signals of future economic activity, inflation, or even risk aversion.  Case in point is today’s 7-year bond auction, which CNBC’s Rick Santelli rated an eleven on a scale of ten, i.e., a slam dunk!

Go no further, however, than the chart below to see which maturities on the yield curve are the most repressed.  Prior to today’s auction, for example, the Fed owned 43 percent of all Treasury coupon securities maturing in 2019 and more than 50 percent in three of the seven issues maturing in that year.

Yesterday we caught PIMCO’s very bright and articulate Mohammad El –Erian promoting the “seven-year bucket” in an interview with CNBC,

…make sure you have some gold, some oil, and concentrate your bond exposure in the five to seven-year bucket.

Known for “Fed Surfing” or getting in front of, or riding along with, the U.S. central bank’s market interventions, don’t you think PIMCO likes the seven-year, in part,  because that is where Mr. Bernanke is camped out?   Front running the Fed has paid handsomely for many and we doubt it is fully dominated by macro views of inflation, economic growth,  Chinese hard landings, or risk aversion.

The information we divined from today’s successful bond auction?   Especially, in a maturity that has been gagged and bound by Fed intervention?   Absolutely nuttin’!

Finally, we view long-term Treasury interest rates as one of, if not, the most important price in the world.  Because of direct financial repression the information it now provides and the signal it sends, which is so important to capital allocation decisions,  has, at best, been severely distorted.  No wonder corporations are hoarding cash and reluctant to invest.

Click chart to enlarge and for better resolution.

(click here if charts are not observable)

Posted in Black Swan Watch, Bonds, Budget Deficit, Economics | Tagged , , | 1 Comment

IMF Still Sees Risk in Greece

(click here if video is not observable)

Posted in Black Swan Watch, Euro, PIIGS, Sovereign Debt, Sovereign Risk | Tagged , , | Leave a comment

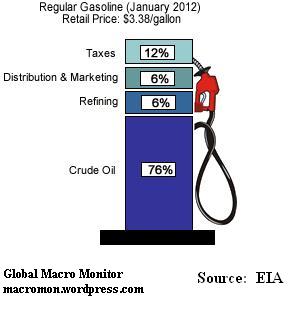
Don’t Blame the Gas Station for Price Spike

Here’ a cool graphic from the EIA on what drives the price of a gallon of gasoline in January 2012.  We paid $4.20 last night in California!

Note 76 percent of the price for a gallon of gas is driven by crude oil.   Only 6 percent by refining and 6% distribution and marketing.  Though these components do vary over time, but not by much.

So when you start to crack at paying $100 to fill your tank,  remember it’s really not the crack spread.  Blame the crude or Brent!

(click here if graphic is not observable)

Posted in Crude Oil, Energy | Tagged , , | 2 Comments

Greek bond swap brings new downgrades

(click here if video is not observable)

Posted in Black Swan Watch, Bonds, Euro, PIIGS, Sovereign Debt, Sovereign Risk | Tagged , , , , | Leave a comment

Eurozone PMI contracts in February

From Markit’s release earlier today,

The Markit Eurozone PMI® Composite Output Index fell from 50.4 in January to 49.7 in February, according to the preliminary ‘flash’ reading based on around 85% of usual monthly replies. The latest figure signalled a slight contraction in business activity following the marginal expansion seen in January, which had been the first month in which the Index had risen above the 50.0 no-change level since last August.

The latest reading was nevertheless the second-highest of the past six months, and suggests that the Eurozone economy has stabilised over the first two months of the year having contracted in the final quarter of 2011.

Click chart to enlarge and for better resolution.

(click here if charts are not observable)

Posted in Economics, Euro | Tagged , , | Leave a comment

Current Housing Bust Much Worse Than Great Depression

Great chart from the recently released Economic Report of the President.  We suspect the Great Depression housing bust didn’t have the government props to soften the blow as we do today,  which,  therefore, on a relative basis,  makes the current bust much worse.   The prior conditions to the current bust must have been much worse than those before the Great Depression.

The Council of Economic Advisers (CEA) do note,

…during the Great Depression, the only other instance of nationwide price declines since WWI, much of the comparably-sized decline in nominal home prices was offset by a concurrent drop in general price levels, so the decline in real housing values was only about one-quarter as large as the one we recently experienced.

Thus the current collapse in housing prices is a relative price shift whereas the housing bust of the Great Depression was more a symptom of general price deflation in the economy.

If not for the decisive action of Paulson, Bernanke, Geithner and Co.  we all may have become farmers living under the freeway.    Can’t prove counterfactuals,  but that is what we  believe.   So we give them an A+ for stabilization.   Structural adjustment and long-term reform is an entirely different story, however.

We heard Meredith Whitney say this morning that 95 percent of current mortgages are backed, effectively, by the taxpayer,

…95-plus percent of mortgages today are being backed by Fannie and Freddie.  Fannie and Freddie are effectively subsidizing unprofitable mortgages that the banks wouldn’t put on their balance sheet. That’s not sustainable and ultimately the taxpayer is paying the bill for it.  The banks used to price profitable loans and you know, they’re a myriad of loan products that they’re still not pricing for profits.

Basic microeconomics tells us that government repression of prices creates supply shortages.   Think back to the rent control supply and demand graphs in Econ 101, which we have modified in the chart below.

This is one of the reason why we believe housing is so slow to recover.  Who in their right mind x/ the Govie would lend long-term money at a rate lower or close to the current inflation rate?   Rational lenders also take into account the massive monetization that is currently taking place globally and its impact on future inflation in calculating their expected real returns.

(click here if chart is not observable)

Posted in Black Swan Watch, Bonds, Housing | Tagged , , , | 5 Comments

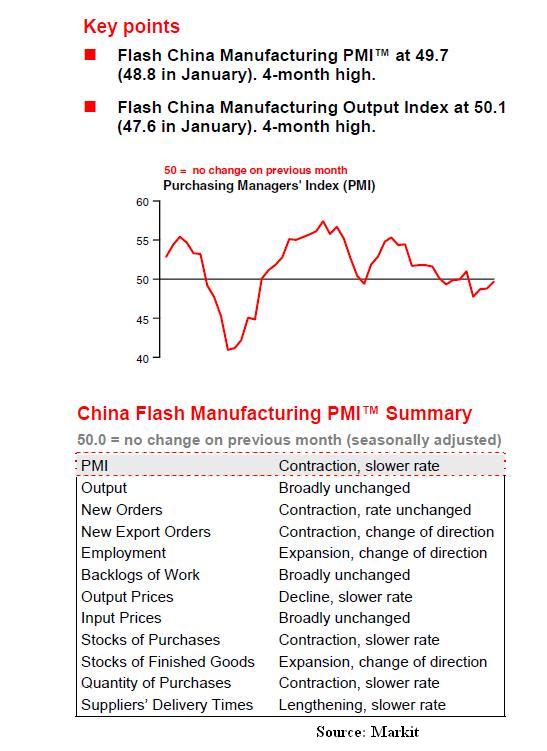
China Flash PMI At 4-month High

From today’s Markit release,

Commenting on the Flash China Manufacturing PMI survey, Hongbin Qu, Chief Economist, China & Co-Head of Asian Economic Research at HSBC said:
“Growth remains on track of slowdown, despite the marginal improvement in the headline flash PMI led by quickened production after the Chinese New Year. With a meaningful rebound of domestic demand not in sight, external weakness is starting to bite, adding more downside risks to growth. The PBoC, after delivering this year’s first RRR cut, should step up

(click here if chart is not observable)

Posted in China, Economics | Tagged , , | 1 Comment