“The Reign Of The Middle-Aged White Men Is Over”

Yikes!  Sounds like a House Of Cards,  Claire…   Just, maybe, it is.

It’s dark but so is the real thing currently.   House of Cards is one reason why  NFLX is up in a down tape today — superb original content.  However,  Netflix’s library of old movies suck, in our opinion.

The question is will Reed redeem the Underwood Washington in the final season?


House_of_Cards.png


Posted in Politics, Uncategorized | Tagged , | Leave a comment

China and Japan Continue To Reduce Treasury Holdings

The U.S. Treasury just released the August TIC (Treasury International Capital) data at the market close.

The key takeaways:

  • China and Japan, the U.S. government’s two largest foreign creditors, continue to reduce their Treasury holdings, both down $6 billion in August
  • Chinese and Japanese flows into Treasury securities have reversed over $200 billion from the same period in 2017
  • Foreign central banks, who hold almost 33 percent of marketable notes & bonds, holdings are down $4 billion from Jan-Aug ’18 versus a positive $238 billion in same period last year
  • Foreign central banks did increase their holdings of Treasuries by $24 billion in August, however
  • Brazil led net increases with an $18 billion increase in Treasury holdings in August
  • Ireland was second, with $16 billion, which leads us to believe that U.S. corps continue to stash capital offshore
  • More than 50 percent of the stock of U.S. Treasury notes and bonds are still held by price-insensitive central banks, though that profile is changing
  • Central banks and foreigners own almost 75 percent of marketable Treasury notes and bonds

Upshot

Markets are way too complacent, and the Trump administration is too cavalier about the economy’s increasing vulnerability caused by its dependence on foreign financing of the government’s exploding budget deficits.

Check out the trends in the data and then do the math.

With the budget deficit exploding, coupled with the Treasury having to raise an additional $300 billion plus/or minus per year to pay back the Federal Reserve as it rolls off its balance sheet, the supply of marketable Treasury securities hitting the market over the next few years will be unprecedented.

At the same, time the “free financing” of deficits provided by the central banks, including the Fed and foreign central banks, is over.   Not to mention the other factors which have kept rates low are fading.

Stay tuned!


TIC_7


TIC_1


TIC_6

Posted in Interest Rates, Uncategorized | Tagged , | 1 Comment

Social Security In Deficit = More Public Treasury Borrowing

Summary

  • Largely ignored by the markets,  Social Security moved into structural deficit this year
  • Social Security has been running primary deficits since the GFC; that is financing itself by the interest earned on Treasury securities
  • The government will no longer be able to borrow from the Social Security Trust Fund ( Old-Age Survivors Insurance (OASI) Trust Fund) to fund its on-budget deficits
  • The Social Security Trust Fund financed more than half the U.S. budget deficit during the mid-2000’s
  • The result will be more market supply of Treasury securities and upward pressure on interest rates
  • This post is an excerpt of our Sep 23rd post, The Gathering Storm In The Treasury Market 2.0

We suspect our Sep 23rd beast of a post,  The Gathering Storm In The Treasury Market 2.0,  was TLDR – Too Long, Didn’t Read.  One famous blogger said of it, “This post is so big, you can see it from space.”   We feel it was an important read for any market watcher as the 10-year T-Note yield is the most important price in the world.

In that post we which laid out why several factors which have kept U.S. long-term interest rates low and repressed term premium suppressed are fading,

Impatience and ADD equals missed opportunities,  as we wrote in the summary bullet points,

  • The yield curve is flat for technical reasons, and we believe term premia will increase
  • We expect a measured move in the 10-year Treasury yield to 4.25 to 4.40 percent, much sooner than the Street anticipates  – GMM, Sept 23rd

That was just before the 10-year yield broke out.

We are going to slice and dice the that post for an easier read for those of us use to 140 280 characters.

We named four significant factors that were changing and set to move long-term interest rates higher and increase the term premium.   This post extracts and focuses on the little noticed fact that Social Security has moved from surplus to deficit this year and the impact it will have on the Treasury market.

More than 70 million baby boomers are in the process of retiring and Social Security and Medicare are projected to run an  $82 trillion cash deficit over the next 30 years

Posted on September 24rd

Social Security Now In Deficit 

Another significant structural change in 2018 is that Social Security (SS) has moved into structural deficit.  In fact, SS began running a primary deficit (noninterest income less payouts) just after the GFC.

Treasury_SocSec_Projections

Source:  Social Security Administration 

Our chart below shows the U.S. government ’s off-budget balance, which only includes social security and postal service, the federal entities protected from the normal budget process, and excluded from budget caps, sequestration, and pay-as-you-go requirements.  The postal service is a tiny fraction of the balance.

Treasury_Off_Budget

The important takeaway is that the social security surpluses were used to build asset or reserves in their two trust funds:

1) Old-Age Survivors Insurance (OASI) Trust Fund, which pays retirement and survivors benefits, and 2) Disability Insurance (DI) Trust Fund, which pays disability benefits.

If one looks past the cash flow transactions to the impact on actual payments to and from the public, it becomes clear that an increase in trust fund reserves will be associated with a decrease in publicly held Treasury securities. That decrease in turn reduces the Treasury’s current cash needs for interest payments to the public and its need to borrow to make those cash payments.
– Social Security Administration

The large surpluses before the GFC (see above charts) provided a sizeable portion of the financing of the government’s on-budget deficit.   For example, the off-budget surpluses from 2002-2008 averaged $173.5 billion per year, which financed, on average, 40 percent of the on-budget deficits.

In other words, social security provided the U.S. government with a significant free-ride of deficit financing, and took substantial pressure off the markets, keeping interest rates low.

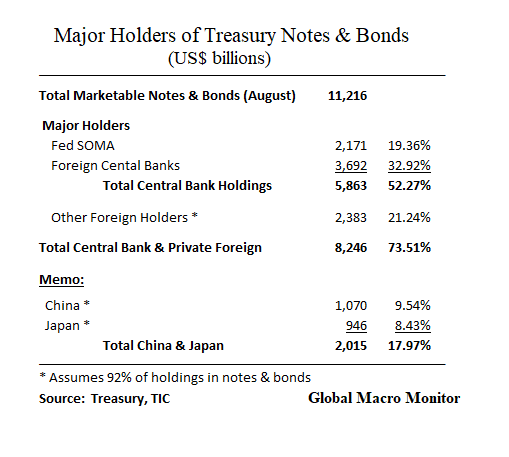
The next chart illustrates how the Treasury is becoming increasingly dependent on market financing as the social security surpluses faded and are now in deficit.  Marketable debt currently makes up 71 percent of the over $21 trillion total public debt versus  49 percent in 2007.


Treasury_%_Marketable_GAS

The upshot?  More relative issuance of Treasuries into the market and pressure on interest rates to increase and to crowd out other borrowers.

Posted in Fiscal Policy, Interest Rates, Uncategorized | Tagged , , , | 3 Comments

FOMC: Hardly Tight, Hardly Loco

The data speaks for itself.

Real Effective Fed Funds Rate (REFFR)

The real effective Fed Funds rate (REFFR), the Federal Reserve’s target rate of overnight commercial bank reserves lending rate less the CPI year-on-year change,  remains negative for the 36th consecutive month.

The REFFR has been negative during 87 percent of the months since the beginning of 2008, and 65 percent of the months this century,  compared to just 17 percent in the months from 1954 to 2000.  If, anything is crazy, that is just plain nuts!

If they are already whining about the Fed with a still negative real fed funds rate is there is any hope of  weaning the markets and economy from the crack?   A perpetual bull market is not an entitlement, folks, even though some seem to think so.

The REER monthly average since 2000 has been -0.43 percent compared to 1.95 percent from 1954 to 2000.

In other words, the Fed has been performing triage and has kept the economy in the ICU for most of the 21st century.   Not exactly a strong economy, in our book.

Balance Sheet

What’s getting tighter is the liquidity withdrawal due the Fed’s declining balance sheet, which is down equivalent to -$265 billion,  or about 6.75 percent of the end-Sept ‘17 monetary base, when the balance sheet reduction began.

Note the projected monthly roll off of the SOMA’s Treasury portfolio by the red bars in the below graph.  We estimate the Fed is set to reduce its balance sheet by another $125, including its MBS portfolio, in Q4.


REEFR_1


REEFR_2

REEFR_4

REEFR_3

Posted in Fed, Interest Rates, Monetary Policy, Uncategorized | Tagged , , | 8 Comments

Jamie And JP Mo = Class

Posted in Uncategorized | Leave a comment

More “Cranes Of Dubai” In NYC

You heard it here first, Comrades!

Just back home after a week-long road trip to many major U.S. cities.

The “Cranes Of Dubai” 

As an economist, I am always looking for anecdotal evidence of how the local economy is doing.  What impressed me most was the ubiquity of building cranes, which usually symbolize a top, or closer to, the end of a cycle, than a bottom

At the peak of the building boom in 2006, the apocryphal statistic that Dubai had between 15 and 25 per cent of the world’s tower cranes was widely reported. Some said there could be as many as one tower crane for every 44 residents. But industry experts say that while such “facts” made good headlines, they were unlikely to have ever been true.   – The National

Global Macro Monitor,  August 15th

https://twitter.com/tommythornton/status/1051571423909740544?s=21


Posted in Uncategorized | Leave a comment

Week In Review – October 12

Summary

  • Ugly week for equities
  • Russell 2000 led the U.S. indices down, falling over 5 percent
  • Shanghai down over 7 percent,  some of which was catch up after a week close
  • The 10-year yield rise, which triggered the equity correction,  stabilized peaking at 3.25 percent
  • U.S. credit starting to crack with lower tier spreads blowing out.  As we said last week,  watch this space!
  • EM FX a bit stronger led by Turkey with release of America pastor
  • Crude oil gave 4 percent back
  • Lumber =  Timber!  Now down almost 50 percent from its spring peak

Commentary:  Equities cracked as bonds cracked.  Watch the levels in following table on the S&P500.  Closes below the key .50 Fibo at 2736 and then 2688 makes it a high probability we see the February low.  Much will depend on the U.S. bond market.  Tuesday’s release of the TIC data, measuring foreign flows into the U.S. Treasury market are now exceptionally important to the stability of interest rates.

Angels Merkel’s coalition party took a beating in the Bavarian elections calling into question the stability of the German coalition government.  Unclear of impact on euro, but we bet it’s not a positive.  All eyes on Frankfurt elections in two weeks.  Looking for bounces to get shorty.


Week_Table_S&P500


Week_S&P500

Watch Europe on back of Merkel’s trouncing in the Bavarian elections

Week_Chart_1

Economic gains continue to accrue to capital over labor

Week_Chart_3_Economy and Wages

Saudi stocks hammered over tensions of the Washington Post’s journalist’s suspected murder

Week_Chart_2_Saudi Stocks


Week_2018_ETFs


Week_Table


Posted in Uncategorized | Leave a comment

Auf Wiedersehen, Angela?

Posted in Germany, Politics, Uncategorized | Tagged , , | Leave a comment

Sector ETF Performance – October 12

Sector_ETF_Day

Sector_ETF_W

Sector_ETF_M

Sector_ETF_YTD

Posted in Sector ETF Peformance, Uncategorized | Tagged | Leave a comment

Global Risk Monitor – October 12

RiskMon_1

RiskMon_2

Posted in Daily Risk Monitor, Uncategorized | Tagged , , , , , , | Leave a comment