World’s Fastest Growing Economies In 2018 & 2019

The latest data just released from the IMF.

We have updated the 2018 and 2019 annual GDP forecasts of the world’s country GDPs in our ginormous table below. The data are from the recent release of the October  2018 IMF’s World Economic Outlook.

Let’s begin by first checking out the G20 data.


IMF G20 Growth


IMF_World Growth


Posted in Economics, Uncategorized | Tagged , , , | Leave a comment

Fighting Back


Love this.


Posted in Uncategorized | Leave a comment

Manufacturing Employment Growth During President Trump

After Friday’s jobs report, we thought it is time to dig deeper into employment growth in the manufacturing sector.

Manufacturing Jobs Matching Growth In Total Nonfarm Payrolls

Contrary to popular belief, the data show that job gains in the manufacturing sector are not experiencing outsized growth.  Employment in the industry has grown at about same pace as private nonfarm payrolls since January 2017, just a little over 3 percent.  Manufacturing employment has, however, recovered smartly under President Trump, after a period of almost zero growth during the last 20 months of President Obama’s administration.

The bulk of manufacturing employment growth has occurred in food manufacturing, fabricated metals, and machinery.

Job Growth Still Lagging in The “Poster Children” – Steel and Autos

Job growth in the sector’s  “poster children”  — steel production and auto manufacturing — remains tepid, at best.

Employment in the steel industry (highlighted in red) has yet to match the spike in steel prices and profits, which have skyrocketed after the implementation of President Trump’s tariffs.

CLAIRTON, Pa. — When President Trump imposed tariffs on steel imports in June, Richard Lattanzi thought of dozens of his fellow steelworkers who have for years put off badly needed repairs of their cars and homes.

“There was a lot of excitement here; there were a lot of us saying, ‘It’s about time someone is looking out for us,’ ” said Lattanzi, the mayor of this town of 7,000 and a safety inspector at the U.S. Steel plant in nearby West Mifflin. “A lot of people around here were saying, ‘We’re going to be okay.’ ”

Four months later, Lattanzi is less optimistic. Production at U.S. Steel’s facilities have ramped up, and the company announced this summer that, thanks in part to the tariffs, its profits will surge. But in interviews in recent weeks, Lattanzi and other steelworkers said they’re no longer confident they’ll take part in the tariff bounty.  – Washington Post, October 3rd

Auto manufacturing jobs continue to decline, down 8,000 since the beginning of President Trump’s term.

Mining Employment And Oil Prices

Finally, where employment growth is experiencing outsized gains is in the mining sector, up over 16 percent,  which is almost entirely the result of the recovery in oil prices. The crude price collapsed over 70 percent before bottoming at around $30 bbl in early 2016, forcing mass layoffs in the oil patch, which are now being recovered.

Coal mining jobs, for example, have only increased by a little less than 2,000, but it does represent a reversal in the decline under President Obama.

Construction jobs are also growing smartly


Man_Employment_2


Man_Employment_1


Employment_2


Man_Employment_4


Employment_1

Posted in Employment, Uncategorized | Tagged , | 6 Comments

Week In Review – October 5

Summary

  • Ugly week for Global Bonds.  Run to our Sept 23rd post, The Gathering Storm in the Treasury Market 2.0,  as to why we thought yields were about to spike.  Boy, did they
  • Stocks followed bonds lower causing pain the interest rate parity funds
  • Credit hanging in there.  Need weakness here to validate a stock market top.  Watch this space
  • EM FX hammered x/ Argentina, which is experiencing an oversold bounce and afterglow of an updated IMF deal
  • Commodities showing some life, led by nattie and the grains

Commentary:  All eyes on long-term interest rates this week.  If the bond sell-off accelerates, expect a big risk-off move this week.  Rising rates are not good for the now heavily indebted AE sovereign sector.  Potential doom loops ahead:  rising interest rates = interest payments = rising deficits = rising interest rates = rising interest payments = rising deficits = rising interest rates.   The U.S. bond market seems oversold and should, at least, generate and dead cat bound here.  If not, GULP!

10-year Treasury Note Yields

Week_Chart_1

Source:  Jesse Colombo @TheBubbleBubble 

Week_2018_ETFs


Week_Table

Posted in Bonds, Uncategorized, Week in Review | Tagged , , | Leave a comment

Brazil’s Presidential Election….

Looks like off to Round II — October 28th — as no candidate set to receive 50 percent of the first round vote, with Brazil’s Trump fanboy securing around 45 percent of the vote.

Note, Brazil’s similar gender divide in support of Bolsonaro as American women have with President Trump.

An interesting thing to keep an eye on as results come out are the breakdown of votes along gender lines.

Though he is in the lead, Bolsonaro is the candidate with the biggest discrepancy between his male and female vote, not only in this election, but in the history of Brazil.

Polls from a month ago showed that 49% of women in Brazil oppose Bolsonaro’s candidacy, compared with just 37% of men and in some states Bolsonaro has 75% less support among women than men.

This could be related to the fact that the far-right candidate has previously called women idiots, tramps and unworthy of rape.  – The Guardian

Brazil Exit Polls

Posted in BRICs, Uncategorized | Tagged , | Leave a comment

Sector ETF Performance – October 5

Sector_ETF_Day

Sector_ETF_W

Sector_ETF_YTD

Posted in Sector ETF Peformance, Uncategorized | Tagged | Leave a comment

Global Risk Monitor – October 5

RiskMon_1

RiskMon_2

Posted in Daily Risk Monitor, Uncategorized | Tagged , , , , , | Leave a comment

Politics Of The Employment Report

Today’s nonfarm payrolls miss,  134k total jobs created in September, sealed the deal on the job creation political debate before the November midterms.   That is all things being equal — during President Trump’s first 20 employment reports versus President Obama’s last 20 — the Trump economy created 347k fewer total nonfarm payroll jobs, and 137k fewer private sector jobs, than President Obama’s economy.

The differential will move even more against President Trump when October nonfarm payrolls are reported, the Friday before the election, as the May 2015 326k jobs comp will be a bar too high to conquer.

These are the facts, spin them as you wish.

On the eve of the midterm elections it is very likely the Democrats will be able to argue that President Obama’s economy created 500k more jobs than President Trump’s economy over a similar period.   Reality clashes with virtual reality and bombastic rhetoric.

Perspective

However,  all things are never equal.  The Trump economy is running up against labor constraints with shortages breaking out almost everywhere, which is reflected in today’s 3.7 percent unemployment rate print, a 49-year low.   It’s difficult to create the marginal job on this side of the inelastic labor supply curve.

Data should always be placed in the proper context.  But, hey, we are talking politics here,  which almost always surrenders to spin and is rarely about rational discourse. Moreover,  “politics ain’t beanbag,” folks.

Other Notables 

  • The shrinking labor supply is illustrated in the inflation differentials during the two periods –  4.14 percent under Trump, and 2.12 percent during Obama’s last 20 months in office.
  • Trump’s nominal Average Hourly Earnings are running about 70 bps higher than Obama
  • Real Average Hourly Earnings under Trump is about 1.3 percent lower than during President Obama’s last 20 employment reports
  • Real GDP growth under Trump is almost double President Obama’s last six quarters in office, but not reflected in the overall labor market, which reflects the economy continues to reward capital disproportionate to labor
  • Manufacturing jobs have recovered smartly during President Trump’s first 20 months, much of it due to the increase in oil prices, especially in the mining sector
  • Job creation in the government sector, which, on average, generates higher income paying jobs than the private sector, is much lower under President Trump


Employment_2


Employment_1

Posted in Employment, Politics, Uncategorized | Tagged , , | Leave a comment

Alea Iacta Est!

As Julius Caesar crossed the Rubicon River with the 13th legion into Italy to march on Rome, he turned to one of his deputies, quite possibly, Marc Antony, and made the famous remark, “alea iacta est.”  Historians translate this as “the die is cast,” the decision is made, there is no going back.

Yields Cross The Rubicon

Today the U.S. bond market crossed the Rubicon with the 10-year yield breaching major resistance at,  let’s call it, 3.12 percent, a high that hasn’t been seen since July 2011, ironically the month named in honor of Julius Caesar.

July 2011 was also just before or in anticipation of “Operation Twist,”  the Fed’s program to manipulate longer-term rates lower.


Treasury_1_Oct3


You know what we think about the Treasury market.

We laid out all the reasons why the structural factors that have kept long-term interest rates low and risk premia suppressed are fading in our September 23rd beast of a post,  The Gathering Storm In The Treasury Market 2.0.  

Also, have a look at our Monday piece on the massive short build in 10-year note futures.

Though it’s too early to tell, the move in the 10-year yield today may be the signal that global bond yields are awakening from their QE-induced slumber.  The flow of long-term notes and bonds is rising, as the Treasury issues more securities to finance larger budget deficits,  but the big short in 10-year note futures remains, and the relative stock/float of long-term Treasuries is still low.

It may take a few days of trading above the breached resistance level to bolster the confidence of the bond bears.


Treasury_2_Oct3

Nevertheless, a more “normal” long-term yield would be closer to a 3 percent real rate, which is more than a chip shot from here, and, at the very least, two drivers away from today’s 3.16 percent close.   We expect the first drive to hit the the 4.25 to 4.40 percent range, which is a measured move of the inverse head and shoulders pattern in the above chart, probably sooner rather than later.

Even the 10-year Japanese bond yield is pressing up against two-year highs, albeit at a poultry 15 bps.

QE Induced Asset Market Psychosis

Supply shortages, induced mainly by central bank quantitative easing have been a major factor driving asset markets, in our opinion.  Not all, but a big part.

Risk-free bonds have been in short supply as central banks have hoovered up their home country government bonds with quantitative easing.

Treasury_4_Oct3

Equity Float Shrinkage

The float of total U.S. equities has shrunk dramatically, in part, due to cheap financing to fund share buybacks.   The technical shortage of stocks have helped boost U.S. equity markets and killed off the most of the bears and short sellers.

We have no idea if short sellers can push the market lower on a sustained basis as rates rise, forcing some real selling in the near term.  Probably not, if we define near term, say, as in the next month.

It’s possible, but our recency bias tells us no, unless rates move to our target range more rapidly than we even expect.   Today’s increase in yields did cause selling into the close.

Treasury_3_Oct3

Source:  Yardeni Research

Housing Market

Even the housing market suffers a dearth of supply.

Private equity, now the largest single holder of single-family residential real estate, has taken a massive supply of homes off the market and converted them to rentals, partly due to the lower cost of capital caused by the manipulation of the Treasury yield curve.  Will these investors start to sell down their inventory as rates move higher, or just continue to raise rents, which could create a real political problem?

…one-fourth of the country’s single-family rental homes are now owned by institutional investors, with more than 200,000 families paying their rent to just nine giant Wall Street-backed firms. According to a report by the Harvard Joint Center for Housing Studies, the majority share of all U.S. rental units (52.2 percent) are owned by institutional investors, and the investor-owned share of single-family homes increased by nearly 40% from 2001 to 2015.5ACCE

We suspect a populist message from a 2020 presidential candidate railing against the “Wall Street firms, who were bailed out then bought your homes in bankruptcy and are now raising your rents”  would resonate with the hoi polloi.   Even if it’s true, or not.

In California, rent increases by some of the largest Wall Street landlords have been astronomical. For example, Colony Starwood Homes reported that in Northern California rental renewal rates increased by 9-13%, the largest in the nation. This means that if tenants already living in a Colony Starwood home want to continue to rent, they must pay between 9 to 13% more each year. A survey conducted in early 2017 of Los Angeles County tenants renting from Invitation Homes and Colony Starwood shows consistently high rental increases in the Southern California market as well. Of the 100 tenants surveyed, 77% reported rental increases and the average reported increase was 9% or $171 per month.  – KCET 

Does “truth” even matter today?  It’s only true if you believe it to be true in our postmodern Trumpian era.

Treasury_5_Oct3

Vulnerable Markets

The structural factors that have kept U.S. long-term interest rates low are now fading and yields are set to move significantly higher. That is back to normal.

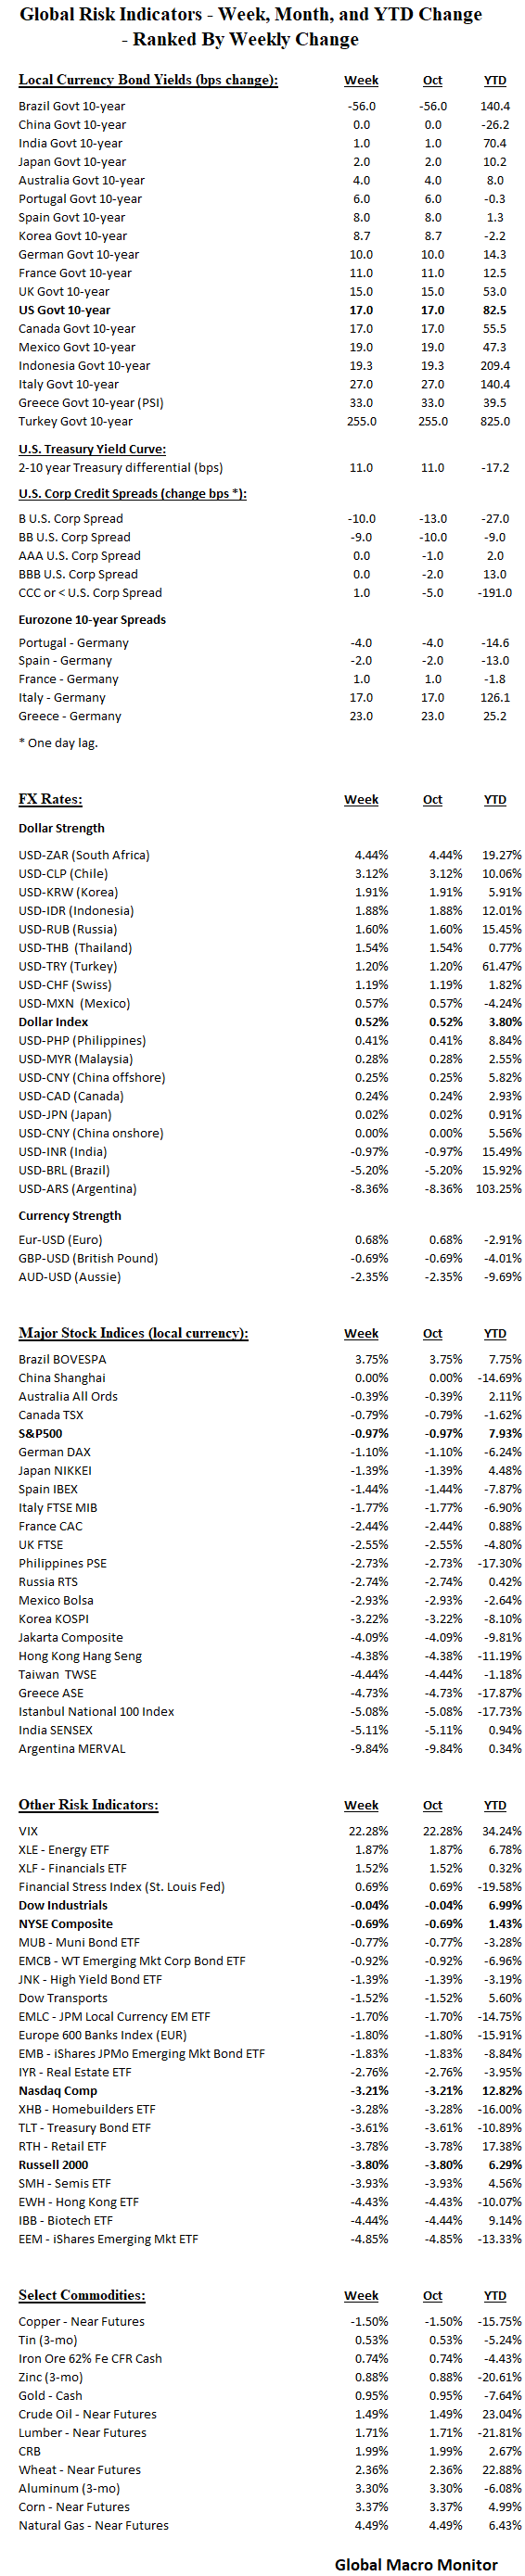
The markets, which look the most vulnerable on a technical basis in the near-term, are those that have seen a significant increase in supply since the financial crisis.  Such as emerging market debt and U.S. corporate bonds and debt at the lower end of the investment grade spectrum.


Global Debt Increase

Commercial Real Estate

Also keep the commercial real estate sector on your radar,

With investors acquiring $30.5 billion in industrial assets in the first half of 2018, JLL’s H1 2018 U.S. Investment Outlook report notes that the industrial sector is on pace for a new record year in terms of transaction volume and is expected to surpass the previous high point of $67.8 billion in 2015. That momentum, coupled with $20 billion in large scale transactions that are under contract and set to close in the second half of 2018, serves as evidence of the intensity of investor competition for industrial assets.

As a result, the national average cap rate across all classes of industrial assets has dipped to a record low of 7.0 percent. Average cap rates are even lower in the five industrial markets with the most supply constraints: 4.5 percent in Orange County, Calif.; 5.0 percent in San Francisco; 5.2 percent in Los Angeles; 5.3 percent in the Inland Empire and 5.4 percent in Seattle.

At the peak of the last cycle, the average cap rate for industrial assets was 7.2 percent, according to Chang. But starting with 2010, when the figure reached 8.7 percent, industrial cap rates have continued to drop, driven by economic expansion and growth in e-commerce sales.  – National Real Estate Investor

Recall our “Cranes of Dubai” comment after returning from summer break.

Euro Sovereign Bonds

The market to closely monitor now is European sovereign bonds.  The ECB’s QE is set to end in December and inflationary pressures are building.  The yield spread between U.S bond and German bunds is approaching long-term highs.

Treasury_6_Oct3

          Source:  Frederik Ducrozet  @fwred

Italy is the wild card, but we suspect the government has enough leverage with the EU due to the country’s importance in the euro and the sheer size of its bond market.  Though it will upset many Germans, the EU will likely calculate that bigger budget deficits in Rome are not worth blowing up Europe.   In other words,  lot’s of noise to come.

We expect European interest rates to rise significantly over the next year, reinforcing the global bond bear market.

Upshot

All of the above will take time to unfold, with the usual ebb and flow of markets, providing traders with many profitable opportunities.

Rome wasn’t built in a day.  Alea iacta est!

Posted in Bonds, German Bund, Interest Rates, Uncategorized | Tagged , , , | 19 Comments

The New FX Model: PMI Differentials?

One of Australia’s finest, and best market analyst, Greg McKenna, and more important, our good friend, posits a new exchange rate determination model:  PMI differentials.

We cut our teeth as a young economist on Anne Krueger‘s book,  Exchange Rate Determination.   The book is dated, but we highly recommend it, a good and quick read.

FX traders use many models to justify and fundamentally rationalize trades at any period in time, such as:

  1. GDP growth differentials;
  2. Interest rate differentials;
  3. FX reserve levels (mainly in the emerging markets, especially);
  4. Current account balances;
  5. Capital flows;
  6. Purchasing Power Parity (long-term model);
  7. Other;
  8. and, now, Greg’s PMI Differentials

FX traders are married to none of the above, and switch back-and-forth between the various FX models, or, at least, they act as if they do.

The key to success in trading is to understand what is the dominant model driving the market at any given time and determining the trend if one exists.

Posted in Capital Flows, Exchange Rates, Uncategorized | Tagged , , , , | 4 Comments