COTD: Executive Orders by President

Nice chart by the Daily Dot coming to us via King David over at  Think In The Morning.  Check out his blog, one of the smartest economists we know.

The data totally contradict the meme that President Obama is the ‘King of the Presidential Executive Order’ and chooses to rule by fiat rather than working with Congress.   Ronald Reagan signed 381 executive orders versus President Obama’s 260.  Of course, that will change as Obama leaves office, but using the current data from the chart, President Reagan signed almost 50 percent more executive orders than has President Obama!

Welcome to the post-truth world, folks, where  “facts are just political opinions” All the rage, no?

We will never pass up an opportunity to preach the words of Thomas Jefferson as our Democracy slides into a bear market, which we hope is just cyclical and not secular.  We fear the later, however.

“If a nation expects to be ignorant and free in a state of civilization, it expects what never was and never will be.  If we are to guard against ignorance and remain free, it is the responsibility of every American to be informed.”  – Thomas Jefferson

Those f%*king iPhones, gadgets, and the internet that distract us from pursuing the truth — and, furthermore, distorts it with fake news, etc.!   Walter Cronkite where are you?

Here is some good commentary on the chart from Daily Dot,

Every U.S. president from George Washington to George W. Bush has issued presidential executive orders to implement policies without Congress. Several have issued executive orders that revoked those of former presidents. According to the Congressional Research Service, a pair of Bush executive orders changed an executive order by predecessor Bill Clinton which further modified executive orders by Ronald Reagan which he issued to replace those issued by Jimmy Carter. Obama was able to eliminate these all with a single executive order. 

Republicans argue that Obama’s executive orders are too plentiful and try to do too much without the input of the legislative branch. House Republicans even authorized a six-month task force to study the impact of what they believe to be an unprecedented use of executive powers in the Obama administration.

“This threat that the president’s going to run the government with an ink pen and executive orders, we’ve never had a president with that level of audacity and that level of contempt for his own oath of office,” Rep. Steve King (R-IA), the task force’s chairman, said on CNN. 

Meanwhile, the White House pointed out that—at least numbers-wise— Obama isn’t the worst offender when it comes to executive orders…

..using data from the American Presidency Project at the University of California, Santa Barbara, the Daily Dot ranked all the U.S. presidents by the number of executive orders they issued while in office. 

presidential-executive-orders

(COTD = Chart of the Day)

Posted in Politics, Uncategorized | Tagged , | 1 Comment

World Consumer Inflation Rates

We have ranked the world’s 2016 consumer inflation rates by country in the ginormous table below.  The data are from the October 2016 IMF’s World Economic Outlook database.  Note, 2016 are IMF estimates.

But, first, check out the low inflation, but rising x/ Japan, rates foe the G5,  and some interesting central tendency measure inflation rates for the world.

Global inflation running just about “Goldilocks”, no?   Note the difference from the  median and average country inflation rates.  Skewed by the top 5 countries.

g5_inflation_dec19world_inflation_dec19


Posted in Inflation/Deflation, Uncategorized | Tagged , , , | Leave a comment

Time To Buy A New or Used Car?

Folks, easy money/ conusmer credit almost always moves consumption  forward and robs from the future.  Not the case with capital investment and capital accumulation however, which are the foundations of growth.

I posit the slow growth in the G5  is now experiencing, as posted in our last piece, is the result of too much consumer borrowing and thus pulling consumption forward.

Isn’t that exactly what is happening here to GM car sales now?  The overhang  of too much credit and the bursting of the subprime auto credit bubble?

gm_inventory_dec19

Hat Tip to Wolf Richter Twitter.

Posted in Economics, Uncategorized | Tagged , , | Leave a comment

World’s Fastest Growing Economies

We have ranked the world’s country 2016 GDP growth rates in the ginormous table below.  The data are from the October 2016 IMF’s World Economic Outlook database.

But, first, check out the dismal economic performance of the G5 economies.

g5_gdp_growth_dec19

world_gdp_growth_dec19

Posted in Economics, Uncategorized | Tagged , , , , | Leave a comment

COTD: Raw Materials

Nice chart/infographic,  Where do our raw materials come from?

From the BullionVault,

WHICH countries produce the raw materials we all need and use every day? Who mines the copper, grows the timber, makes the cement and harvests the coffee all fueling our modern lives?

BullionVault’s latest infographic shows the global output in Dollar terms of the world’s most important natural resources and raw materials, plus the top 3 countries where they originate.

China dominates the production of many natural resources. In fact, of the 17 substances below, China is the largest producer of 9 of them. China produces a staggering amount of silk (84%), lead (52%) and coal (47%). Meanwhile, Latin American countries lead the production of coffee beans and silver.

In 2015, China was also the biggest gold-producing country for the 7th year running, responsible for 14% of world mining output, while Mexico produced 21% of the world’s silver and South Africa turned out a massive 71% of all the world’s platinum.

Take a look at the infographic below to discover which countries lead production of the raw materials we all rely on.

rawmaterial_chart_dec19

(COTD – Chart of the Day)

Posted in Commodities, Uncategorized | Tagged , | 2 Comments

US Sector ETF Performance – Dec 16

etf_detf_wetf_metf_q4etf_ytd

Posted in Sector ETF Peformance, Uncategorized | Tagged , | Leave a comment

Daily Risk Monitor – December 16

Click on table to enlarge and for better resolution

riskmon_1riskmon_2riskmon_3

Posted in Daily Risk Monitor, Uncategorized | Tagged , , , , , | Leave a comment

Presidential Stock Market Returns

We’ve been busy crunching data from the Measuring Worth website on the Dow Jones Industrial Stock Index returns for each Presidents’ administration  going all the way back to Teddy Roosevelt.  We find the data very interesting and will, mostly, let it speak for itself.   Note,  President Obama still has about 20 trading days left in office.

presidential_stock_table_dec16

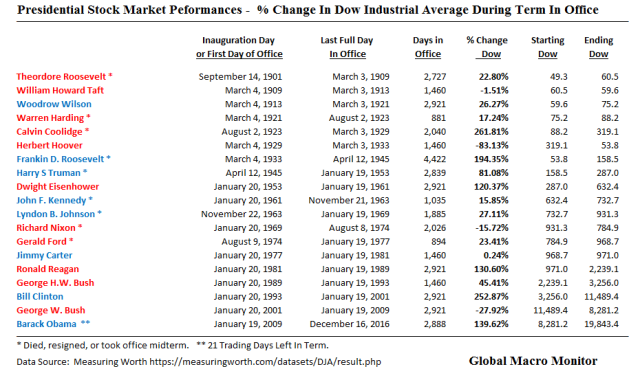
A few caveats,  the returns should be discounted for the total days in office.  For example,  FDR was elected to four terms and served 4,422 days in office before his death in April 1945, while JFK served only 1,035 days before his assassination and Gerald Ford, 894 days, finishing out what was President’s Nixon second term.  In general, the longer the time frame, the higher the return.

Also Measuring Worth notes,

Observations from October 7, 1896 to July 30, 1914 are from the first DJIA and has been adjusted to merge with the second series. See Source Note for DJA.

presidential_stock_chart_dec16

Roaring Twenties Top All
No doubt the 1920’s were truly “The Roaring Twenties!”   Check out the returns of Calvin Coolidge, add that to Warren Harding, who died in office in 1923, and couple those with another almost 20 percent move higher in the first 6 months of the Hoover administration before rolling over hard on Sept 3, 1929.  That was one helluva bull market and stock market bubble.

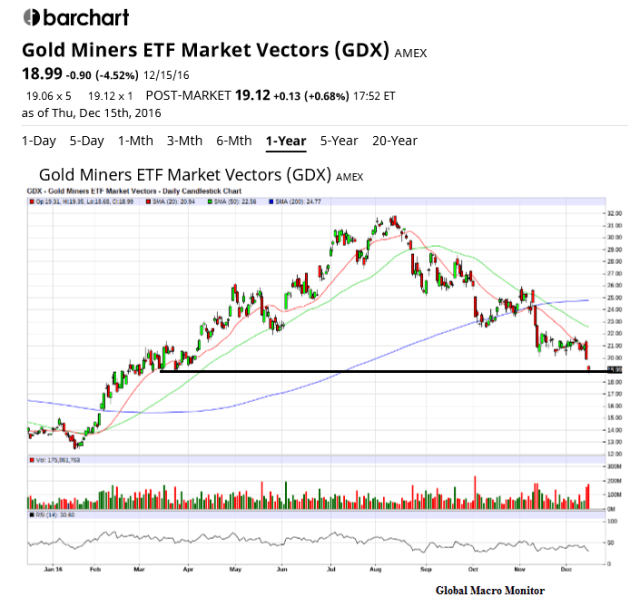
President Clinton also presided over a huge stock bull market and bubble with the Dow peaking at 11,722.98 on January 14, 2000.  President George W. Bush inherited the bursting bubble that did not bottom until almost  two  years into his Administration  at  7,286.27 on October 9, 2002.  The Dow thus plummeted 38 percent from the Clinton peak to the Bush 43 trough.

The Dow doesn’t do justice to the magnitude of the Clinton bull market/bubble as the dotcoms of the NASDAQ rose and lost much more,  more than double the Dow returns.  We were forced to use the Dow Jones Industrial Average as it was the longest running time series.

W.’s Bookend Bubbles
President Bush 43, with the second worst  Dow performance,  inherited a bursting bubble from President Clinton and handed off a bursting stock market — more of a bursting credit bubble — to President Obama.

The only reason we are all not living under a freeway and eating bark — i.e., a Great, Great, Great…. Depression — is the heroic and decisive efforts of Team Paulson, Bernanke, and Geithner.  Add Barney Frank to that list, who led Paulson’s effort on Capitol Hill — ironically, fighting against the Republicans, who initially opposed their own White House’s  stablization policies.  That was, until the Dow fell 777 points after the House’s first thumbs down vote on the Troubled Asset Relief Program (TARP)

.As it turns out, the House actually had to vote twice for the particular bill in which TARP was included. The first vote was on Sept. 29, 2008. The legislation failed to move, though, with 205 representatives voting in favor and 228 against. Of those who voted for the the passage, 140 were Democrats and 65 were Republicans.  – PolitiFact

If only these guys  and their collective knowledge  had been around in the early 1930’s,  maybe……..?   If, only.  But, hey,  then Bernanke wouldn’t be an expert on the Great Depression.   We are going to post an interesting piece on the Hoover administration next week. Make sure and look for it.

Nevertheless, the Dow was already crashing before the October 1929 crash, already down 31 percent from the September peak on the eve of the “Black Tuesday” crash and hit a short term bottom in November.  It banged around for about a year until the financial system suffered some major hits and the Fed failed to provide the necessary liquidity to prevent bank failures.  This, as Ben Bernanke likes to say, put the “Great” in the Great Depression.  The U.S. was considered in just a normal recession and appeared poised for recovery until the banks started to fail in the late 1930’s and 1931.

Yeah, yeah, yeah… we get it, some of these guys were partially responsible for creating the 2007-09 bubble and economic/financial imbalances in the first place.  And that angers us as much as you.  But, seriously, folks,  let’s not quibble when the house is burning down.  Let’s get the fire put out first!

“If you have a neighbor, who smokes in bed. And he’s a risk to everybody. If suppose he sets fire to his house, and you might say to yourself, ‘I’m not gonna call the fire department. Let his house burn down. It’s fine with me.’ But what if your house is made of wood? And it’s right next door to his house? What if the whole town is made of wood? Well, I think we’d all agree that the right thing to do is put out that fire first, and then say, ‘What punishment is appropriate? How should we change the fire code? What needs to be done to make sure this doesn’t happen in the future? How can we fire proof our houses?’ That’s where we are now. We have a fire going on.”   – Ben Bernanke

Facts versus Political Opinion
We’re  trying to state facts and make objective inferences from the data here.   Conflating facts with opinions or not being able to distinguish the difference between the two are the very  reason our democracy is faltering, in our opinion

It’s dangerous and we should heed the words of Thomas Jefferson,

“If a nation expects to be ignorant and free in a state of civilization, it expects what never was and never will be.  If we are to guard against ignorance and remain free, it is the responsibility of every American to be informed.”  – Thomas Jefferson

Look at, for example,  the stunning result of this opinion poll taken in May by  Public Policy Polling:

pp_stockmarket_poll_dec17

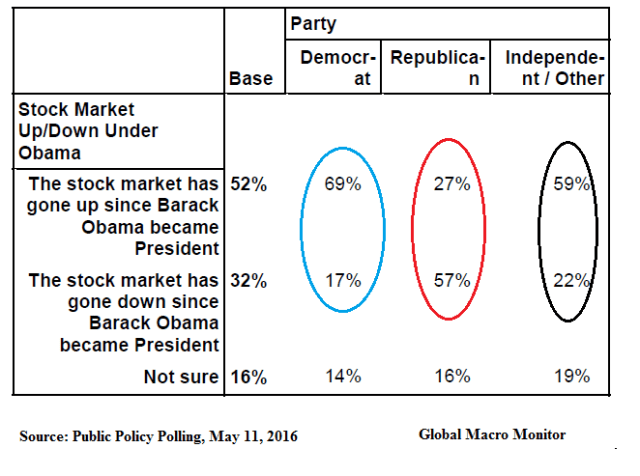
It is a fact the stock market has gone up under Barack Obama.  Not political opinion, but fact.   Yet by a margin of almost 30 percent,  those Republicans polled believe the stock market has gone down under President Obama.  Who are these people?

And this,

ppp_unemployment_poll_dec17

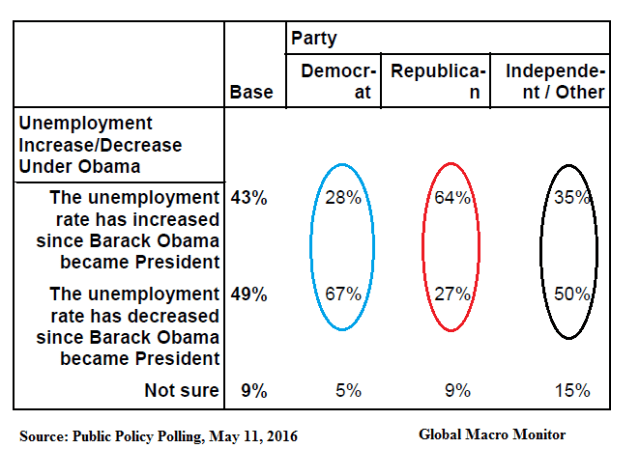
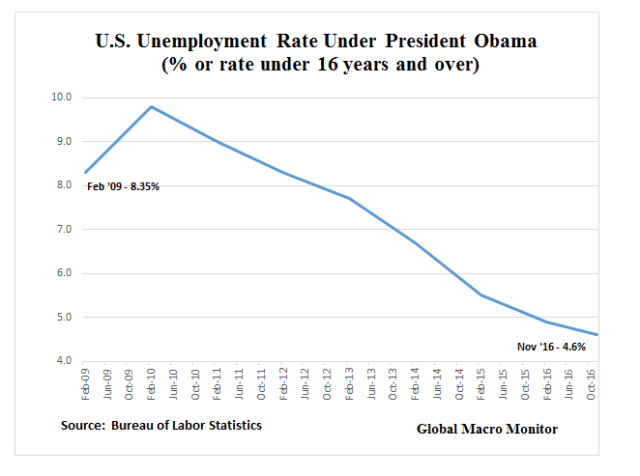
It is fact,  unemployment has gone down under President Obama, almost halved.

unempolyment_rate_dec17

This poll may be an aberration, but we can’t help but think that American democracy is in a bear market.   Fake news, facts are political opinions,  all the rage!   Lord, help us.

Now Ready For Some Data Partisanship?
You know we are fairly non-partisan over here at Global Macro Monitor.  In fact, our party affiliation in our state defines us as,

Voters who registered to vote without stating a political party preference are known as No Party Preference (NPP) voters.  NPP voters were formerly known as “decline-to-state” or “DTS” voters. – California Secretary of State

Nevertheless, let us finish with some data that kind of blew us a way.

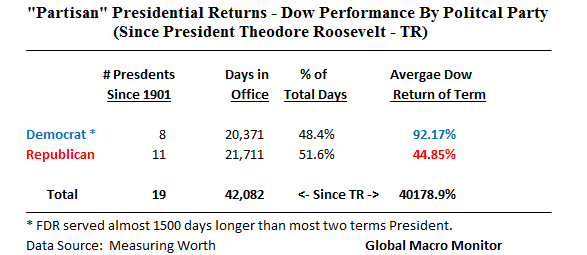
The following table looks at the average of the returns of Democrat and Republican administrations on the Dow Jones since Teddy Roosevelt.

presidential_partisan_dec16

Absolutely stunning.

The average return on the the Dow Jones Average return under Democratic regimes is more than double than the average for all the Republican regimes – 92.17 percent vs. 44.85 percent, respectively.  Just the facts, ma’am!

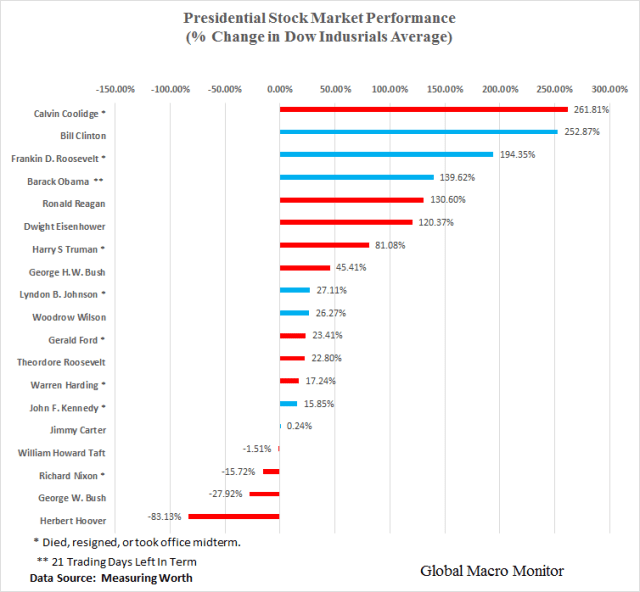
Furthermore,  all of the Presidential administrations where the Dow return was negative were Republican.  That is kind of astounding given the popular perception that Republicans are best for the stock market, no?

Note, President Carter squeaked out a positive return, 0.24 percent,  probably due to the 3.6 percent Reagan rally from the eve of election day to his inaugural.  Interestingly,  the Dow rallied 6.72 percent from the eve of the election on November 3, 1980 to November 20th before hitting key resistance at Dow 1,000,  then rolled over.   Also note,  traders sold the news and the Dow fell 18.28% from the Reagan inaugural to August 12, 1982 as the economy was in the throes of a deep recession.

Will the same happen with the Trump rally?  The Dow is up 8.67 percent since the eve of his election.  Trump inherits a much stronger economy than President Reagan, however, but the Reagan bull market had the tailwinds that it was the beginning of a 35-year bond bull market, which began in September 1981, where the 10-year Treasury note peaked around 16 percent,  and drove almost every asset class from real estate to stocks.

The incoming Trump administration faces the prospect of the end of the bond bull market and rising interest rates, however.   Stay tuned on this one.

 Interpreting the Data
We could massage and nuance the interpretation of this data until the cows come home.

Yeah, the data is skewed by Hoover, but the same can be said by Coolidge’s 262 percent return, no?   Yes,  Obama almost bottom ticked the Dow and W. inherited a major bear market from Bill Clinton.  Or, whatever.

What is really impressive is the over 40,000 percent increase  in the index since TR took office in September 1901.  That is a long-term affirmation and confidence in our country and confirms our view to “never short America”  over the long-term.

Was Truman Right?
So,  after looking at the data, maybe President Harry S Truman was right when he stated:

Harry Truman Quote.png

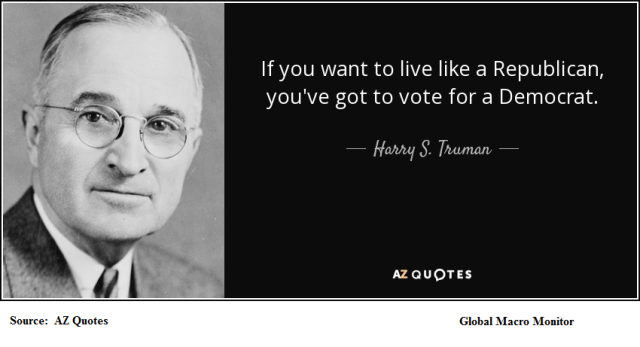
There you have it, folks.  Let the debate begin.


Posted in Equities, Politics, Uncategorized | Tagged , , , | 7 Comments

China Pushing Back, Gold Spikes $10

As we said a few days ago in our post,  Is Gold Finished,

to get a new bull market jump started…a bull market sparked by geopolitical risks, which could increase markedly, in a scenario where, say,  the new President-elect tries to bully the Chinese on various issues, and Mr. Xi, probably China’s strongest leader since Mao,  has to save face.  One morning we could wake up and U.S. battleships are squared off with the Chinese navy in the South China Sea.   Gold soars!  God help us.

We get the news this morning,

China has seized an unmanned underwater vehicle deployed by a U.S. Navy ship in international waters, according to Pentagon officials.

The seizure of the underwater vehicle took place Thursday, about 50 nautical miles northwest of Subic Bay in the Philippines, Pentagon Press Secretary Peter Cook said in a statement Friday.  – NPR

And this from the Guardian,

China’s Liaoning aircraft carrier battle group has conducted its first exercises with live ammunition, the country’s navy said, in a show of strength as tensions with the US and Taiwan escalate.

China’s first and only aircraft carrier led large-scale exercises in the Bohai Sea, the navy of the People’s Liberation Army announced late on Thursday.

Definitely China pushing back on President-elect Trump’s Taiwan strategy and tough rhetoric.

And we get this when the tape bomb hits the wires,

gold_dec16

Probably won’t stick,  but, for sure, gold going to build in a geopolitical risk premium as tensions with China heat up.

Don’t think putting Taiwan on the table as a negotiating ploy is a good strategy, in our opinion.   Some things are off limits and Mr. Xi is sending that signal on Taiwan.  Tantamount to asking your opponent to put his/her mother on the table as a negotiating chit.  Some things are just not negotiable.

Stay tuned.


Posted in Uncategorized | Tagged , | 2 Comments

Watch Those Gold Miners (GDX)

The gold miners index (GDX) gapped down another 4 1/2 percent today even after yesterday’s 5 percent down day.  Gold, the Feb futures contract, closed down about another $15 lower from the 5 pm electronic futures market close in New York last night.

The GDX also broke the key Fibonacci .618 retracement level  — from the swing January low to the swing August high — at $19.67 and is now barely hanging on to the March support at just under $19.   If it doesn’t hold here, the next stop looks to be the year and all-time low at $12.47.   Not going to get there tomorrow,  but we think – are guessing –  we close the year at around $16, down another 15 percent from today’s close.

This  would still give the GDX a respectable 17.7 percent return on the year.    The index is currently up 40 percent year-to-date even as gold, the commodity, now just up 6.4 percent year-to-date,  is going down faster than a case of a beer at a college frat party.

Note, the GDX  RSI is starting to signal oversold at 30.6.   Maybe that is why we saw big buyers step in right at the close to send the price back up to $19 level.

Stay tuned.

gdx_dec15


Posted in Gold, Uncategorized | Tagged , , | Leave a comment