


-
In economics, things take longer to happen than you think they will, and then they happen faster than you thought they could.
-
Join 1,218 other subscribers
Contribute To GMM

Categories
- 3D Printing
- Agriculture
- AI
- Algos
- Apple
- Automation
- Banking
- BFTP
- Bitcoin
- Black Swan Watch
- Bonds
- Brazil
- Brexit
- BRICs
- Budget Deficit
- Capital Flows
- Cartoon of the Day
- Cashless Society
- Chart of the Day
- Charts
- China
- Clean Tech
- Climate Change
- Coach C
- Commodities
- Coronavirus
- COVID
- Credit
- Crude Oil
- Currency
- Cyprus
- Daily Risk Monitor
- Day In History
- Debt
- Demographics
- Disinflaton
- Dollar
- Earnings
- ECB
- Economics
- Economist
- Egypt
- Electric Vehicles
- Emerging Markets
- Employment
- Energy
- Environment
- Equities
- Equity
- Euro
- Eurozone Sovereign Spreads
- Exchange Rates
- Fed
- Finance and the Good Society
- FinTech
- Fiscal Cliff Monitor
- Fiscal Policy
- Food Prices
- France
- Futurist
- Game Theory
- General Interest
- Geopolitical
- Geopolitics
- German Bund
- Germany
- Global Macro Watch
- Global Reset
- Global Risk Monitor
- Global Stock Performance
- Global Trend Indicators
- Gold
- Greece
- Healthcare
- Heat Map
- Hedge Funds
- Housing
- Human Interest
- Immigration
- Impeachment
- India
- Inequality
- Inflation/Deflation
- Infographics
- Innovation
- Institutional Investors
- Interest Rate Monitor
- Interest Rates
- Interviews
- Italian Yields
- Italy
- Japan
- Jobs
- Lectures
- Macro Notes from Conference Calls
- Manufacturing
- Masters
- Mexico
- Monetary Policy
- Movies
- Muni Bonds
- Muni Market
- Natural Gas
- News
- Nonlinear Thinking
- North Korea
- Overbought Markets
- Picture of the Day
- PIIGS
- PMIs
- Policy
- Politics
- Population
- Populism
- Poverty
- President Trump
- Qunat Strategies
- Quote of the Day
- Quotes
- Rare Earth Elements
- Readership
- Reads
- Real Estate
- Relative Strength Index
- Robert Shiller
- RSIs
- S&P500
- Sector ETF Peformance
- Semiconductor prices
- Semiconductors
- Social Media
- Socialism
- Song for the Week
- Sovereign Debt
- Sovereign Risk
- Spain
- Sports
- State and Local Government
- Tail Risk
- Technical Analysis
- Technology
- The Big Reset
- The Weekend Read
- This Day In Financial History
- Trade War
- Trades
- Tweet of the Day
- Ugly Chart Contest
- Uncategorized
- US Releases
- Video
- Volatility
- Wages
- Week Ahead
- Week in Review
- Weekend Reads
- Weekly Eurozone Watch
- Whales
-
Recent Posts
Meta
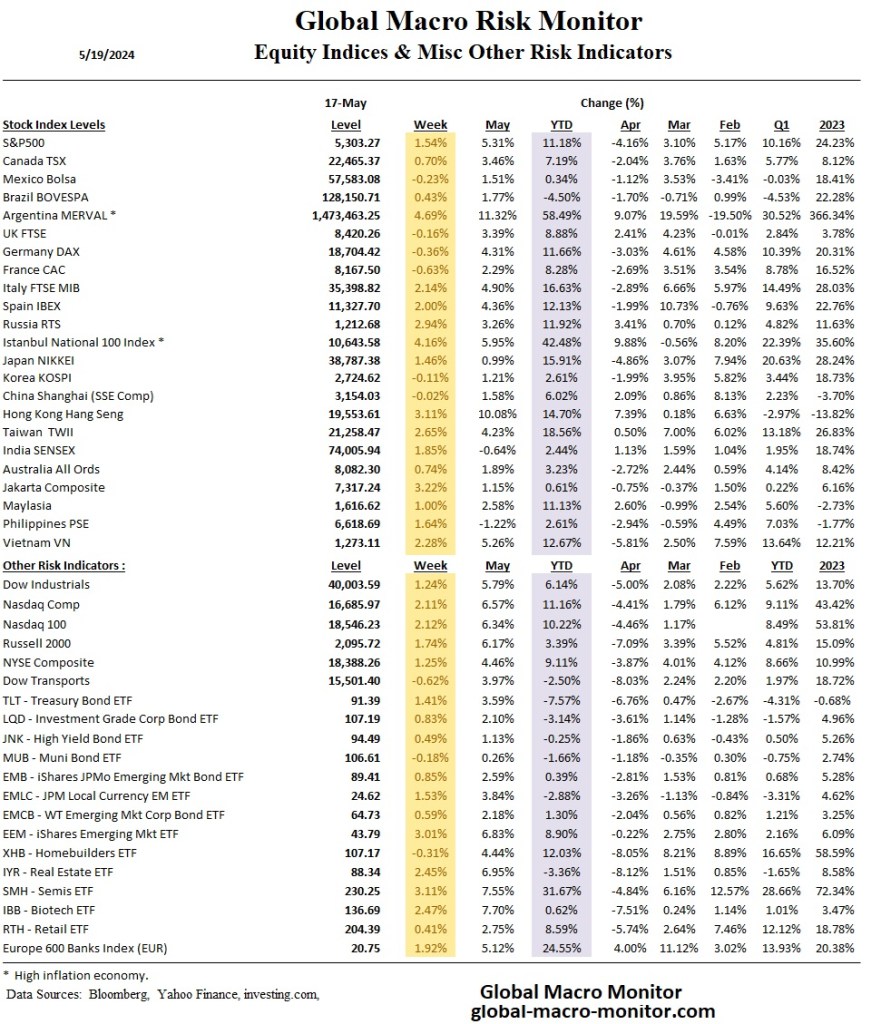
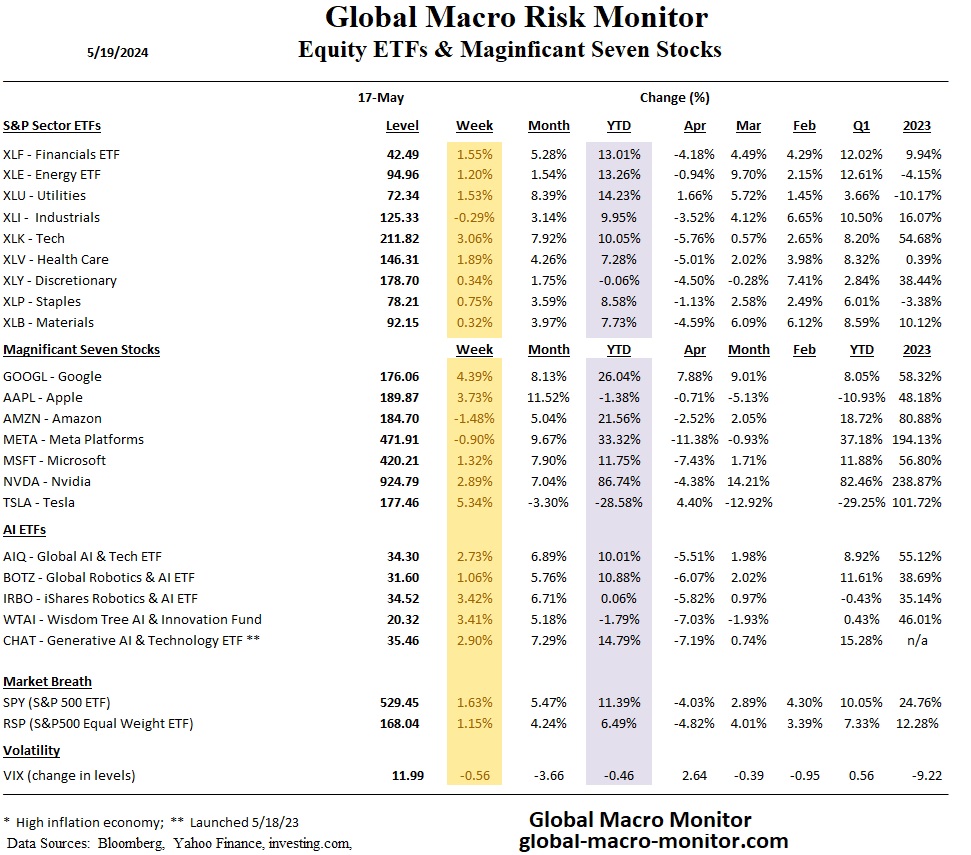
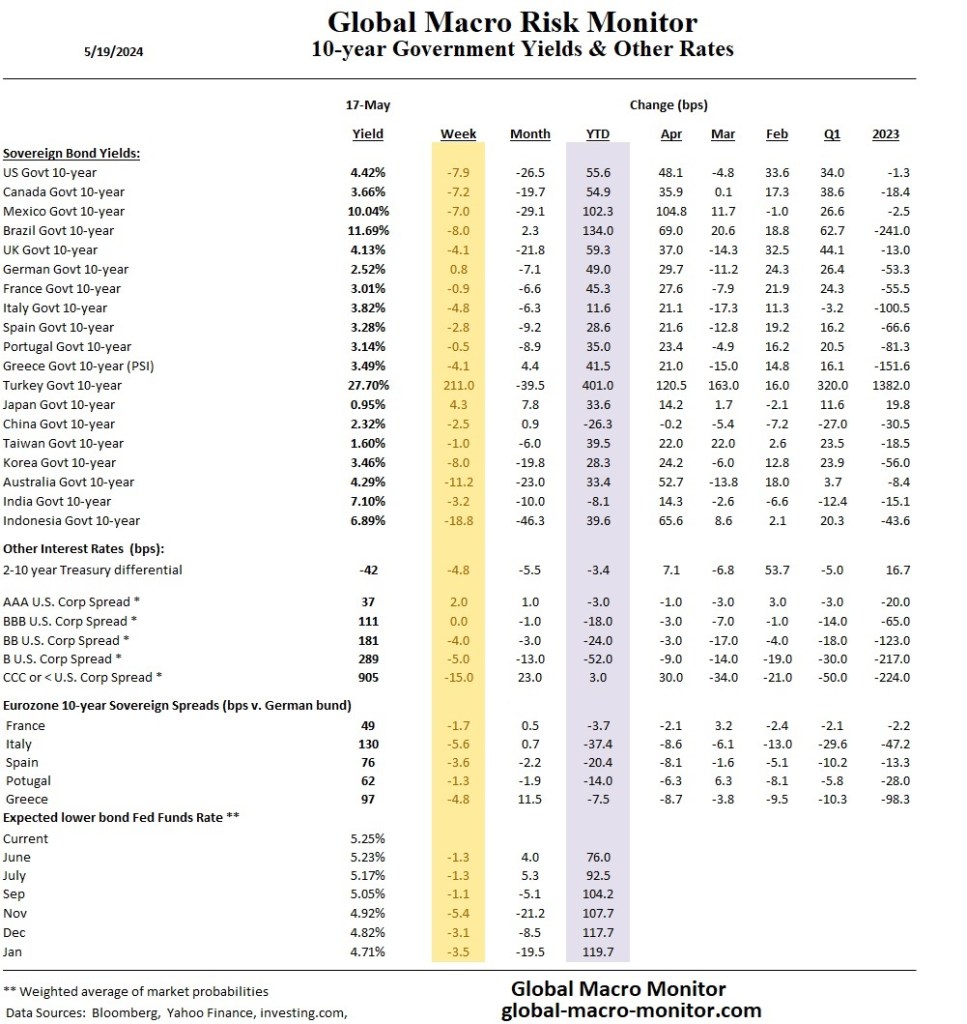
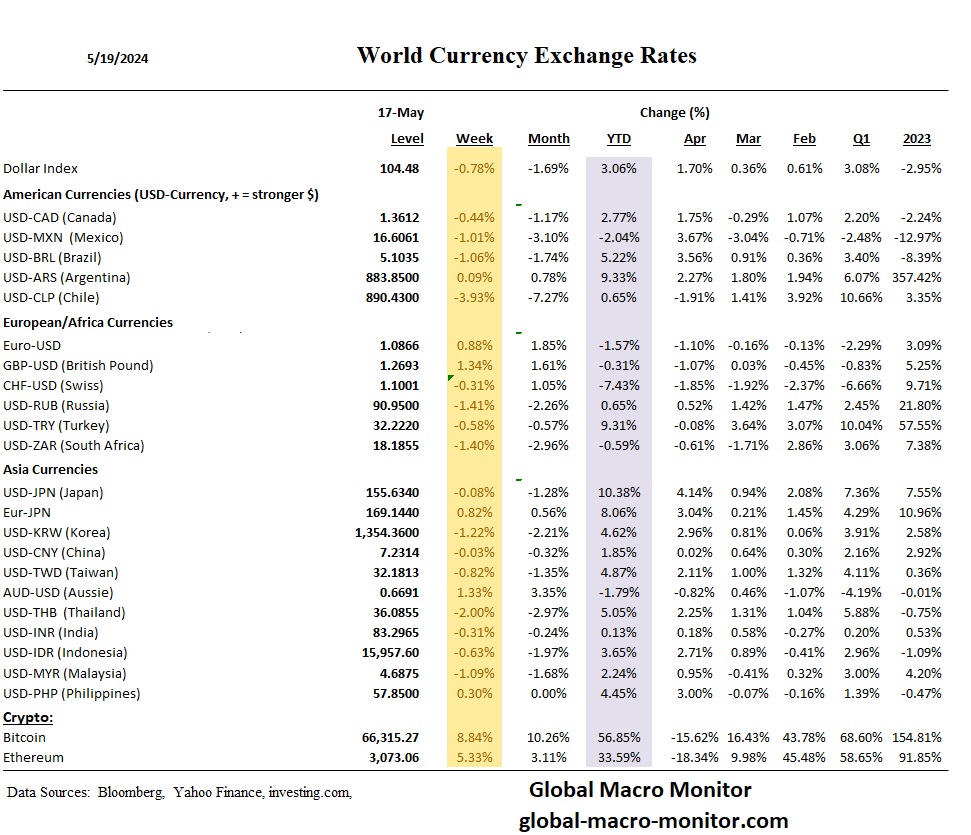
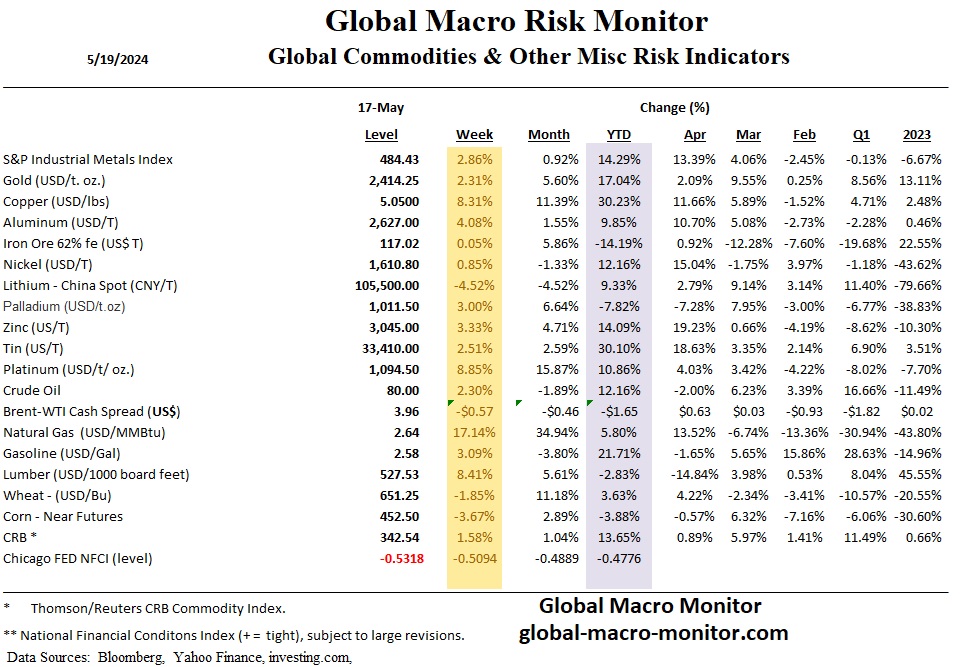
Global Risk Monitor: Week In Review – May 24
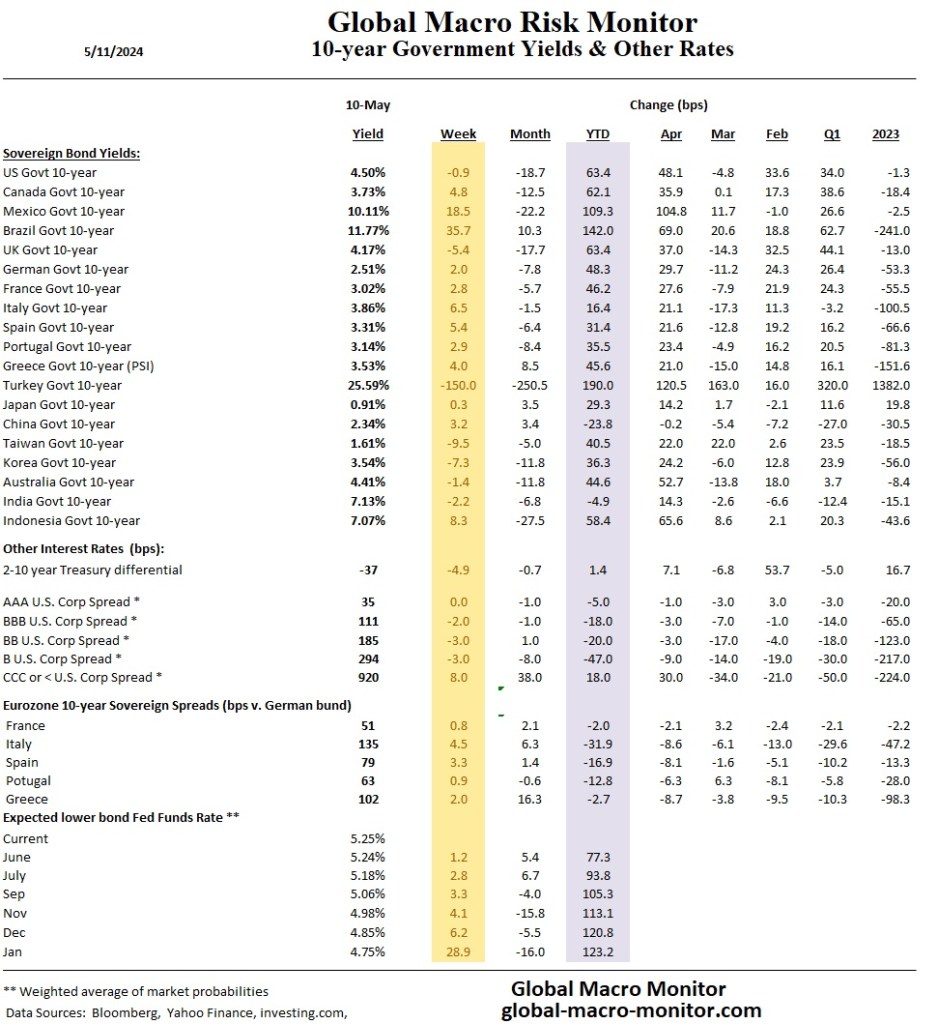
According to the Chicago Fed’s National Financial Conditions Index (NFCI), national financial conditions have eased significantly. Financial conditions are looser than when the Fed began its tightening cycle in March 2022, with the NFCI at levels last seen in November 2021.
It is not inconsequential the market has put rate hikes back on the table, albeit with a low probability. However, if risk markets continue to rally, the Fed may be compelled to respond with another rate hike.


Global Risk Monitor: Week In Review – May 17
National financial conditions have eased significantly in May, making it more difficult for the Fed to start an easing cycle. Does Mr. Market understand the unstable feedback loop it is currently in? Just askin’.

Posted in Uncategorized
1 Comment
OpenAI’s ChatGPT-4o Spring Update Event: Everything Revealed in 2 Minutes
Posted in Uncategorized
Leave a comment
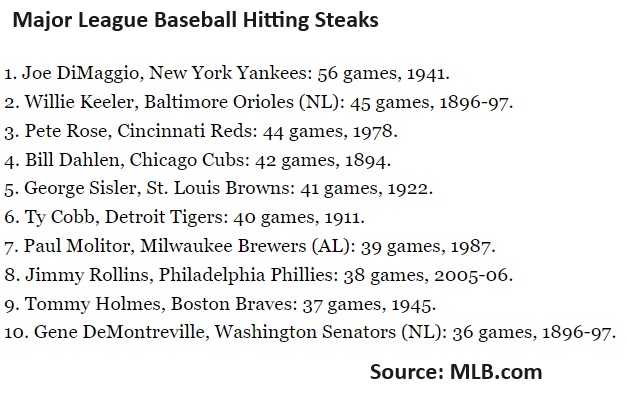
The Dow(maggio) Jones Hitting Streak
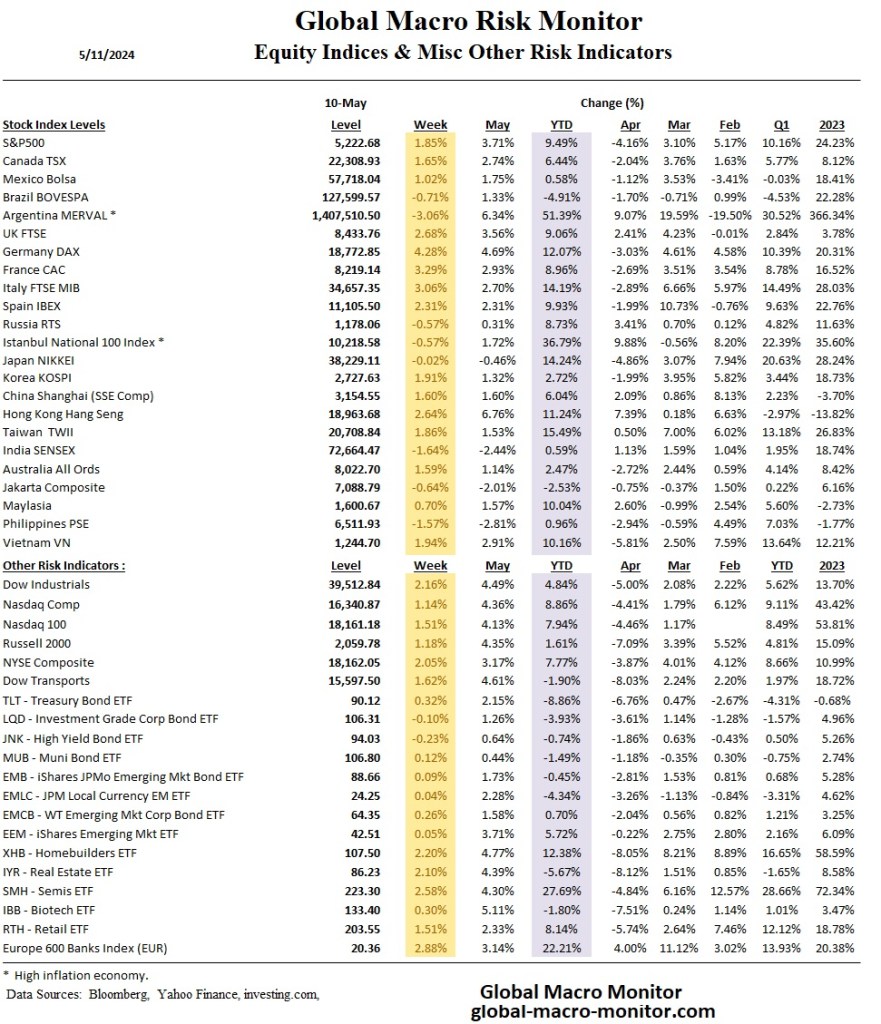
Wednesday will mark the 83rd anniversary of the start of Joe DiMaggio’s 56-game hitting streak—a record that remains unchallenged in baseball. Similarly, the stock market has exhibited its own streakiness recently, with the Dow Jones Industrial Average closing in the green last Friday, extending its winning streak to eight consecutive days.
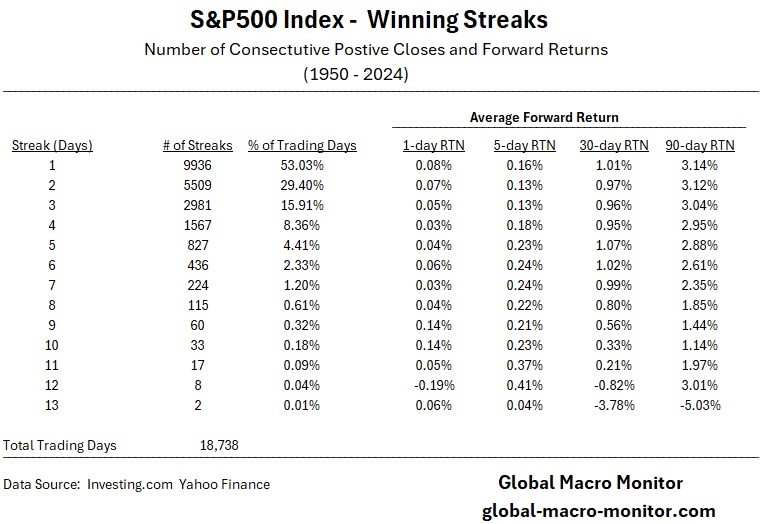
Streaky Markets
We find it noteworthy that it has been only 13 trading days since we posted our analysis, “S&P 500 – Will the 20-week MA Hold After Six Straight Down Days?” In that piece, we provided an in-depth look at losing streaks, noting the rarity of such occurrences. For instance, since 1950, the S&P 500 has only registered a 6-day losing streak in 1 percent of the trading days, and just 0.42 percent since 2000.
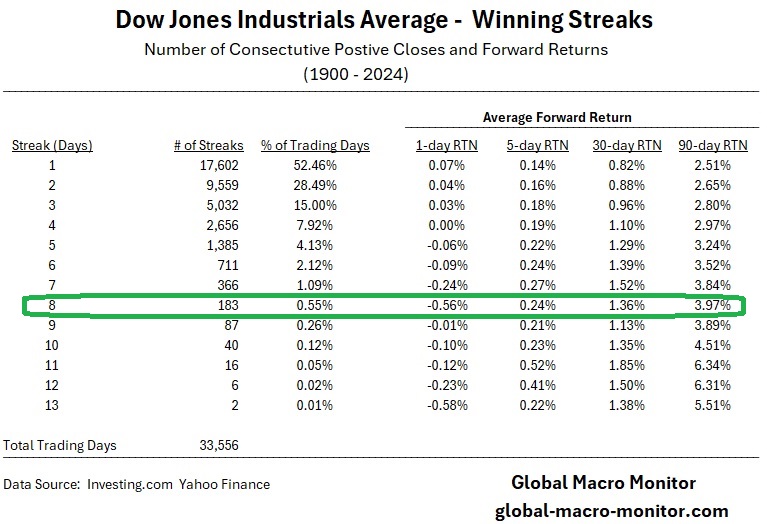
Dow Streaks
The table below illustrates that the Dow Jones Industrial Average has experienced an 8-day winning streak on only 183 occasions since 1900, which represents just 0.55 percent of the over 33,000 trading days. Our data indicate that the Dow typically closes lower the following day, demonstrating a regression to the mean.
House/Market Odds
It’s interesting to note that the Dow and S&P 500 generate a positive daily return 52.46 percent and 53.03 percent of the time, respectively. These odds are roughly equivalent to the casino’s advantage when betting it all on black or red in roulette. Betting against the market—or the house—never pays in the long run.
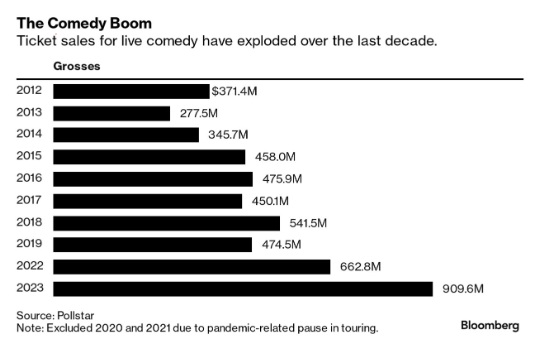
COTD: Laughing All The Way To The Bank
COTD = Chart of the Day
Stand-up comedy grosses have nearly tripled over the last decade, climbing to more than $900 million last year, according to Pollstar. – Bloomberg
Posted in Uncategorized
Leave a comment
