Let’s face it folks global markets have turned into the Truman Show.
In other words, much, if not, everything is pretty much fake. An artificial housing recovery based on repressed interest rates and the effective nationalism of the mortgage market and an artificial stock market rally based on quantitative easing. The artificial wealth is, once again, creating, albeit just barely, fake and temporary demand.
Most of the private sector, twice burned by the stock and housing bubbles, can see right through it and refuse to expand capacity. Witness tepid economic growth, at best, even with the enormous fiscal and monetary stimulus.
Did you ever think in your wildest imagination that the printing money would become virtuous? That in our zero interest rate world one of the fast growing group of millionaires would be retired government workers with defined benefit pensions (present value of retirement payments)?
So with that introduction and Anne Hathaway taking home the Oscar tonight for best actress in a supporting role we repost a piece from a few years back.
*******************************************************************************
Does Anne Hathaway Drive Berkshire Stock?
We posted last October our suspicions that algo/robo traders were driving the almost tick-for-tick correlation between the Australian dollar and the S&P500. Remember those days of great fun?

 Now, the Atlantic suspects that algorithms may, and we stress may, have been written and programmed to buy Berkshire Hathaway (BRK-A) stock when Anne Hathaway is mentioned in the news! Alexis Madrigal of The Atlantic writes,
A couple weeks ago, Huffington Post blogger Dan Mervish noted a funny trend: when Anne Hathaway was in the news, Warren Buffett’s Berkshire Hathaway’s shares went up. He pointed to six dates going back to 2008 to show the correlation. Mervish then suggested a mechanism to explain the trend: “automated, robotic trading programming are picking up the same chatter on the Internet about ‘Hathaway’ as the IMDb’s StarMeter, and they’re applying it to the stock market.”
The idea seems ridiculous. But the more I thought about the strange behavior of algorithmic trading systems and the news that Twitter sentiment analysis could be used by stock market analysts and the fact that many computer programs are simply looking for tradeable correlations, I really started to wonder if Mervish’s theory was plausible.
Madrigal checked in with John Bates, former Cambridge computer whiz whose company Progress Software writes algo strategies for hedge funds to ask, “Is this at all possible? Bates, to his surprise, answered “Maybe.”
We come across all sorts of strange things in our line of business, strange correlations,” Bates told me. “And I’ve had a lot of interest in this for a long time because it’s really often the secret source for certain hedge funds.”
Companies are trying to “correlate everything against everything,” he explained, and if they find something that they think will work time and again, they’ll try it out. The interesting, thing, though, is that it’s all statistics, removed from the real world. It’s not as if a hedge fund’s computers would spit the trading strategy as a sentence: “When Hathway news increases, buy Berkshire Hathaway.” In fact, traders won’t always know why their algorithms are doing what they’re doing. They just see that it’s found some correlation and it’s betting on Buffett’s company.
Algo/robo trading appears to becoming not only more bizarre, desperate and reaching the level of the absurd. Imagine a program, for example, written to sell 10K S&P500 futures contracts in illiquid market on the news of a report of a butterfly flapping its wings at home plate at Wrigley Field momentarily interrupting a Cubs game. The selling drives the index down 2 percent. Another program written to sell several thousand contracts when the index moves down 2 percent in, say, a 45 second time period then kicks in, driving the index down another 3 percent. Several thousand other programs are written to sell several thousand more contracts when the market is down 5 percent. A tornado on Wall Street set off by the flapping of a butterfly’s wings in Chicago? Hey, don’t entirely discount such a scenario. This is probably not far from what happened during last year’s “Robots Gone Wild” flash crash which was kicked off by the bank burning Greek riots.
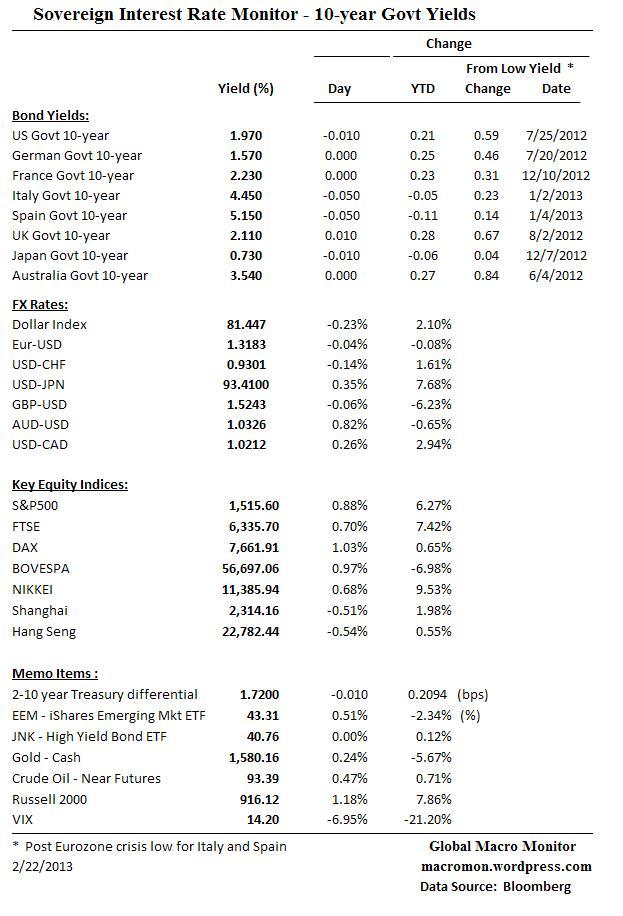
At least we have some theories behind our correlations, such as the Hang Seng as an indicator species for global risk appetite. And we did make some money once buying Callaway (ELY), the proud sponsor of Phil Mickelson, the Friday before he won his first Masters.
But good luck trying to trade against this type of nonsense. We also wonder if the robot has been reprogrammed to sell rather than buy Nike (NKE) after Tiger’s downfall when he is now mentioned in the news. As they say on the newly paved Street, just go with the flow algo!
**********************************************************************************
Welcome to the Truman Show! Someday Truman is going to find out he lives in a fake world. Won’t that be fun?
(click here if table and picture are not observable)