Euro testing key support

The Euro$ is sitting right on top of its 200-day moving average at 1.28237.   The chart shows this is an important level as it has provided support over the past few months and once breached usually leads to sustained weakness.

Note in September 2011 the Euro pierced its 200-day at 1.40 and, after a brief spike above the 200-day in November,  the currency traded down almost 15 percent before bottoming in late July.  Clearly,  policy uncertainty and Eurozone financial instability were key drivers in the Euro’s collapse, but the breach of the 200-day did signal all was not well.

We have no direct skin in the game but are watching closely how the Euro trades around this key support level.    We suspect the outcome of Tuesday’s U.S. presidential election may impact its short-term direction.  A Romney win leads to a stronger dollar/weaker euro and vis-versa, on the margin, if the President is reelected.  Oh, and don’t forget,   Greece is the word.

(click here if chart is not observable)

Posted in Currency, Euro | Tagged , | 1 Comment

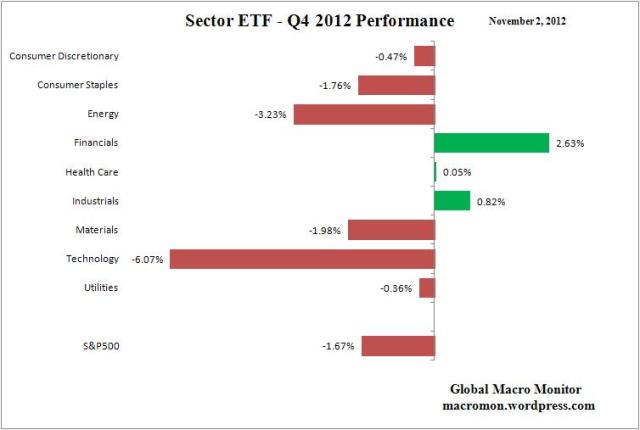
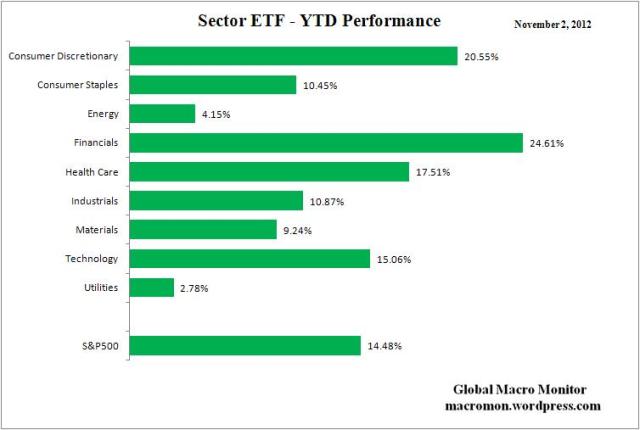
U.S. Equity Sector ETF Performance

(click here if charts are not observable)

Posted in Equities, Sector ETF Peformance | Tagged , , , , , , | Leave a comment

Bears Breach Apple’s 200-day

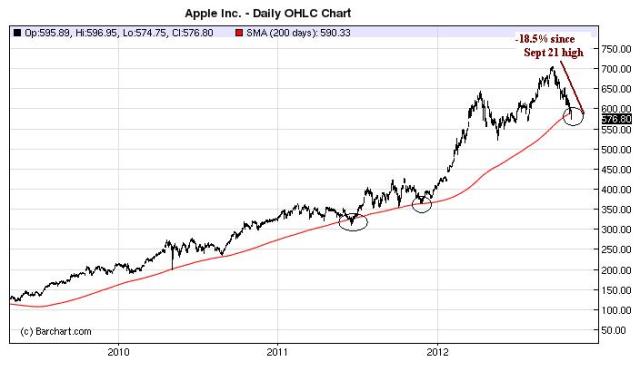
We posted yesterday how important Apple’s 200-day moving average is/was.

We noted, “It’s been the dike that has kept the Bear Sea at bay ,” since the bull run started in March 2009.   Here’s an excerpt,

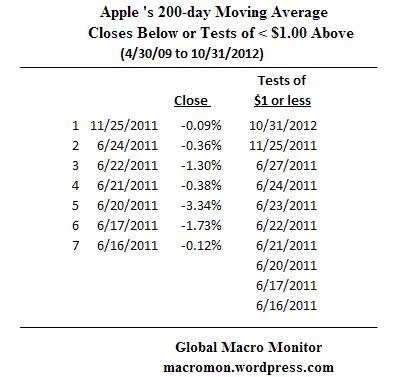
Apple’s stock managed an impressive bounce off the its 200-day moving average yesterday.  It was the first time the stock has come within $1.00 of the 200-day since November 2011 and only the third time in the past three years. *

In fact,  AAPL has only moved below its 200-day moving average twice since the crash lows, closing only seven times under the 200-day since it crossed over in early April 2009.  Of those, six took place in the June 2011 streak.

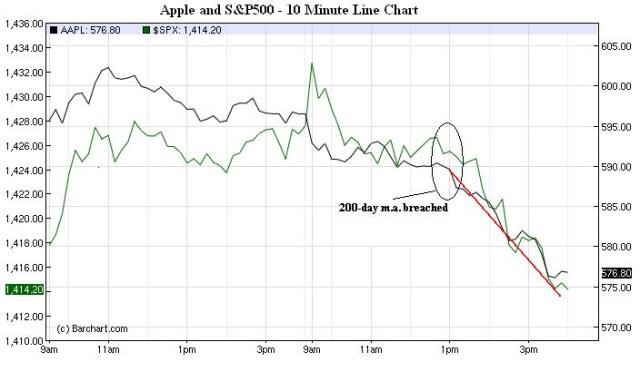
Today, for the first time since last November,  Apple’s stock closed below its 200-day moving average.    The breach at around 1 pm eastern took the rest of the equity market with it (see chart).

Where now?

Wish we knew, but it’s unlikely, in our opinion, we have the V bottom that took place  last November, when the stock spent only one day under the 200-day.   The concerns about innovation and whether the company has jumped the shark with the iPad mini are more structural and, seems to us,  need some time to be resolved in investors minds.

The stock is still up huge for the year with a Jackie Robinson-esque return of 42.42% and could face capital gains selling if the President is reelected on Tuesday.  It’s also unlikely traders will step in to catch the falling knife until the stock stabilizes and moves back and closes decisively above the 200-day.

We can’t recall the last time Apple has been this oversold with a 20 handle RSI.  This would be an opportune time for Apple to put some of its $100 billion plus cash to work to help stabilize the stock.   Get with it,  T.C.!

We could be wrong and always remain flexible.    Stay tuned.

(click here if charts are not observable)

Posted in Apple | Tagged , , | Leave a comment

Weekly Eurozone Watch

Key Data Points
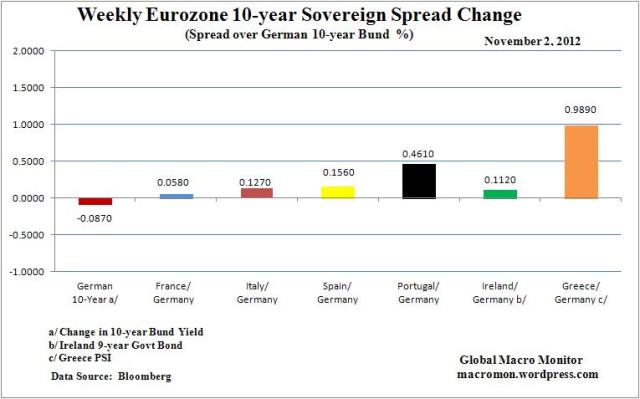
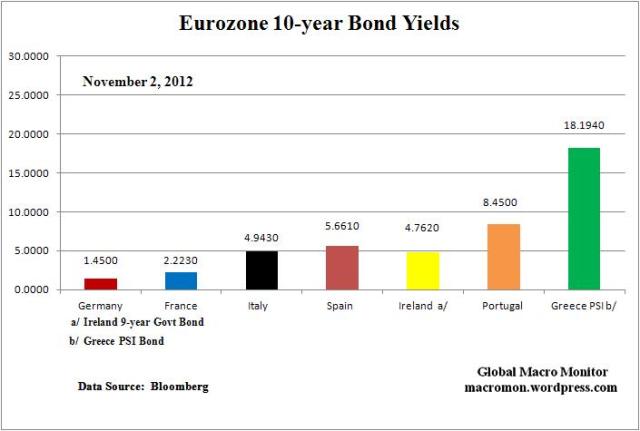
German 10-year Bund 9 bps lower;
France 10-year 6 bps wider to the Bund;
Italy 13 bps wider;
Spain 16 bps wider;
Portugal  46 bps wider;
Ireland 6 bps wider;
Greece 99 bps wider;
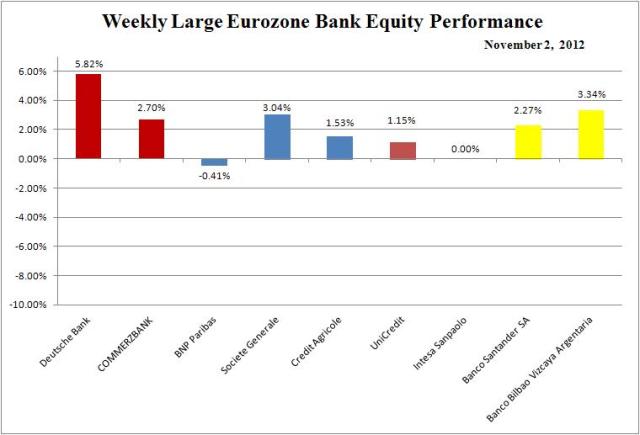
Large Eurozone banks up 0-5 percent;
Euro$ down 0.66 percent.

Comments
Growing fears Greece  unlikely to pass €13.5bn reform package needed to unleash EU aid;
Eurozone unemployment rate hits record high at 11.6% with 18.5m people out of work;  Italy sold 10 year bonds at a yield of4.92%, the lowest since May 2011.

For Germany, economics is a branch of moral philosophy. Growth is the prize for ethical behaviour. On the part of the individual – by saving – and on the part of the group – through budgetary equilibrium.
– Mario Monti, Italian Prime Minister

(click here if charts are not observable)

Posted in Weekly Eurozone Watch | Tagged , , , , , , | 1 Comment

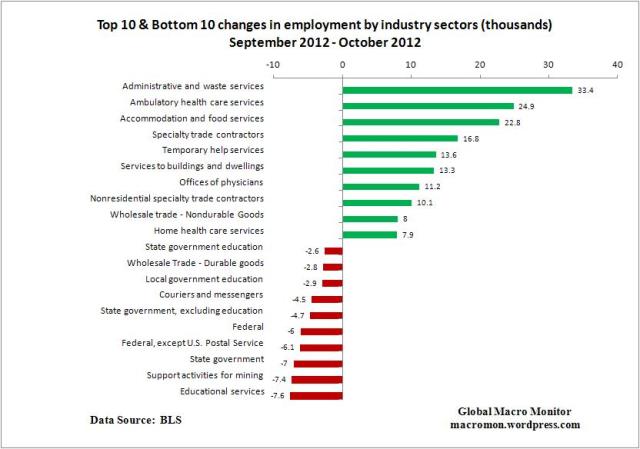
Which industry sectors created new jobs and suffered losses?

Nice breakdown on where the jobs were created and lost in October.   The chart illustrates the top 10 sectors with the largest job creation and the bottom 10, which experienced the most losses.   Good to see construction as reflected in the specialty contractors coming back a little.

(click here if chart is not observable)
Posted in Employment | Tagged , , | Leave a comment

U.S. Employment Situation – October 2012

The BLS reported this morning,

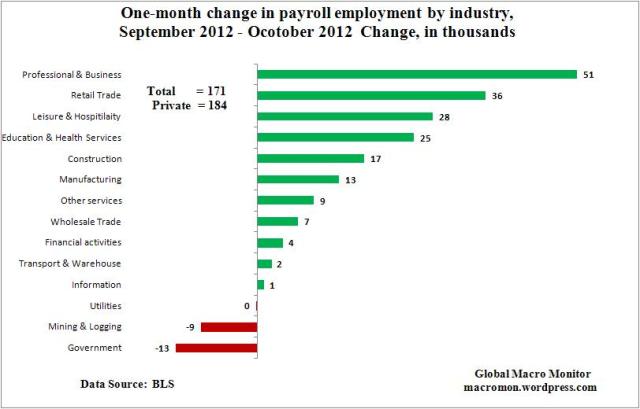
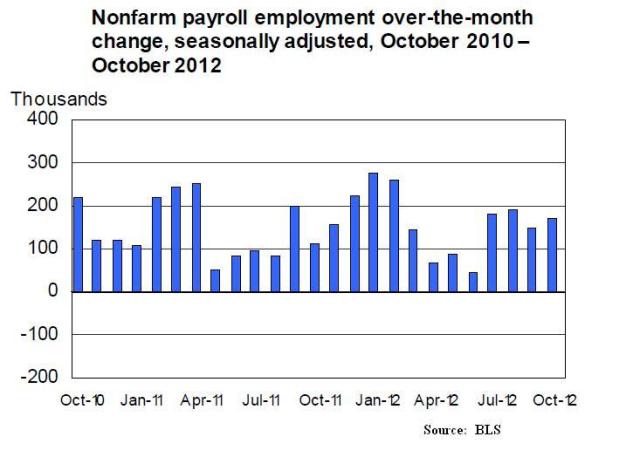
Total nonfarm payroll employment increased by171,000 in October, and the unemployment rate was essentially unchanged at 7.9 percent, the U.S. Bureau of Labor Statistics reported today. Employment rose in professional and business services, health care, and retail trade.

Click here for the October Employment Situation post.

(click here if charts are not observable)

Posted in Employment | Tagged , , | 2 Comments

How Important is Apple’s 200-day moving average?

Very.  It’s been the dike that has kept the Bear Sea at bay. 

Apple’s stock managed an impressive bounce off the its 200-day moving average yesterday.  It was the first time the stock has come within $1.00 of the 200-day since November 2011 and only the third time in the past three years. *

In fact,  AAPL has only moved below its 200-day moving average twice sense the crash lows, closing only seven times under the 200-day since it crossed over in early April 2009.  Of those, six took place in the June 2011 streak.

The stock continues to trade poorly and can’t seem to hold a bid. We sense the size and over ownership of Apple limits new buyers and traders are looking for a new catalyst to jump back in.   We’re watching the 200-day like a hawk.   Keep it on your radar.

Stay tuned.

*  Only including one observation from the streak of closes below the 200-day in June 2011.

(click here if chart is not observable)
Posted in Apple | Tagged , | 3 Comments

Portugal passes fresh tax hikes

Portugal’s parliament has passed the country’s largest tax hike package in decades.

The changes form part of Prime Minister Pedro Passos Coelho’s new 2013 budget programme.

Lisbon has to meet targets set by a 78-billion-euro bailout agreement with the EU and IMF.

(click here if video is not observable)

Posted in Euro, Eurozone Sovereign Spreads, Fiscal Policy | Tagged , , | Leave a comment

Quote of the Day: Hamburger Capital Management

We know all about grinding up capital in a choppy market!

High levels of cash continue to be my position in this current market. Don’t overtrade sloppy markets.
– Dan Zanger
,  on StockTwits,  Oct 31, 2012

Posted in Quotes | Tagged , , | Leave a comment

What to Expect When You’re Electing

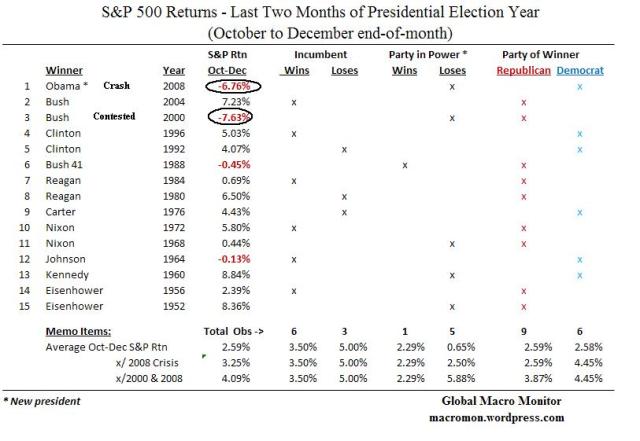
Interesting data on S&P500 returns during the last two months of a presidential election year.

We looked at the last fifteen presidential elections beginning with the 1952 election of President Eisenhower.   With the exception of the swan elections of 2008, which took place during the financial collapse, and the contested of election of 2000, stocks have behaved very well in the last two months of the year.

For example, the average return for S&P500 in the last two months for all fifteen election years, including 2008’s -6.76 percent and -7.63 percent in 2000, is 2.59 percent.  Excluding 2008 the S&P500 returned 3.25 percent and removing both swan years, 2008 and 2000, the S&P returned an impressive average return of 4.09 percent.

The table below also shows that six presidents won reelection and three lost.  During the years when an incumbent won reelection, the S&P500 returned on average 3.5 percent and 5.0 percent when the challenger won.

Only one in six elections did the incumbent party win the White House when an incumbent president was not in the race.  Nine Republicans and six Democrats have won presidential elections since 1952 with the S&P500 performing fairly similar for both parties.

Given how close this election appears to be there is tail risk of a contested election, which would collide with the fiscal cliff resulting in a disaster for U.S. stocks, in our opinion.  That risk remains until the uncertainty is removed when polls close on November 6th.

We maintain the view that stocks rip higher with a decisive Romney victory, especially given the conventional wisdom (Intrade) is that the President wins reelection.   Not a political statement and history, as reflected in the table below,  does confirm our view — 5 percent average return for the S&P500 when the challenger defeats an incumbent president.   Given no Black Swans, of course!

Stay tuned!

(click here if table is not observable)

Posted in Politics | Tagged , | 1 Comment