Apple’s End-of-Month Window Dressing

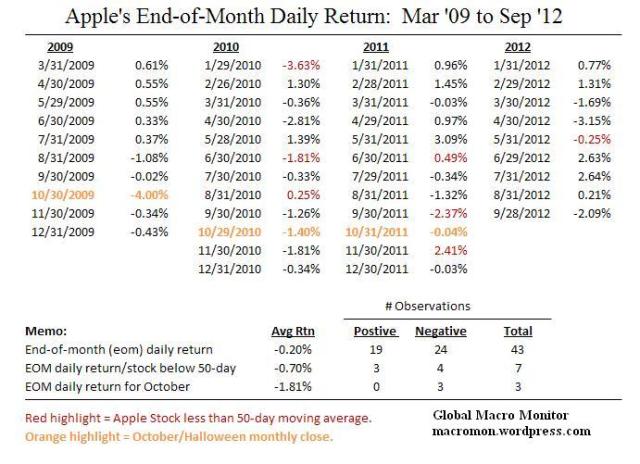
Interesting data on Apple’s end-of-month (eom) daily returns since the March 2009 crash bottom.  Our priors are that every PM and their mother would be buying Apple at the end the month to show they own it as the stock has returned a stunning 477 percent since March 31, 2009.

Not true, however.

Of the 43 eom observations since March 2009, the stock has traded down 24 days and up only 19 with an average return of -0.20 percent.   Controlling for when the stock is trading below its 50-day moving average, as it now is,   Apple has been down 4 out of the 7 observations for an average return of -0.70 percent.

The stock has closed lower each of the last trading days in October for past three years.   Also interesting the negative daily eom returns tend to run in streaks.  That is,  negative daily eom closes usually follow another.

Will this be the case tomorrow?   Wish it were that easy.

Unfortunately,  we don’t have data points to control for a 2-day stock market closure due to weather and for such a huge management shake-up which took place yesterday.

It’s hard to see any positive catalyst for the stock in the near term x/ a trading bounce and consolidation after the 15 percent sell-off.  Apple, in our opinion,  needs to prove it hasn’t jumped the shark with the iPad mini by coming out with a new innovative product to show the spirit of Steve Jobs still is alive and well at the Curperino HQ.

Going to be an interesting trading day tomorrow.   Stay tuned.
(click here if table is not observable)
Posted in Apple | Tagged , , | Leave a comment

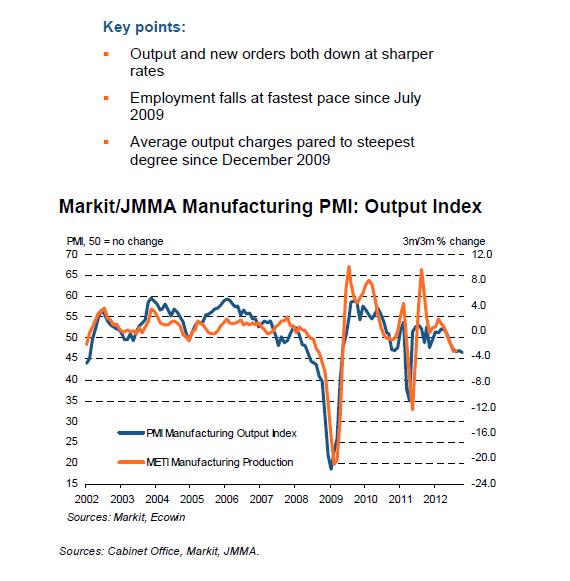
Japan PMI falls to 46.9, 18-month low

Markit’s press release on Japan’s October manufacturing PMI,

Commenting on the Japanese Manufacturing PMI survey data, Paul Smith, Senior Economist at Markit and author of the report said:
“The fall back in the headline PMI to an 18-month low during October was disappointing in the context of last month’s slight rise. Latest survey data are consistent with manufacturing production contracting at a quarterly rate of just over -3%.

“Sub-par industry performance continues to be closely linked with underlying export weakness. Based on a historical comparison with PMI data, overseas shipments are estimated to have fallen at a quarterly pace of close to -4% in October, as global growth remains sluggish, particularly in key export markets such as China.

“The continuation of the soft patch that has been evident in the second half of the year in 2012 so far has also now spilt over into the labour market. Manufacturers cut jobs for the first time in six months during October – and at the sharpest pace since mid 2009.”

(click here if chart is not observable)

Posted in Economics, Japan, PMIs | Tagged , , | Leave a comment

Global Trend Indicators

(click here if tables are not observable)

Posted in Global Trend Indicators | Tagged , , | Leave a comment

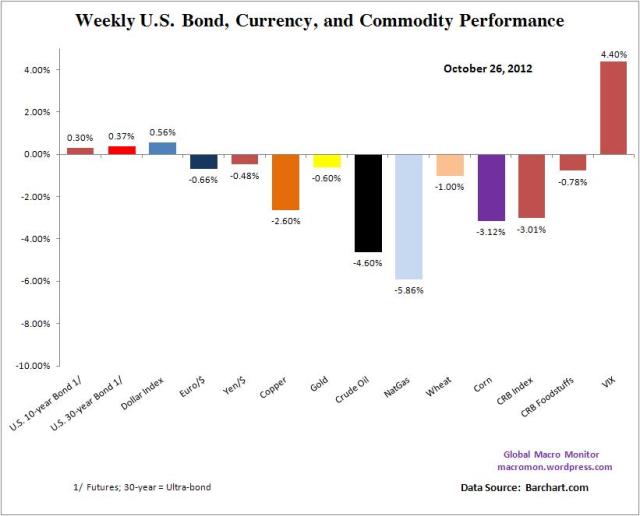
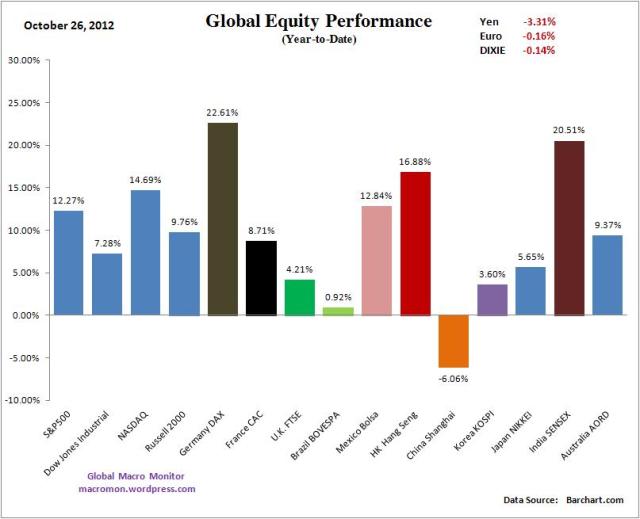
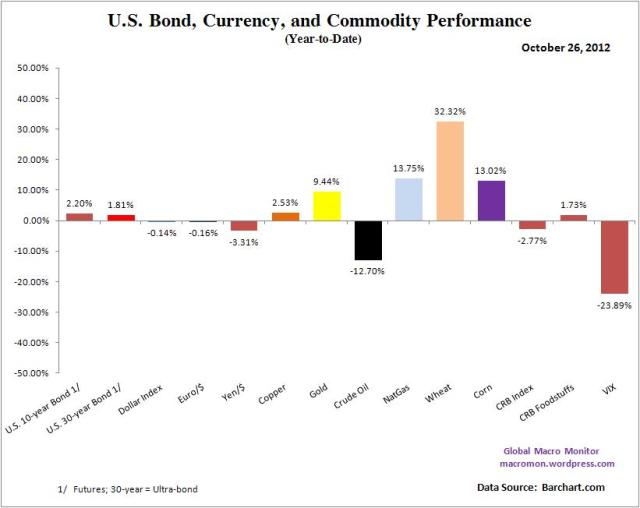
Week in Review

(click here if charts are not observable)

Posted in Week in Review | Tagged , , , , , , , | Leave a comment

Hugh Hendry and David Einhorn at the Buttonwood Gathering

Spend some time over the weekend listening to Hugh Hendry and David Einhorn, who were participating in the Economist’s Buttonwood Gathering this week.

Nice to hear from some non-cheerleaders.   Smart and provocative.

Hendry is very bearish on the creditor nations of Asia — China and Japan.  Money quotes:

We are in the death spiral of mercantilism…

The creditor nations in Asia have to short their own currencies…My fear, at the end, you get a short squeeze…

I go to Japan…It’s hard to believe equities and properties have fallen 80 percent over the past twenty years…

The impossible is happening today in Japan. Some of the largest Japanese corporates are on the verge of bankruptcy…

Sandwiched between Hendry and Einhorn is a great discussion on China.

Greg Ip interviews David Einhorn about 56 minutes into the video.  Einhorn is very critical — as we are — of current U.S. monetary policy.  Money quotes,

…We at the point where incremental easing is slowing down the recovery…

…the lower rates drive up the cost of commodities… it takes income out of people’s pockets…

…not being able to earn a safe return on savings is causing people to hoard savings rather than consume…

Click here for full interview

Right on, David.

(click here if pictures are not observable)

Posted in Monetary Policy, Whales | Tagged , , , , , | 1 Comment

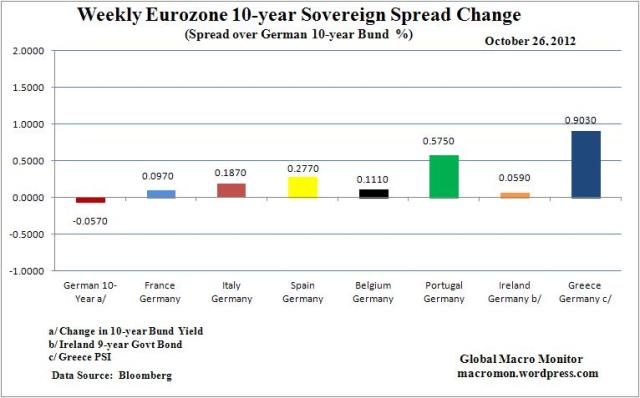
Weekly Eurozone Watch

Key Data Points
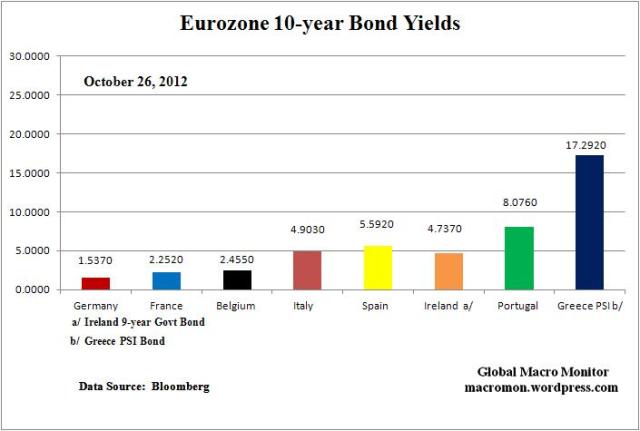
German 10-year Bund 6 bps lower;
France 10-year 10 bps wider to the Bund;
Italy  19 bps wider;
Spain 28 bps wider;
Belgium 11 bps wider;
Portugal  56 bps wider;
Ireland 6 bps wider;
Greece 93 bps tighter;
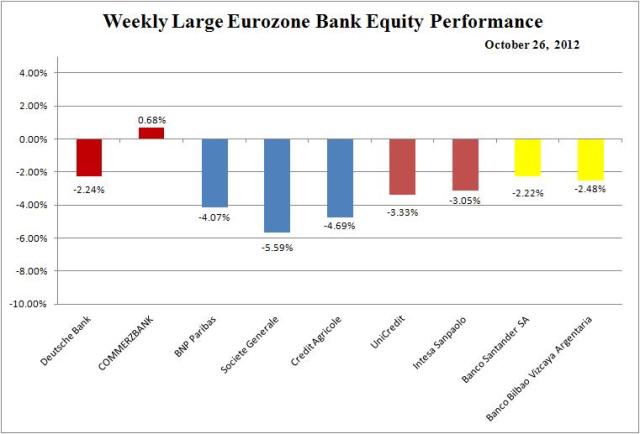
Large Eurozone banks down 0-5 percent;
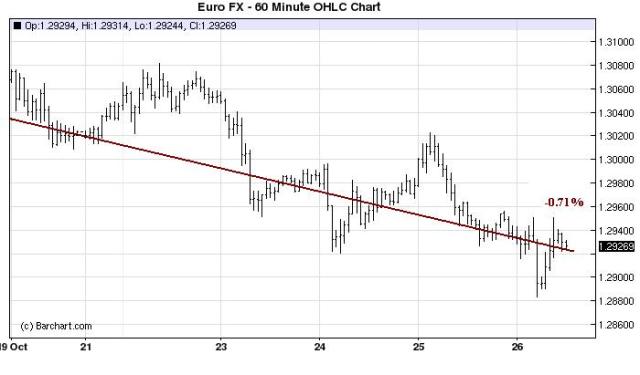
Euro$ down 0.71 percent.

Comments
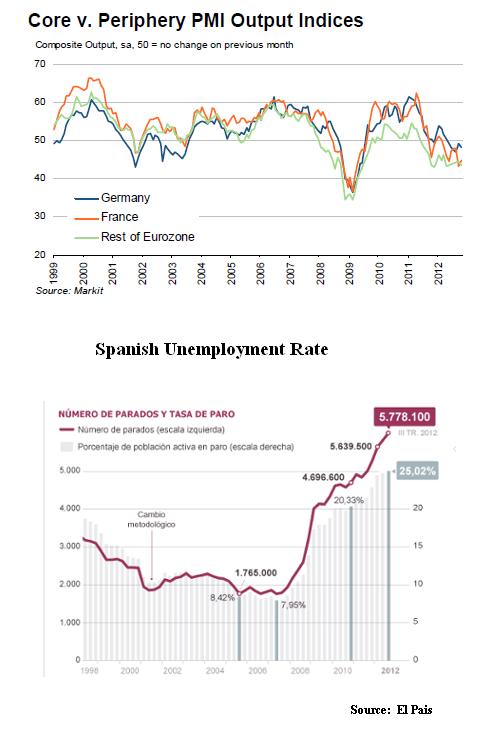
Eurozone PMI hits 40-month low;
Spain’s unemployment rate hits record high, over 25%;
German consumer confidence at five-year high;
Standard & Poor’s downgraded BNP Paribas and changed the outlook to negative for several French banks, including Société Générale and Crédit Agricole;
The Euro Working Group (EWG) of eurozone finance ministry officials will meet Monday to review the country’s aid package;
Silvio Berlusconi, Italy’s former prime minister, sentenced to four years in prison;

Source:  FT & Guardian

(click here if charts are not observable)

Posted in Weekly Eurozone Watch | Tagged , , , , , | 4 Comments

Apple Misses, Guides Lower

Apple comes in a little light at $8.67, up from $7.05 in fiscal Q4 2011.  The EPS missed estimates of $8.75.  The stock was  trading down about $10 in AH and did break $600 at one point, but coming back a little.   The stock is down over $100 in last month and it seems to us the 200-day moving average at $586 is a magnet.  Have no idea if it will get there, however.

Apple® today announced financial results for its fiscal 2012 fourth quarter ended September 29, 2012. The Company posted quarterly revenue of $36.0 billion and quarterly net profit of $8.2 billion, or $8.67 per diluted share. These results compare to revenue of $28.3 billion and net profit of $6.6 billion, or $7.05 per diluted share, in the year-ago quarter. Gross margin was 40.0 percent compared to 40.3 percent in the year-ago quarter. International sales accounted for 60 percent of the quarter’s revenue.

The Company sold 26.9 million iPhones in the quarter, representing 58 percent unit growth over the year-ago quarter. Apple sold 14.0 million iPads during the quarter, a 26 percent unit increase over the year-ago quarter. The Company sold 4.9 million Macs during the quarter, a 1 percent unit increase over the year-ago quarter. Apple sold 5.3 million iPods, a 19 percent unit decline from the year-ago quarter.

Apple’s Board of Directors has declared a cash dividend of $2.65 per share of the Company’s common stock. The dividend is payable on November 15, 2012, to shareholders of record as of the close of business on November 12, 2012.

(click here if table is not observable)

Posted in Apple | Tagged , | Leave a comment

European carmakers reduce capacity

http://www.euronews.com/ The carnage continues among carmaker with Ford saying on Thursday that would cut its production capacity in Europe by 18 percent; that is 355,000 vehicles a year.

One day after announcing the closure of its plant at Genk, Belgium Ford says it stop making vans in Britain next year, which angered some workers there.

(click here if video is not observable)

Posted in Euro | Tagged , , , | Leave a comment

Consumer expenditures by homeowners and renters – BLS

Good piece by the BLS of the average annual expenditures of renters and homeowners.

In 2010, people who rented their residences paid more, on average, in annual rent ($8,798) than homeowners reported paying in mortgage interest and charges ($8,202). In the last 25 years, this has only happened twice: in 2010 and in 2004.

For nearly all subcategories of housing, homeowners spent much more on average than renters in 2010. Homeowners ($1,689) paid 20 times more for maintenance, repairs, and insurance than renters ($82), reflecting the direct payment of renters’ maintenance costs by many landlords. Homeowners ($4,314) spent almost twice as much as renters ($2,413) on utilities.

In 2010, homeowners and renters reported different total expenditures, on average, on telephone services ($1,289 and $952, respectively). However, there were some similarities within the telephone services category—homeowners spent $789, on average, on cellular phone service, and renters averaged $704 for the year.

(click here if chart is not observable)

Posted in Economics | Tagged , | Leave a comment

Julian Robertson on CNBC

Maria interviews the “Great One.”    Money quotes,

“I think our economy and some of the things overseas are having a big effect on investors,” Robertson said. “I think right now a lot of very good investors have become so frightened about what’s going on in Europe and Asia and with QE1, QE2 and QE3, they’ve kind of lost their way and are not realizing that there are an awful lot of marvelous companies available at very reasonable prices.”  – CNBC

Click here for full interview

(click here if picture is not observable)

Posted in Video, Whales | Tagged , | Leave a comment