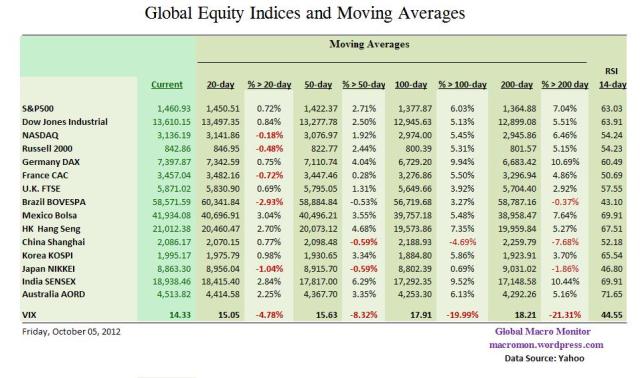
Global Trend Indicators

(click here if tables are not observable)

Posted in Global Trend Indicators | Tagged , , , , , , , | 1 Comment

Euro Fracture: Venice Wants Independence – RT

The Republic of Venice is planning for a glorious comeback. Supporters of Venetian independence from Italy are gathering for a rally to demand the region goes it alone, tired of being saddled with Rome’s austerity. It’s the latest in a number of European regions to consider independence, including Scotland and Catalonia. RT talks to Professor Lodovico Pizzati, who is the chairman of the separatist Indipendenza Veneta party, which has organised the rally.
READ ON http://on.rt.com/vqa4eo

(click here if video is not observable)

Posted in Euro, Geopolitical, Italian Yields | Tagged , , , | 1 Comment

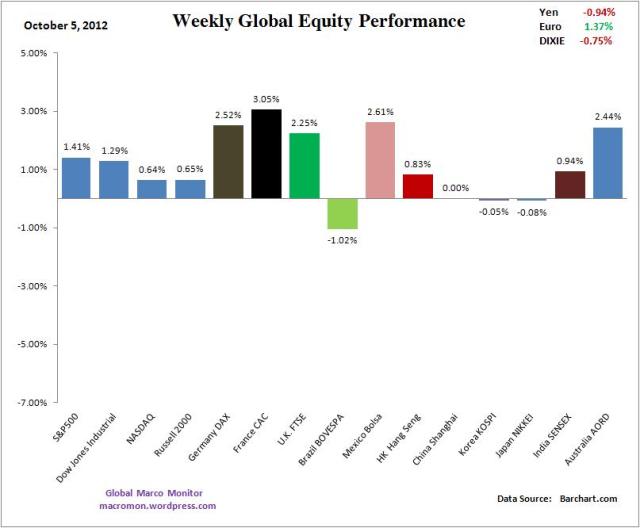
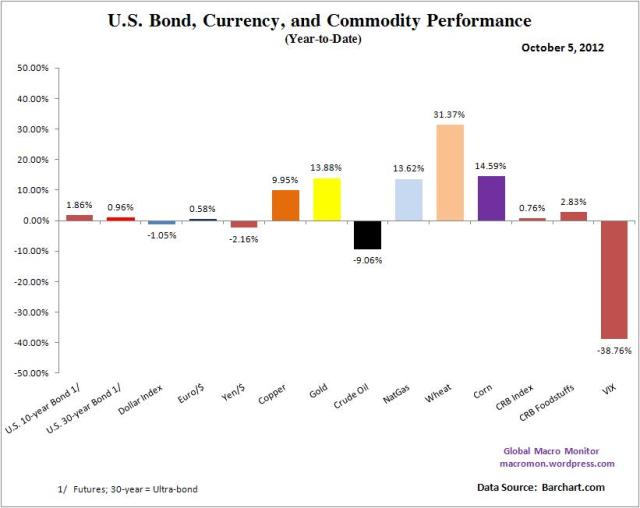
Week in Review

(click here if charts are not observable)

Posted in Week in Review | Tagged , , , , , , , | Leave a comment

Stratfor: Euro Fracture

As the European Union splinters, Stratfor’s Reva Bhalla examines the limits of Continental integration being sought by European policymakers.

For more analysis, visit: http://www.Stratfor.com

(click here if video is not observable)

Posted in Euro, Food Prices, Germany, Sovereign Debt | Tagged , , | Leave a comment

Weekly Eurozone Watch

Key Data Points
German 10-year Bund 8 bps higher;
France 3 bps wider to the Bund;
Italy 10-year 12 bps tighter;
Spain 33  bps tighter;
Portugal 86 bps tighter;
Ireland 17 bps tighter;
Greece 111 bps tighter;
Large Eurozone up down 2-10 percent;
Euro$ up 1.10 percent.

(click here if charts are not observable)

Posted in Weekly Eurozone Watch | Tagged , , , | 1 Comment

U.S. Employment Situation – September 2012

The BLS reported this morning,

The unemployment rate decreased to 7.8 percent in September, and total nonfarm payroll employment rose by 114,000, the U.S. Bureau of Labor Statistics reported today. Employment increased in health care and in transportation and warehousing but changed little in most other major industries.

(click here if charts are not observable)

Posted in Employment | Tagged , , , | 1 Comment

The Hammering of the U.S. Construction Worker

Tomorrow we get another look at the health of the U.S. labor market.

We have posted several pieces about how employment in the construction sector has failed to recover.  Ironically, this is the one sector, which historically, has been most sensitive to monetary policy and interest rates.

The data illustrated in Chart 1 shows that total construction jobs have fallen back to 1996 levels and as a percent of total nonfarm payrolls are now at a point not seen since 1946.  We were surprised at just how small the construction sector is in terms of overall employment,  4.1 percent of total nonfarm payrolls, or 5.5 million construction jobs of the 133 million employed.

Another interesting side note in Chart 1 is that construction as percent of total employment peaked in 1956 at 5.9 percent, the year President Eisenhower’s National Interstate and Defense Highways Act was enacted.   At the time it was the largest public works project in American history.

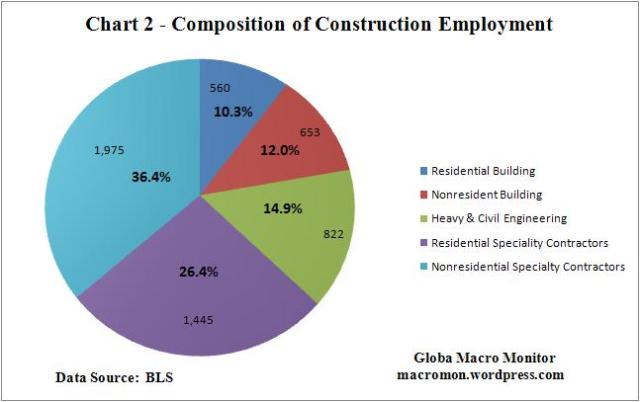
Chart 2 illustrates the composition of the construction labor force.  Almost 63 percent of all construction jobs are specialty trade contractors, which include carpenters, framers, electricians, and plumbers.

Note only about 15 percent of construction workers, 822K, are employed in heavy and civil engineering projects, such as highway and dam construction.   This could be one reason why the stimulus has failed to stimulate jobs (see Chart 4).

There just aren’t enough workers to build bridges to nowhere or Chinese-like ghost cities in order to make a dent in the overall unemployment rate.   Furthermore, our friends in the industry tell us it is not easy to hire in this sector.

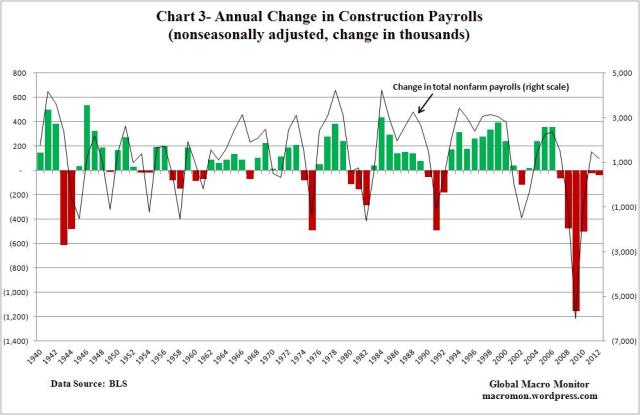
Finally, Chart 3 illustrates just how painful this recession and recovery has been for the construction worker.  On an annual basis, the construction sector has lost a net 2.2 million jobs since the end of 2006 and, though the massive job losses has been stemmed,  has yet to show any signs of meaningful recovery.

Our sense, which is also validated by many studies, is that the official data does not capture the true pain on the downside and may underestimate a recovery due to what takes place in the underground economy.    This is from a report from the Washington state legislature,

The Legislature found “that some current estimates place the percentage of unreported employment in Washington State’s construction industry at between twenty percent and fifty percent, although solid data on this phenomenon is not readily available in Washington.”

Let’s hope QE∞ can lead to some positive prints in construction payrolls and maybe we will get one tomorrow.

But wasn’t the negative real interest rates (i.e., irresponsible monetary policy) of the last decade largely or partly responsible for the housing bubble and its subsequent spectacular bust?   Folks, there has to be better way to generate a more stable and sustainable aggregate demand.    Wash, rinse, repeat.

(click here if charts are not observable)

Posted in Employment | Tagged , , | 3 Comments

Steve Jobs, The Visionary

A year after his death, Steve Jobs’ legacy grows, his impact is still being felt and a newly discovered talk from 1983 speaks to his insightful vision.

(click here if video is not observable)

Posted in Apple | Tagged , | Leave a comment

Quote of the Day: Game Change?

10:29 pm.  How is Obama’s closing statement so fucking sad, confused, and lame?  He choked.  He lost.  He may even have lost the election tonight. –Andrew Sullivan

Posted in Quote of the Day, Uncategorized | Tagged , | 3 Comments

Portugal’s Bond Swap

Interesting swap.  Note Portugal’s 10-year sovereign spread relative to the German bund has come in 423 bps this year.  The 10-year government bond now yields under 9 percent.

(click here if video and chart are not observable)

Posted in Bonds, Euro, PIIGS | Tagged , , | Leave a comment