TR50: The 50 Most Innovative Companies (46-50)

Here are 46-50 and the last of MIT’s Technology Review’s 50 Most Innovative Companies in 2011.  We have been posting in increments of five every few days as not to overwhelm you with info and required reading.

Click here for 1-5 of TR’s most innovative companies of 2011;
Click here for 6-10 of TR’s most innovative companies of 2011;
Click here for 11-15 of TR’s most innovative companies of 2011;
Click here for 16-20 of TR’s most innovative companies of 2011.
Click here for 21-25 of TR’s most innovative companies of 2011.
Click here for 26-30 of TR’s most innovative companies of 2011.
Click here for 31-35 of TR’s most innovative companies of 2011.
Click here for 36-40 of TR’s most innovative companies of 2011.
Click here for 41-45 of TR’s most innovative companies of 2011.

Technology Review uses the following criteria to choose the most innovative companies,

What is a TR50 company?   It is a business whose innovations force other businesses to alter their strategic course. TR50 members are nominated by Technology Review’s editors, who look for companies that over the last year have demonstrated original and valuable technology, are bringing that technology to market at a significant scale, and are clearly influencing their competitors.

46)  Taiwan Semiconductor        (TSM)        
Why:
A manufacturing process ­specifically designed for smart-phone and tablet processors will produce chips that increase computing performance without ­guzzling power.
Key innovation:
Its new materials avoid the leakage of current that saps the energy efficiency of other high-performance processors with very small features.

47)  Twitter           (private)
Why:
Microblogging has become a ubiquitous adjunct to major events, from earthquakes to revolutions.
Key innovation:
A redesigned mobile application encourages users to discover content relevant to them while remaining within the ambit of Twitter rather than turning to third-party systems.

48)  Wildcat Discovery           (private)
Why:
Has used high-speed methods to find materials that improve the performance of batteries.
Key innovation:
Identified a pair of materials that could increase energy density by 25 percent in batteries for cars and portable electronics.

49)  WiTricity      (private)
Why:
WiTricity is making it more convenient to charge electric cars.
Key innovation:
Its system can recharge a battery pack wirelessly.

50)  Zynga       (ZNGA)
Why: 
Social gaming has dramatically expanded the demographic appeal of computer games and created new business models for game companies.
Key innovation: 
Zynga has mastered the art of giving away games and then persuading players to make in-game purchases of virtual goods, sometimes adding up to many times the typical purchase price of a game.

TR – (1-5)
TR – (6-10)
TR – (11-15)
TR – (16-20)
TR – (21-25)
TR – (26-30)
TR – (31-35)
TR – (36-40)
TR – (41-45)

Posted in Innovation, Technology | Tagged , , , , , , | Leave a comment

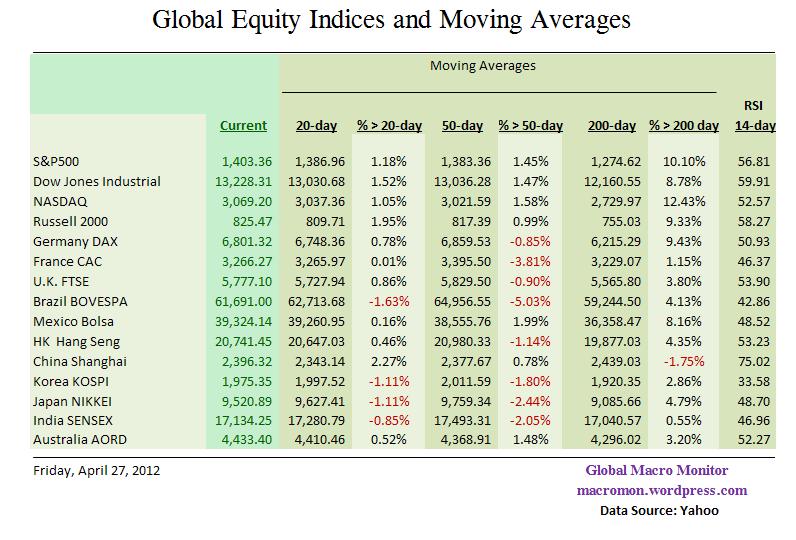
Global Trend Indicators

(click here if tables are not observable)

Posted in Global Trend Indicators | Tagged , , , , , , , , , | 1 Comment

Weekly Eurozone Watch: No Pain From Spain

(click here if charts are not observable)

Posted in Weekly Eurozone Watch | Tagged , , , , , , | 1 Comment

Bernanke in a Romney Fed?

(click here if video is not observable)

Posted in Monetary Policy, Policy, Politics | Tagged , , | Leave a comment

The Jobs Recovery By Industry

Tonight we look at the jobs recovery by various industries.

After 25 months of expansion in the U.S. labor market,  41 percent of the total amount of jobs lost during Great Recession have been recovered.  The private sector has created 4.1 million jobs or about 46 percent of the jobs it shed during the recession.

The table below breaks down how each industry is faring.  The Leisure & Hospitality and Mining industry have recovered all the jobs losses, and then some.  The recovery has produced 1.25 million Professional Service jobs, almost 83 percent of those lost during the recession.

Manufacturing has recovered only 21 percent of jobs losses, financial services 11 percent, retail and wholesale trade around 25 percent,  with construction faring the worst in the private sector, recovering only 1.1 percent of the 1.95 million job lost during the housing bust led recession.   No wonder policymakers are so anxious about a housing market recovery.

Government is in a budget constrained counter-cyclical hiring mode shedding 474k jobs during this  recovery after creating 95K jobs during the recession.   Most of the job losses are at the state and local government level.

More later.   Stay tuned.

(click here if table and chart are not observable)

Posted in Economics, Employment | Tagged , , | 4 Comments

Apple Beats, Up $40 in AH….

Don’t have a lot of time as we’re out the door but thought you should see the Apple data.  Big beat and up over $40 after hours.

Good thing for the sell-off prior to earnings as its sets the stock up for a nice run.    Gonna try and drill down on new iPad vs old iPad sales.

More tomorrow.

Click on table to enlarge.

(click here if table is not observable)

Posted in Apple | Tagged , | Leave a comment

The Tale of Two Recoveries

The Global Macro Monitor is running a series of charts this week analyzing the current jobs recovery.

Today we have a couple of background charts looking at the change in monthly nonfarm payroll employment from January 1999 to the most recent data of March 2012.

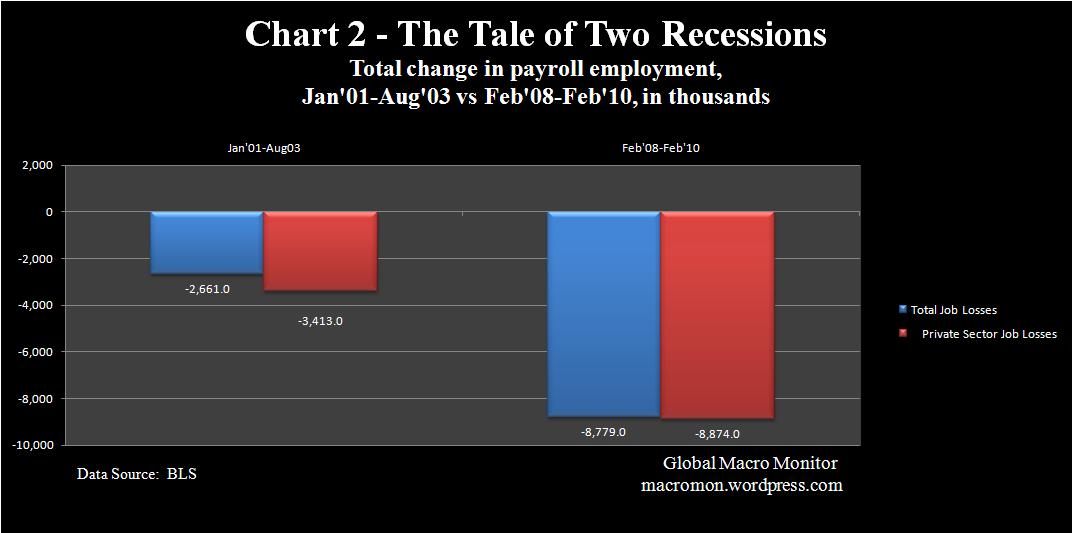
Chart 1 illustrates the depth of job losses during the period February 2008 to February 2010 relative to the last jobs recession during 2001-03.  The maximum monthly loss in payroll employment during 2001-2003, for example, was only 331K versus 818K during the financial crisis.

Total job losses in the two recessions are then juxtaposed in Chart 2.  Note that more than 3x more jobs were lost in 2008-10 than in 2001-03.

We compare the two recoveries by change in nonfarm employment in each major industry.   Chart 3 looks at the first 25 months of the last job recovery — September 2003 to September 2005 – and compares it to the current 25-month recovery, which began in March 2010.

Interestingly, both recoveries – 25 months in — created almost the same amount private sector jobs, 4.13 million versus 4.05 million, respectively.   The 2003-05 economy recovered all the jobs it had lost in just 17 months  and created an additional 3.8 million jobs as employment expansion continued though January 2008.   The current recovery has regained only about 41 percent of jobs lost in 2008-10.

The composition of jobs created in this recovery versus the last differs in many industries and reflects the structural changes which are taking place in the economy.   Employment growth in professional services, education and healthcare, and leisure and hospitality is tracking the last recovery and are still large job creators.

Manufacturing jobs are rebounding in this recovery, the opposite of what happened in the first 25 months of the 2003 recovery, which experienced job losses.   No celebration yet, however, as only a fraction of the 2 million manufacturing jobs lost during 2008-10 have been recovered.  Nevertheless, the bleeding has stopped and hiring is moving in the right direction.

Construction has recovered only 22K  of the almost 2 million jobs lost in 2008-10.  Again, this is at odds with the 2003 recovery which was led by a monetary induced housing bubble creating many construction and other jobs affiliated with real estate.   We recall reading one stat that one in every two jobs created in California during the last recovery was housing related.  This explains why California has one of the highest unemployment rates in the country.

Finally, note the sharp drop in government jobs during this recovery.  We need to drill down further, but we suspect these are layoffs at state and local governments and postal workers at the federal level.  We looked at this a few months ago and found that federal government jobs, excluding the post office, had increased.

We’ll have more tomorrow.   Stay tuned.

Click on charts to enlarge and for better resolution.

(click here if charts are not observable)

Posted in Employment | Tagged , , , | 3 Comments

Charlie Rose: IMF Roundtable on the Global Economy

Excellent roundtable on the global economy:

The Global Economy with IMF Managing Director Christine Lagarde; Anders Borg, Minister for Finance in the Swedish government; Christina Romer, former Chair of the Council of Economic Advisers in the Obama administration; Duvvuri Subbarao, Governor Reserve bank of India; & Agustín Carstens, Governor of the Bank of Mexico.

Click here to view video.

(click here if video is not observable)

Posted in Black Swan Watch, Economics, Sovereign Debt, Sovereign Risk | Tagged , , , , , , , | Leave a comment

Eurozone Flash PMI At 5-month Low

Europe is definitely slowing and markets, along with Eurozone politics, are beginning to internalize the slowdown.  Markit reported this morning the preliminary flash reading of the Eurozone Composite PMI fell to a five-month low.   In addition,

The index fell for the third month in a row to 47.4, down from 49.1 in March, to signal a faster rate of decline of private sector economic activity. Output has fallen seven times in the past eight months…

Output fell at the fastest rates for five months in both manufacturing and services, with the former seeing the steeper rate of decline.

(click here if charts are not observable)

Posted in Economics, Euro | Tagged | Leave a comment

Euro Trashed

As we posted last week,  Enter French Politics (and Dutch).

(click here if video is not observable)

Posted in Black Swan Watch, Euro, Global Stock Performance, Global Trend Indicators | Tagged , , , , | Leave a comment