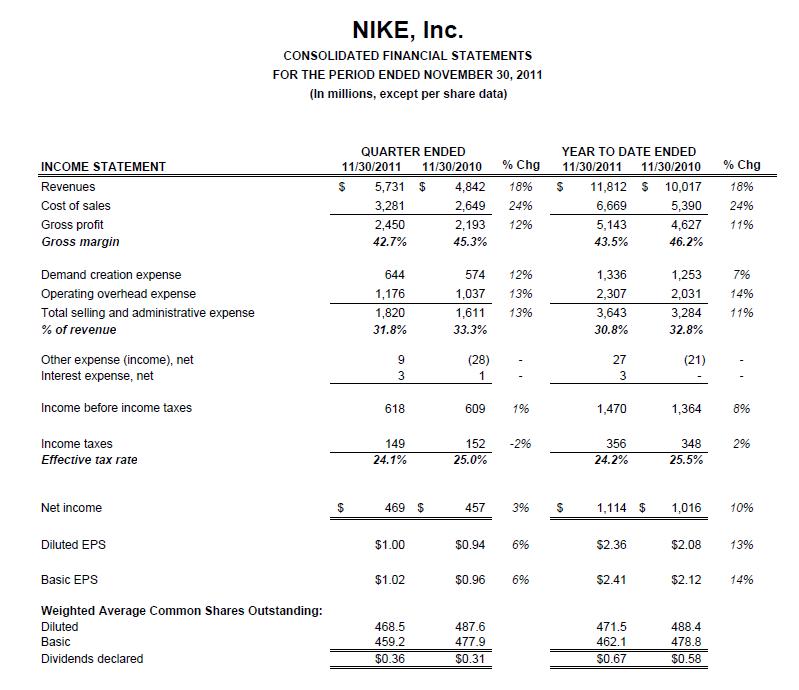
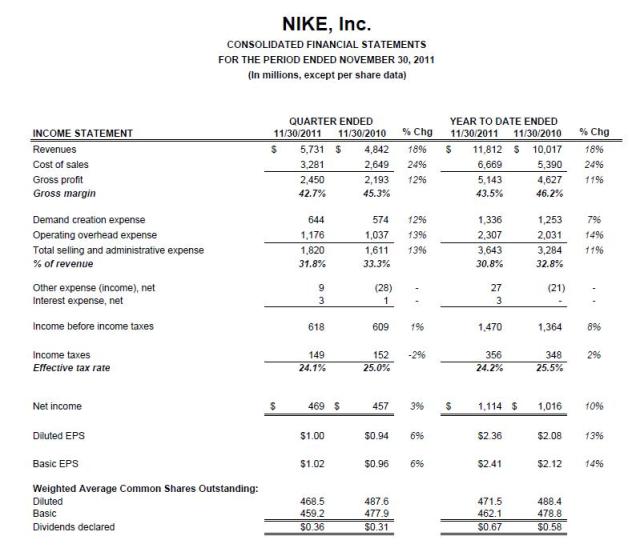
 Nike reported good earnings after the bell and the stock traded up over the 3 percent in after hours. Here are the money quotes from the Nike executives on this afternoon’s conference call:
Global Economy
Overall, a remarkable performance in what continues to be a very volatile global economy that has yet to deliver a uniform recovery. And looking ahead, economic and political uncertainty are unlikely to abate in any meaningful way in the short-term, so risk and challenges do remain…
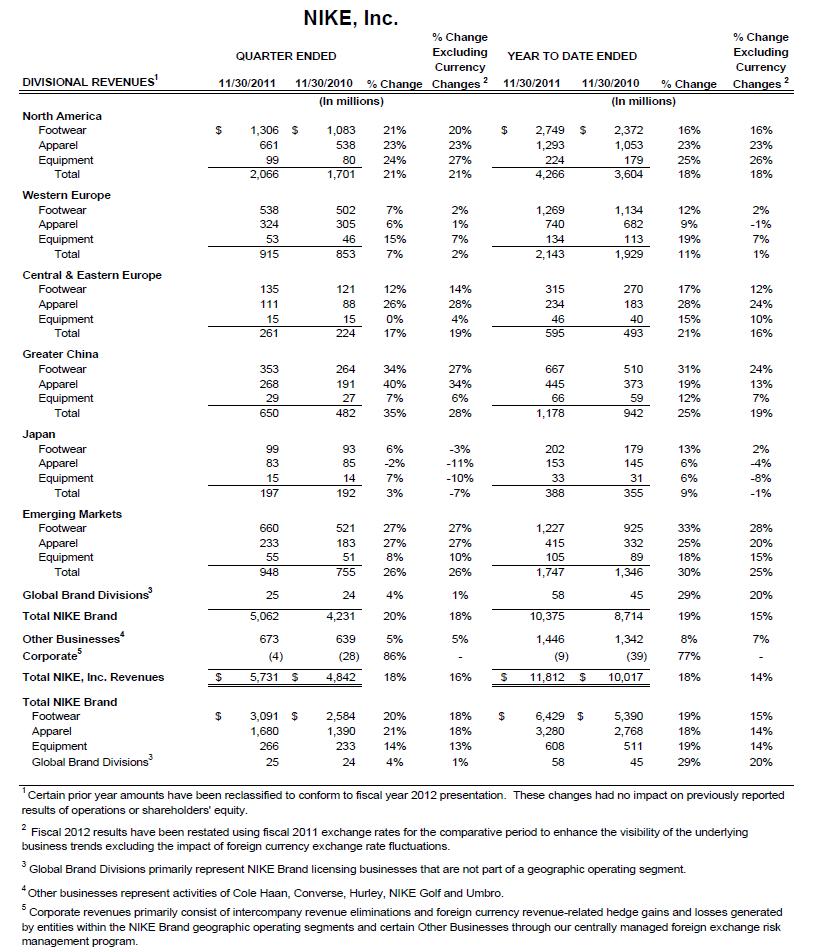
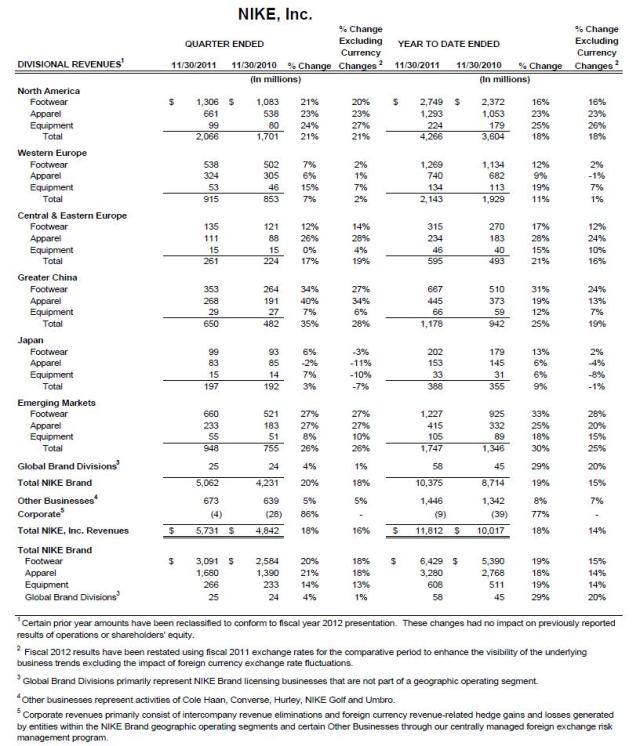
Let’s take a look at our NIKE Brand results on a constant currency basis. Global revenue was up to date 18%, and global futures were up 13%. Every geography, except Japan, grew its top line, and 6 of our 7 key categories increased revenue…
Let’s look at China, which continues to pose very strong numbers. Revenue in China grew 28% for the quarter. Footwear is up 27% and Apparel was even higher up 34% on the quarter. In part, benefiting from changes in shipment timing compared to last year. When I look at our China business, I see a couple of things at work. First, we continue to build brand loyalty with the young consumers. And second, we’re leveraging the category offense to bring the most relevant products and services to the marketplace. The consumers are responding.
Going forward, the big growth opportunity in China is based on our ability to connect directly with young consumers there, and we’re continuing to work hard at it. The passion for sport is building in China, and NIKE is at the center of it. We’re also working to leverage in Western Europe, which remains a very challenging economic environment. But we believe that our commitment to innovation and premium brand position will inspire consumers and set us up for the long-term growth. We’re using what we know about the significant benefits of transforming a marketplace through the category offense to continue to elevate the NIKE Brand positioning in Western Europe. And we expect to reap those benefits over time, as the category offense takes hold throughout that geography…
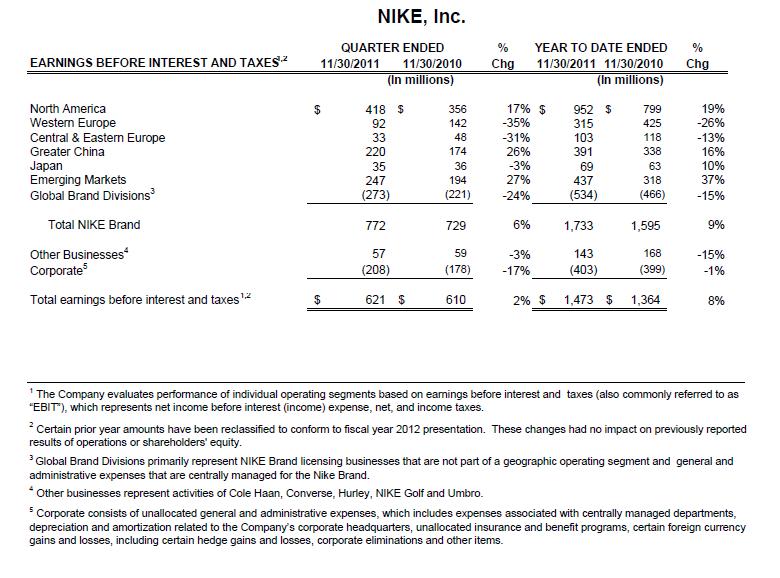
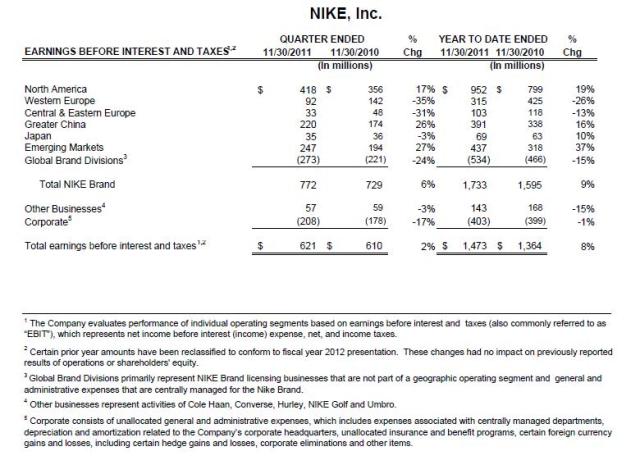
On a reported basis, revenues for North America grew 21%, and EBIT grew 17%, as robust revenue growth and SG&A leverage were partially offset by lower gross margins.
In Western Europe, Q2 revenue increased 2% on a currency neutral basis, as growth in Running, football, Women’s Training and Basketball were partially offset by lower sportswear revenues. On a territory basis, double-digit growth in our AGS Territory; Austria, Germany, and Switzerland, were partially offset by declines in nearly every other territory.
On a reported basis, revenues for Western Europe grew 7%, but EBIT declined 35%, due mostly to lower gross margins. Unfavorable FX rates and higher product cost more than offset upsides from direct to consumer and higher prices to drive the gross margin decline.
In Central and Eastern Europe, Q2 revenue grew 19% on a currency neutral basis, driven by higher revenues across all categories, led by double-digit growth in Running, Football, and Men’s and Women’s Training. On a territory basis, double-digit growth in Russia and Turkey more than offset lower revenues in Southern and Central European markets, such as Greece and Poland…
On a reported basis, revenues for CEE grew 17%, but EBIT was down 31%, driven primarily by lower gross margins, which were adversely impacted by both higher product costs and higher discounts.
In China, growth accelerated in Q2, as currency neutral revenues grew 28%, reflecting growth across all categories and territories. Footwear continues to perform very well, as revenues advanced 27% for the quarter. Apparel revenues grew 34% in Q2, due in part to a shift in timing from Q2 to Q3 last year. Excluding these changes, China Apparel would’ve grown about 20% in Q2. While we’ve made progress with Apparel in China, we believe significant opportunities remain to position this business for profitable growth going forward.
Reported revenues for China grew 35% and EBIT increased 26%, as higher revenues and SG&A leverage were partially offset by lower gross margins. Gross margins were lower in Q2 as a result of higher input costs and discounts to clear a slow-moving Apparel inventories, more than offsetting the benefit of higher prices.
Japan continued to deliver mixed results, as currency neutral revenues fell 7% in Q2, reflecting holiday futures orders taken in the weeks immediately following the natural disaster in March. While revenues declined for most key categories, Running was a bright spot, delivering double-digit growth for the quarter. Reported revenues for Japan increased 3%, but EBIT declined 3%, as higher revenue and improved gross margins were offset by SG&A deleverage.
Our Emerging Markets geography continues to drive strong growth, as Q2 revenues grew 26% on both the reported and currency neutral basis. Every category and territory posted higher revenues, with Brazil, Argentina, Mexico and Korea driving the largest share of the growth. EBIT for the Emerging Markets increased 27%, driven by revenue growth and SG&A leverage, which more than offset lower gross margins.
Technology and Innovation
… we’ve opened the door to truly game changing innovation. And some of the most powerful potential for innovation lies in the digital technology space. We’re using digital to change everything about the product creation process, from the time it leaves the mind of the designer to when it gets into the hands of our consumer. Truly breakthrough innovation that will allow us to accelerate how we create and commercialize new products.
Social networking and digital communication is helping us unify and expand the family of sport. We’ve never been closer to our consumers as they continue to extend their reach and connect even more with each other, with their sports heroes and their favorite teams. And digital technology is a powerful enabler of the huge opportunities we have in our Direct to Consumer business and in working with our wholesale partners.
“New Running Boom”
For brand strength, let’s turn to Running. It’s been a great quarter. In fact, it’s been a great year. My favorite running story of the quarter has to be the event we did in Seoul, South Korea, a city with incredible energy and a growing influence in youth culture. We sponsored a 10K there as part of our WE RUN campaign that takes place in 16 cities throughout our Emerging Markets geography. It sold out with more than 30,000 people, in just 2 hours. And we continue to have similar turnouts around the world. 10,000 runners in Singapore, 12,000 in Kuala Lumpur, 15,000 in Buenos Aires, and 23,000 in Guadalajara in Mexico City. And then there was the Chicago Marathon, 45,000 runners, store events, product expose, training runs, and it all came together online through Nike+. It was our most digital Marathon ever.
We haven’t seen this much energy around Running since the first boom happened back in the ’70s. We were in the middle of that one, and we’re in the middle of this one as well. Our results prove it, with Running up strong double digits again in Q2.
Click tables to enlarge and for better resolution.
 (click here if tables are not observable)