Our macro takeaway from the call is that Europe is rolling over. No normal September bounce from the seasonally slow August. The company also notes what they see as a temporary slowdown in China. Alcoa missed and the stock got hammered in AH trading.
Highlights:
- Income from continuing operations of $172 million, or $0.15 per share, up 182 percent compared to third quarter 2010, down 47 percent from second quarter 2011
- Revenue of $6.4 billion, up 21 percent over third quarter 2010, down 3 percent from second quarter 2011
- Cash from operations of $489 million in the quarter, $1.1 billion year-to-date
- Free cash flow of $164 million in the quarter, $250 million year-to-date
- Debt-to-capital ratio of 33.7 percent and cash on hand of $1.3 billion
Conference Call – Quotes from Management
There were 2 significant developments.
First, we have experienced significant commodity price deflation in our Alumina and Aluminum segments. While aluminum demand continues to grow globally and regional premiums remain strong, macroeconomic worries and various commodity investors have driven an 8% drop in the price of aluminum quarter-on-quarter. The result is a decrease in revenue and profits in both segments. Despite the price deterioration, both businesses were able to generate sufficient volume and productivity savings to essentially offset inflationary headwinds.
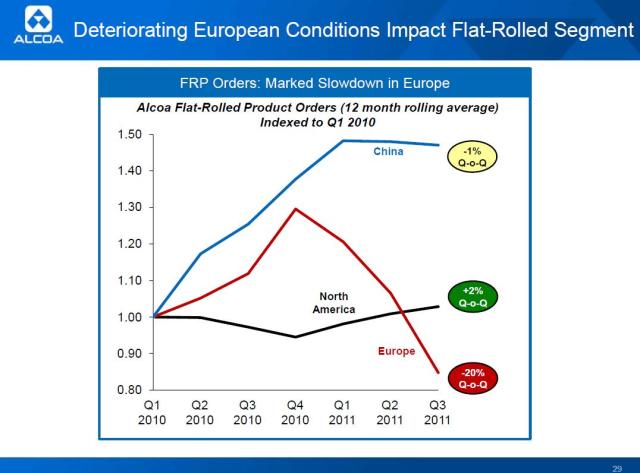
Secondly, results in several products were degraded by the continuing sovereign debt crisis in the Eurozone and the resulting market uncertainty. These conditions have driven falling confidence in both consumers and businesses. Fearful of a slowing economy, our European customers reduced their orders dramatically even until September and drove a significant reduction in this segment’s profitability…
Alumina production remained flat this quarter as we scale back plans to increase production given weakness in the spot market. This flexible capacity remains available and ready to deploy as market conditions improve. We experienced $19 million in market effects during the quarter, including a 3% decline in alumina pricing, partially offset by positive currency impacts mainly driven by the strengthening of the U.S. dollar.
Now let’s move to primary. Production was up 2%, and third-party shipments were up 4% sequentially as we felt the full impact of our restarted plants in North America. Realized pricing was down 5%, although the drop in LME was more indicative of macroeconomic uncertainty rather than specific pressures related to global demand of aluminum. Regional premiums continue to remain strong. On a prior year basis, realized pricing strengthened 19%, but the U.S. dollar weakened considerably.
Let’s now move to the Flat-Rolled Products segment. European seasonal shutdowns in August were followed by an unseasonably slow September, causing significant volume losses as well as price and mix impacts. China also buying decline that unfavorably impacted results in a sequential basis. For China, this appears to be temporary slowdown in automotive, and we don’t anticipate this to be a sustained trend as volumes are expected to return to growth in the fourth quarter…
Next quarter, we expect to see continued demand strength in aerospace but with normal seasonal effects and beverage can packaging. We should see an improving product mix although the uncertainty remains high in Europe…
Looking ahead, we anticipate incremental improvements in all of our markets except commercial transportation in Europe and building and construction in Europe and North America. We also anticipate productivity improvements to continue. Now let’s move to the cash flow statement…
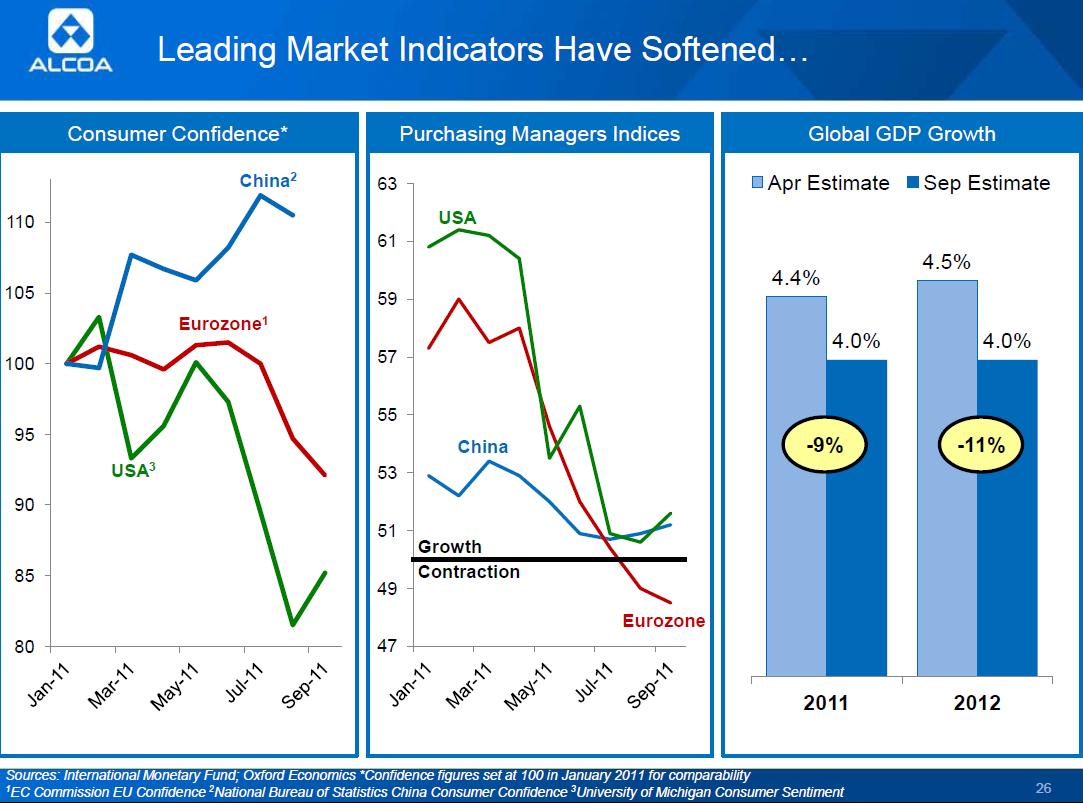
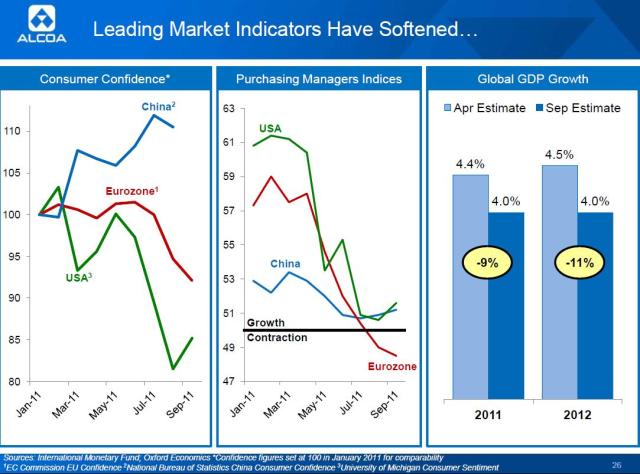
…let’s turn to the end markets, and I’ll start with this. I mean, and I start with that because you will see what we, in the next 2 slides, what we really see in the market. But these are in a way supposed to be leading indicators, and we see consumer confidence here. USA declining but recovered somewhat; Eurozone deteriorated along the sovereign debt crisis in Europe; China, pretty good.
Purchasing Managers Indices, USA and China come close to the contractual, and Europe already dropped into it. That’s the reason why the IMF has corrected their forecast for worldwide GDP growth this year. But keep in mind, they corrected it to 4% this year and next year down from roughly 4.5% as it was before. So the are some storm clouds gathering, and they create clearly significant uncertainty and particularly in Europe…
So let me, in the usual fashion, address what we are seeing in the different markets. On the aerospace side, we are seeing continued positive momentum. As you saw in the last slide, we expect the year-on-year growth between 6% to 7%. Primarily, this is driven by large commercial aircraft…
Let’s go to the next segment, automotive. We continue to have a positive view on the auto market the general consensus is that this segment will not grow as fast as anticipated due to the economic uncertainties, but the trend will still be positive but at a slower pace.
If you look at North America, U.S. car sales reached a seasonally adjusted selling rate of around 30 million vehicles for the first time since April. Vehicle inventories are around 49 to 54 days. The norm is around 60. Toyota has announced that all American facilities are now at normal production rate. So we see a year-on-year expected growth in North America automotive between 8% to 10%. However, compared to the first half, we believe sales are probably going to be flat.
In Europe, overall 2011 was expected to have modest sales growth between 1% and 2%, led basically by Germany mainly through export in Russia. I mean, 27% up in July and overall, year-on-year 32% up. However, the larger concerns exist basically around Europe second half given the increased, substantially increased uncertainty and we expect sales to decline by 16% in the second half.
China, auto sales slowed in the middle of the second quarter in ’11 but returned to positive growth. So we see the 3 consecutive months have been growing at 6% year-over-year growth. We expect given the positive start in the third quarter to continue into second half, and we believe we’re going to see another 2% growth compared to the first half.
Heavy trucks and trailer. This basically results from 2 segments, and these segments are really mix. I mean, we expect the global growth to be around 0% to 2%. It’s a very mixed bag. Largely driven by the strong first half results of North America and Europe and the substantial decrease in China, particularly in the second half of this year.
So North America, we saw in the first half and second half largely positive. For the year, truck orders surpassed 225,000 units. That’s up 108% compared to the same period a year ago. That’s a nice backlog there. It’s 121,000 vehicles. This is 6 months of production. However, I just want to mention that also, we’ve seen a slight uptick in auto cancellations in August. I think it’s way too early to tell what are these. This is just, I mean, an increased uncertainty or has been just a usual fluctuation that exist in those markets.
So in Europe, on trucks and trailer, all major markets are experiencing growth and the EU27 countries August registration is up 29%. However, the turmoil in the European market has raised uncertainty, so we believe the second half demand is forecasted to be down by 11%.
China, there was a record year in 2010. Demand was slowing down June and July, 2 straight months of minus 30% year-on-year sales decline. It slowed a little bit in August, but still minus 12% versus a year ago. So we believe minus 24% is the right number here on truck and trailers in the second half in ’11…
And then commercial building and construction, North American markets and, to a little lesser extent, European markets continue to experience significant pressure. We expect North America to continue to decline year-over-year by 10% or 12% and Europe by 4% to 6%, China will continue to grow around 10% to 12%.
And the last segment, industrial gas turbine. After a steep demand decline in 2009 and 2010, we see the market starting to recover. We expect 5% to 10% growth in 2011 and the mid- to long-term outlook as you well know, remains pretty bright in this segment.

 (click here if charts is not observable)

 (click here if chart is not observable)