Macro Notes from the IBM Earnings Call

  • Diluted EPS:
    • GAAP: $3.19, up 13 percent;
    • Operating (non-GAAP): $3.28, up 15 percent;
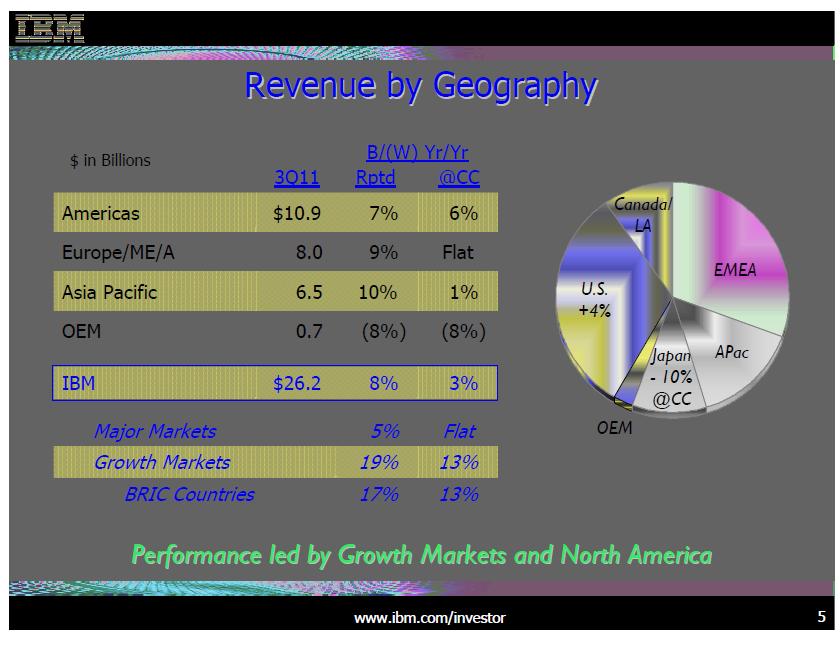
  • Revenue: $26.2 billion, up 8 percent, up 3 percent adjusting for currency;
  • Net income:
    • GAAP: $3.8 billion, up 7 percent;
    • Operating (non-GAAP): $4.0 billion, up 9 percent;
  • Pre-tax income:
    • GAAP: $5.0 billion, up 7 percent;
    • Operating (non-GAAP): $5.2 billion, up 10 percent;
  • Gross profit margin:
    • GAAP: 46.5 percent, up 1.2 points;
    • Operating (non-GAAP): 46.8 percent, up 1.5 points;
  • Software revenue up 13 percent, 8 percent adjusting for currency;
  • Services revenue up 8 percent, 2 percent adjusting for currency;
    • Services backlog of $137 billion, up $2.4 billion;
  • Systems and Technology revenue up 4 percent, 1 percent adjusting for currency:
    • Power Systems up 15 percent;
  • Growth markets revenue up 19 percent, 13 percent adjusting for currency;
  • Business analytics revenue up 19 percent year to date;
  • Smarter Planet revenue up 50 percent year to date;
  • Cloud revenue year to date has doubled full-year 2010 revenue;
  • Full-year 2011 Operating (non-GAAP) EPS expectations raised to at least $13.35 from at least $13.25.

Conference Call

Our geographic performance was again led by the growth markets in North America. I’ll discuss the geographic results on a local-currency basis. Revenue in our major market countries was essentially flat year-to-year. The U.S., our largest market, was up 4%, and Canada was up 7%, driven by continued momentum in our software business and great performance in Power Systems. In Europe, we had good growth in Spain, which was up 9%; and in the U.K., up 5%. We’ve now had 8 consecutive quarters of constant currency revenue growth in the U.K.

Our growth markets, again, had fantastic performance, outpacing the majors by 12 points. With 13% revenue growth, this is the fifth consecutive quarter of double-digit revenue growth in share gains compared to a strong third quarter last year. Performance was broad-based. As I mentioned, we had double-digit growth in 40 growth market countries including each of the BRICs. Our success is broad-based from a segment perspective as well. In fact, growth markets led the performance in each segment, with strong growth and expected share gains in GTS, GBS, Software and Systems and Technology. Within growth markets, we’re expanding into new countries and territories to reach new clients and enterprises. And so far this year, we’ve opened over 80 new branches…

Algorithmics expands IBM’s capabilities in the financial services industry by helping clients quantify, manage and optimize their risk exposure across a range of financial risk domains. Q1 Labs helps clients more intelligently secure their enterprises by applying analytics to correlate information from key security domains and creating security dashboards for their organizations…

Now to your other question, let’s look at it on a geographic standpoint. I mean, first of all, the U.S. was up 4%, Canada was up 7%, Latin America was up 17%. Within the overall growth markets unit, it was up 13%. I mean 13% is very, very strong, a very strong quarter for us…

…on a more macro basis, we do see a very good pipeline in the fourth quarter for our software business. I think they had a very good quarter in the third, and they’ve got a very good pipeline to extend that performance into the fourth. As I said earlier, we see very similar performance for GTS as we go from the third to the fourth, and we can see improved performance on our GBS business growing to low to mid-single-digit growth rate. As well, a lot of those same characteristics that help us expand margin so substantially within the quarter are going to be able to — we’ll take advantage of those as well as we go into the fourth quarter…

Q:  Any of the more anecdotal indicators that would suggest things are getting more difficult in the services side of your business, any color there?

A: No, I don’t think I would say that. I mean, if we look at the services base of business, as I said, from a GTS side going into the fourth quarter, we would expect that GTS would have a similar quarter in the fourth quarter to what they had in the third. I guess from a macro standpoint, we could talk a little more about GBS. I mean, on a GBS basis, one thing from a macro position to remember, they have kind of an outsized distribution of their business in Japan and public sector. In fact, within GBS, well over or just over 1/3 of their business is in Japan and public sector. So when you look at the GBS performance, I think it’s fair to look at how do they perform outside of those 2 areas of business. And if you extract Japan and public sector from GBS performance, you’d see that the revenue in the third quarter was up 13% for the balance of the business.
(click here if charts are not observable)
Posted in Earnings | Tagged | 1 Comment

Germany dampens euro zone crisis hopes

(click here if video is not observable)

Posted in Black Swan Watch, Economics, Euro, Sovereign Debt, Sovereign Risk, Video | Tagged , , | Leave a comment

Belgium Waffles w/ Irish Coffee = No Free Brunch

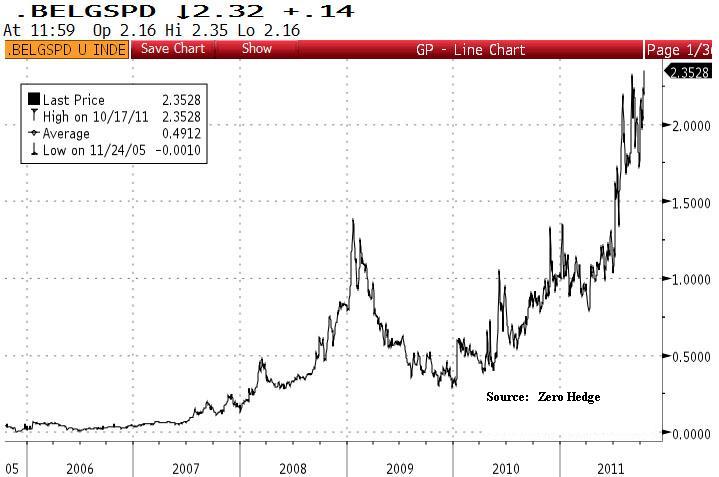
Over the weekend we posted a chart illustrating how French bond yields are blowing out.  Zero Hedge posted the following chart today illustrating the Belgium – German yield spread has just hit a new high.  ZH has been spot on and has not waffled in its conviction with respect to the European Debt Crisis.

The rescue of Dexia and concerns over bank backstopping and recapitalization are putting stress on the sovereign credit of the core Euro countries,  Irish style.   Das ist nicht gut!   Recall that what took down Ireland’s sovereign credit was the rescue of its banking system.

Furthermore,  Merkel’s  waffle today on the efficacy of the plan of the plan hints, at least to us, the Germans also fear being sucked into the black hole of deteriorating sovereign credit.   Fear often results in paralysis.   Let’s hope not.  The pressure builds on the Euro policymakers to pull a rabbit out of the hat.

(click here if chart is not observable)


Posted in Black Swan Watch, Bonds, Credit, Euro, PIIGS, Sovereign Debt, Sovereign Risk | Tagged , , | 1 Comment

Rhyme of History: Young Pinkies from Columbia & Harvard?

Nice ‘toon floating around the ‘net.   Can you hear the rhyme of history in our current political dialogue?  Marxist rhetoric and all.   Check out Uncle Joe in the corner enjoying the red sunrise.

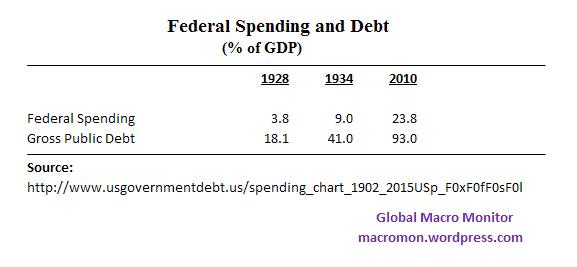
We provide a little historical context with the data table.   President Roosevelt had a lot of room to expand government spending.   President Obama does not.

Hat tip Craig “Big Bunda” B.!

(click here if cartoon is not observable)

Posted in Budget Deficit, Cartoon of the Day, Economics | Tagged , , , , | Leave a comment

China’s Dwindling Trade Surplus Signals Weak World Economy

(click here if video is not observable)

Posted in Black Swan Watch, China, Video | Tagged , , , , | Leave a comment

Week in Review: Swanned Out?

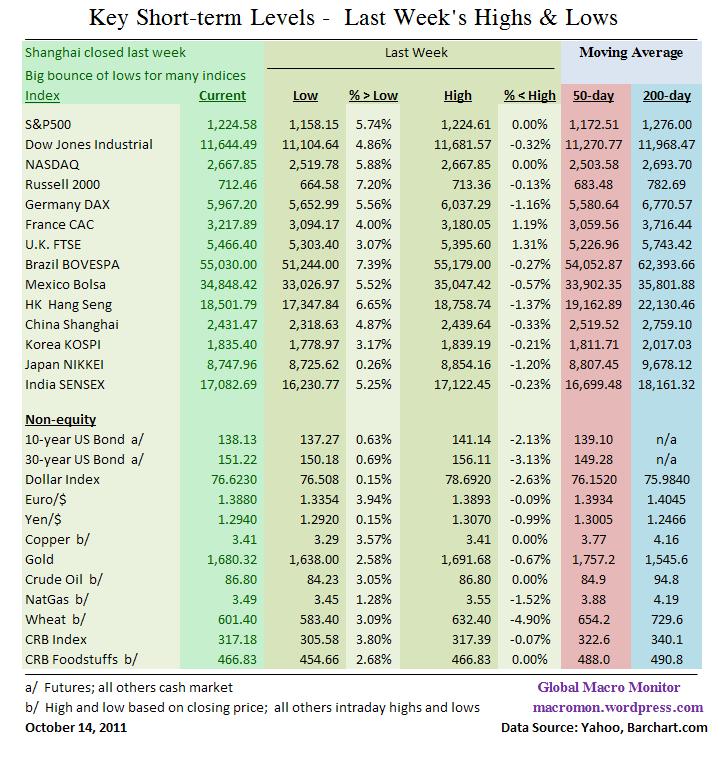
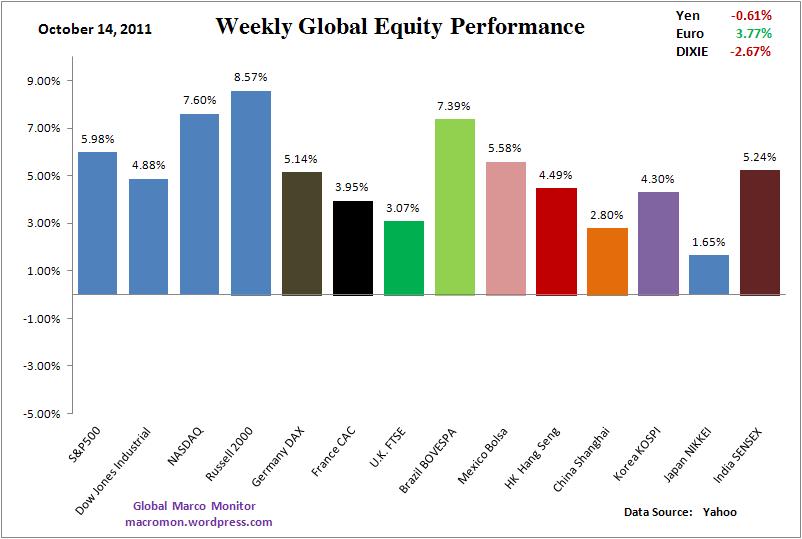
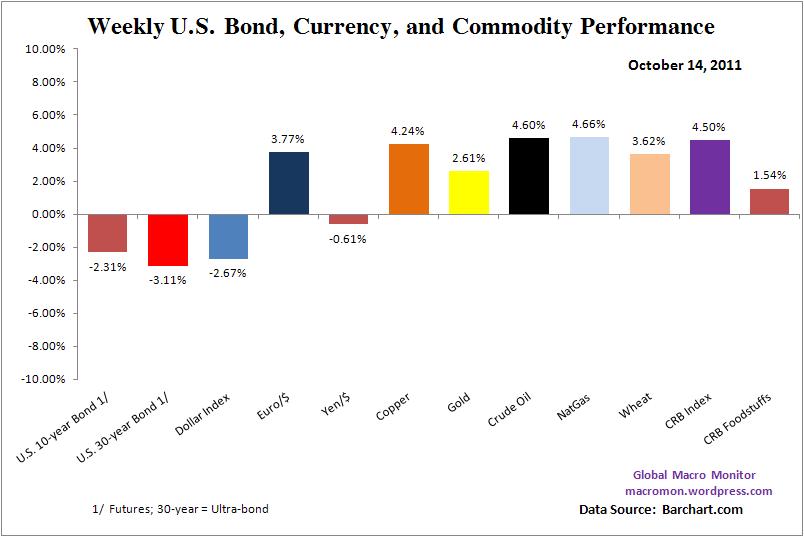
Huge week.  The S&P500, Nasdaq, Russell 2000, FTSE, Mexican Bolsa, and Hang Seng, Euro, and the CRB had their best weeks of the year.   After what we would deem a very disappointing G20, which revealed continued fracture and disunity within the Eurozone, markets are up in Asia and in the overnight session.

This is going to be an interesting week and a big test.  The markets are in a much better technical condition as most global equity indices x/ China have recaptured their 50-day moving averages.  Can the markets now take a big tape bomb or absorb negative news?

Are the risk markets sold out and starting to price a more positive scenario for the three macro swans – 1)  Euro Debt and Banking Crisis; 2)  U.S. recession fears; and 3) China hard landing —  which caused the August crash?  We don’t know and nobody knows, but it sure seems so.

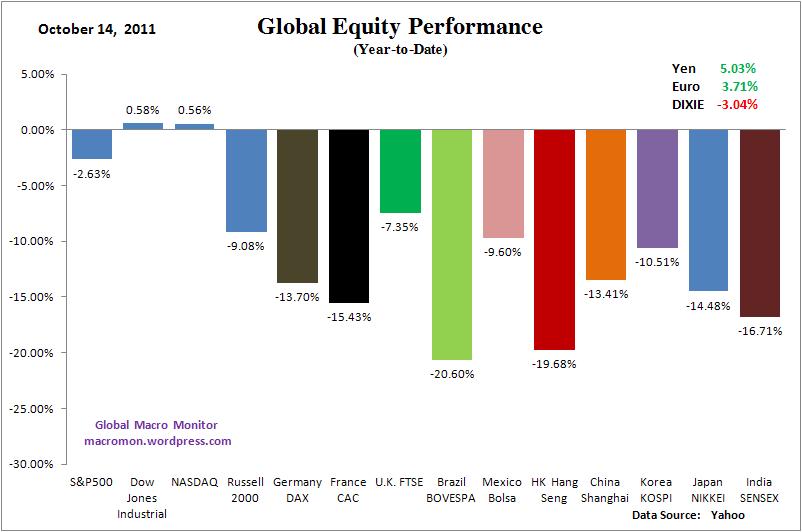
The Nasdaq and Dow are now up for the year and the S&P is within a few points of breaking through stiff resistance at 1230.   The bears have had their chance to really break this market and are now in retreat.  Their  last stand is S&P 1230. We will be watching carefully for a bull trap if we break through resistance just as the bear trap crushed the shorts after breaking support at 1101.

Now let’s see what the bulls have.   We like select tech and energy hedged with a short  in the financials.  If this is the head fake,  the financials will be the first to tell us.

Longer term, we’re all dead.   Stay tuned.

(click here if charts are not observable)
Posted in Week in Review | Tagged , , , , , , | Leave a comment

Global Trend Indicators

(click here if tables are not observable)

Posted in Global Trend Indicators | Tagged , , , | 1 Comment

Spooky Chart: French with an Irish Brogue

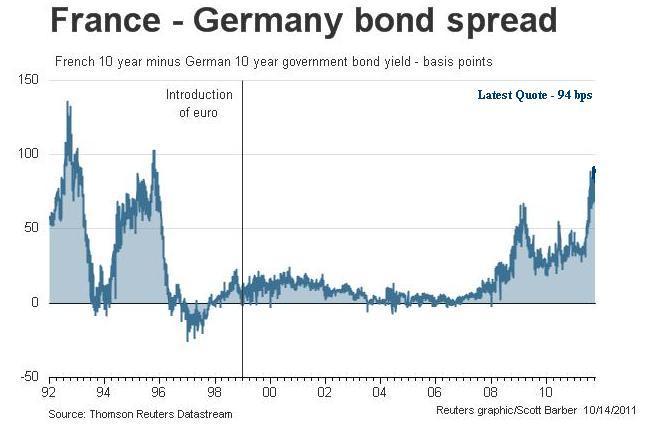
Here is the one chart via Reuters that scares us most.   French bond yields relative to 10-year German bonds have been spiking.  The market seems concerned that a large commitment by France to backstop or recapitalize its banking system could take down the sovereign,  Irish style.   Not doubt this is what keeps Sarkozy up at night and is sure to catch the risk markets’ attention if it continues.   Keep it on your radar.

(click here if chart is not observable)

Posted in Black Swan Watch, Bonds, Sovereign Debt, Sovereign Risk | Tagged , | 1 Comment

Apple Set to Close at All-time High

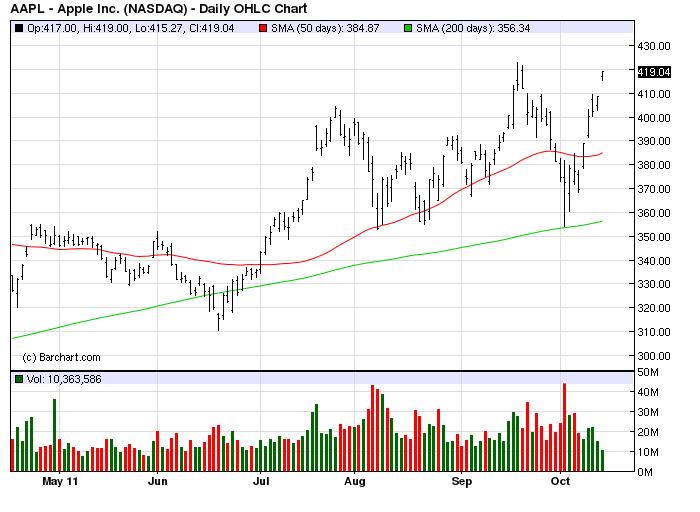
Though there is still 2 hours of trading to the close,  Apple is well above its September 20th all-time closing high of 413.45 and could easily ramp another $3 into close to take out its 422. 86 intraday high.

After bouncing off its 200-day moving average at 354.24 on October 4th,  the stock has led the overall market increasing a stunning 18.4 percent from its recent low in just 8 trading days.    Secular forces are helping to drive this stock as the mobile/wireless revolution spreads to almost every area of modern life and economy.

Apple’s earnings multiple has been depressed by concerns over Steve Jobs’ health and with his passing and the shake-out dive to the 200-day the P/E ratio may be ready to expand to where a normal growth stock trades.   The company is firing on all cylinders and is in the best secular space in the market.  No wonder investors are crowding in to what many think is an already crowded trade.

(click here if chart is not observable)

Posted in Apple | Tagged , | 2 Comments

Euro Banks Under Pressure on Greek Holdings

(click here if chart is not observable)

Posted in Black Swan Watch, Euro, PIIGS, Sovereign Debt, Sovereign Risk | Tagged , , | Leave a comment