Quote of the Day: Stock Gurus

The secret to being a stock market guru isn’t to be correct but to make very loud and frequent predictions. As soon as the market moves in your direction you proclaim victory. The key is to make sure that no one ever can precisely nail down your original entry points. – James “Rev Shark” De Porre
Posted in Equities, Quote of the Day, Quotes | Tagged , | 3 Comments

U.S. Macro in Three Charts: Credit Flows

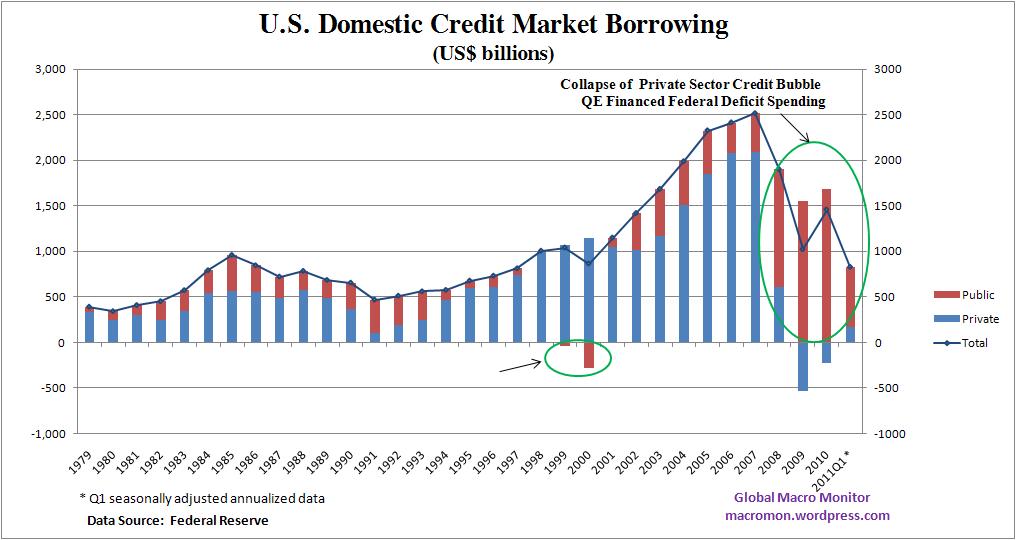
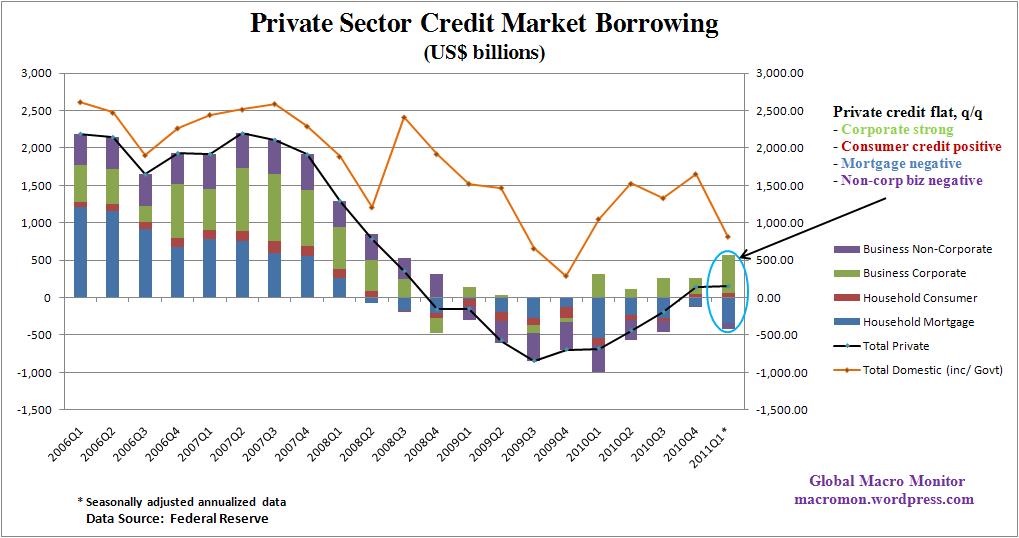
The U.S. is suffering from insufficient aggregate demand the result of the bursting of the 2004-07 credit bubble.   The consumer led economy financed by borrowing, much of it backed by home equity,  has given way to massive private sector deleveraging as reflected in the charts below.  To cushion the blow, the federal government stepped up deficit spending in an effort to replace the decline in demand.  This is clearly illustrated  in the charts below.

The latest data from the Federal Reserve’s Flow of Funds Accounts  show that private domestic credit borrowing of the non-financial sector is still at very anemic levels (see middle chart) .   Though total private non-financial credit growth was flat in Q1, corporate continued to strengthen and consumer credit was positive for the second straight quarter.  This was offset, however, by continued deleveraging in the mortgage and non-corporate business sector.    The negative borrowing is likely both supply and demand constrained.

The charts are revealing as they also illustrate the sharp Q1 drop in public sector borrowing with state and local government turning negative.    Unless private credit significantly improves — net mortgage lending turning positive, for example – to help finance the expansion of domestic demand, the economy will likely remain sluggish as the crunch in public spending continues.   After all,  President Obama did say that “the flow of credit is the lifeblood of our economy.”

Corporate spending and the export sector will have to do the heavy lifting as the U.S. works its way through the credit mess.   The President needs a positive Black Swan event, such as the explosion of the internet, which drove high levels of investment spending during the Clinton Administration,  for example.

Policies to free up financing for small and non-corporate businesses and renewed efforts to clean up the mortgage sector and also allow housing prices to bottom,  could help strengthen the recovery.   Stay tuned, we’ll be back with more analysis of the Flow of Funds.

(click here if charts are not observable)

Posted in Economics, Fiscal Policy, Monetary Policy, Sovereign Debt, State and Local Government | Tagged , , , | 3 Comments

Jackie Moon’s Lehman Moment

We love allegories.  The Wizard of Oz was, many believed, an allegory  of the political and economic times of the 1890s.  Wikipedia observes the “Yellow Brick Road” represented the gold standard, and “the silver slippers the Silverite sixteen to one silver ratio (dancing down the road).   Many of the characters in the movie supposedly resembled actual political personalities of the 1890s.   Dorothy was the American people and the cowardly lion represented the politician William Jennings Bryan,  or politicians in general.  Following the road of gold lead eventually to the Emerald City, which symbolized the world of fiat paper money that only pretended to have value.

We find the following hilarious scene from the movie, Semi-Pro, an accidental allegory  of the 2008/09 financial crisis.   Can you identify the various stages of the crisis in the scene?  1)  an initial fear of leverage;  2) greed;  3) total disregard of risk;  4) arrogance ;  5) crowd psychology and reinforcement;  5) shock after reality sets in;  6)  fear;  7) denial before the storm – “subprime woes likely contained”;  and 6) full blown panic?

Jackie’s “Lehman Moment” and Roubini rhetoric is priceless!   Hopefully,  the Chinese version is not coming anytime soon.   (click here if video is not observable)

Posted in China, Economics, Uncategorized | Tagged , , | 5 Comments

Sino Support Levels

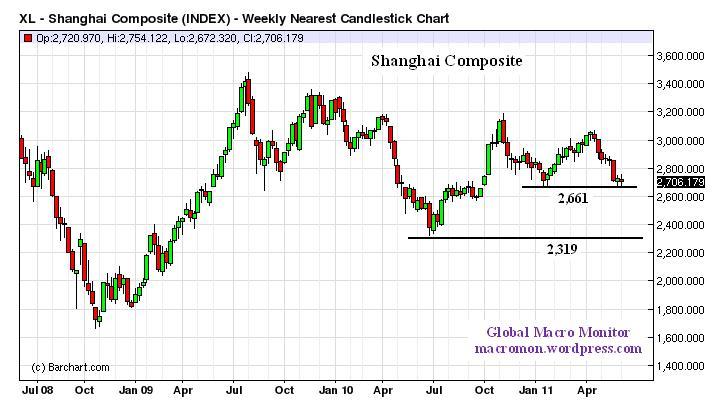
The China story is under pressure and weighing on the markets.   We shall soon find out if Jim Chanos is correct and how robust the Asian economy is as credit driven bubbles begin to burst.   Watch these important weekly levels for the Shanghai Composite and Hang Seng.

(click here if charts are not available)

Posted in Charts, China, Global Stock Performance | Tagged , | 3 Comments

Week in Review: Streak Week

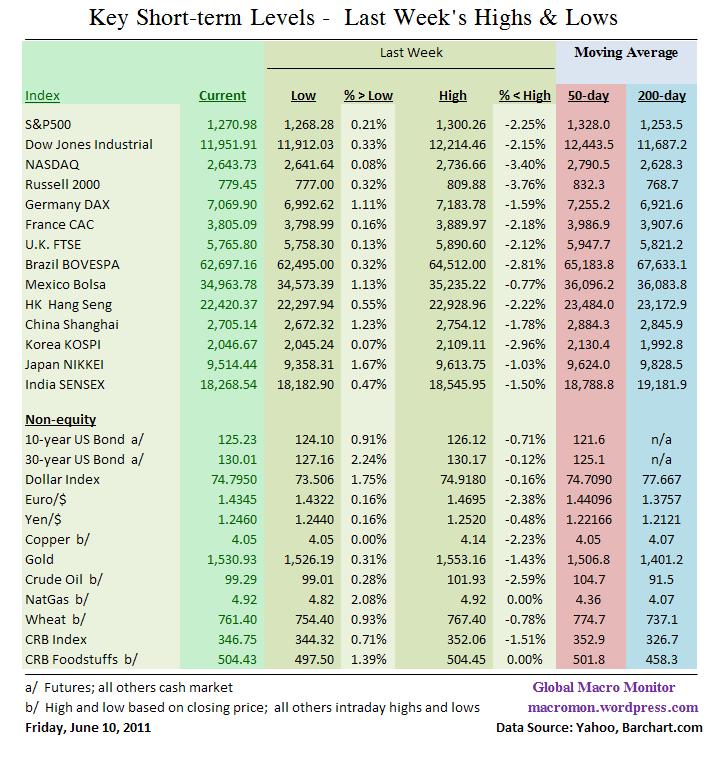
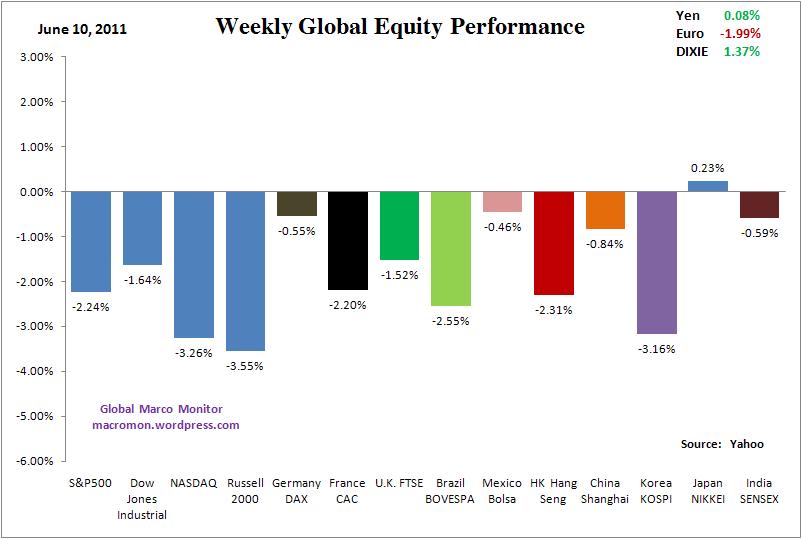
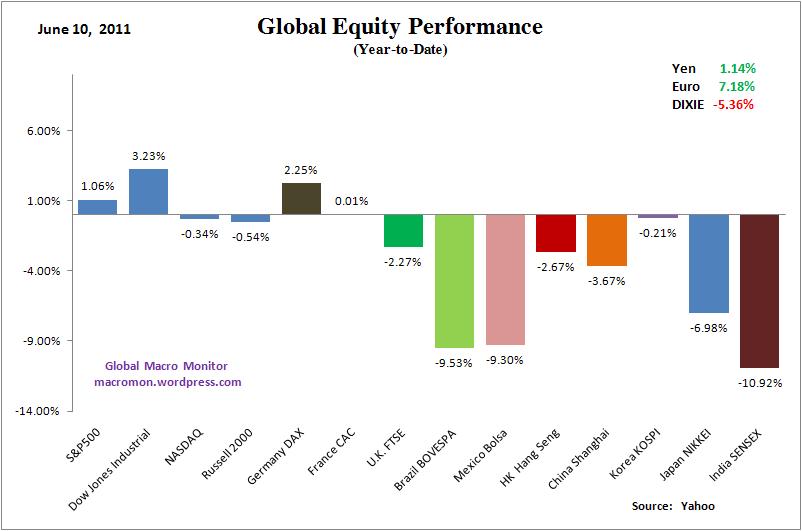
It was another tough week for the global markets. The S&P, Dow, and the major European equity indices closed lower for a rare sixth week in a row.   Next week could be historic as the S&P500 has initially closed lower seven straight weeks only three times in the past sixty years.   The many Macro Swans we have been writing about are weighing on the markets, including the end of QE2, China, Japan and the European Debt Crisis, which are slowing global growth and adding to worries about the upcoming earnings season.    All the major equity indices were down for the week, excluding Japan, with the Russell, Nasdaq, and Kospi more than 3 percent lower.  The Nasdaq and Russell are now down for the year.

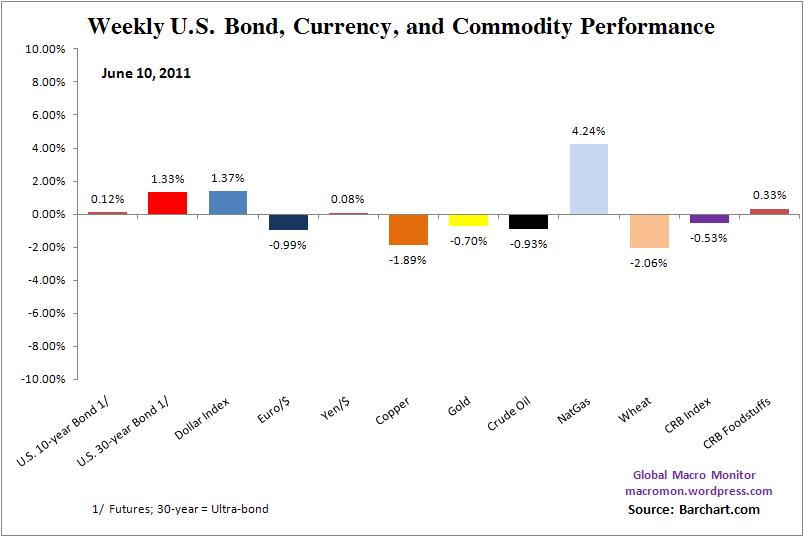
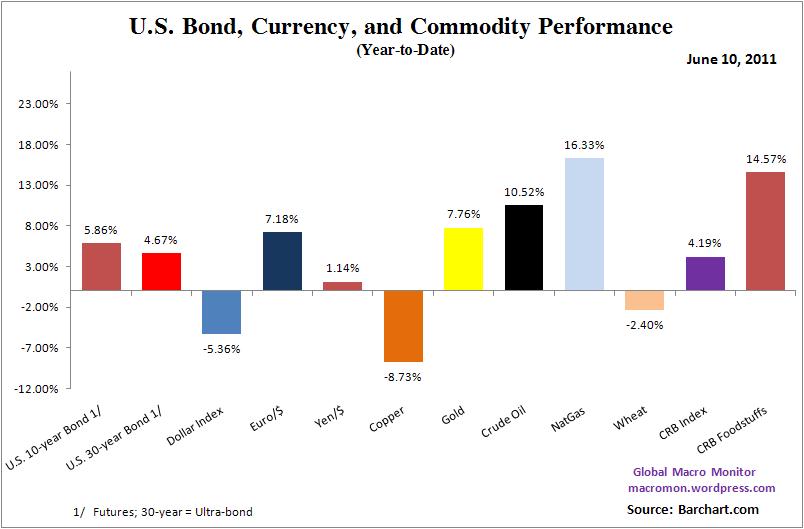
We find it interesting that Natural Gas is the star performing in the commodity space this year and copper, down almost 9 percent, the worst.   At the beginning the year, analysts wouldn’t touch nattie and loved copper.   George Soros’ dictum, “the markets are always wrong” is validated once again!

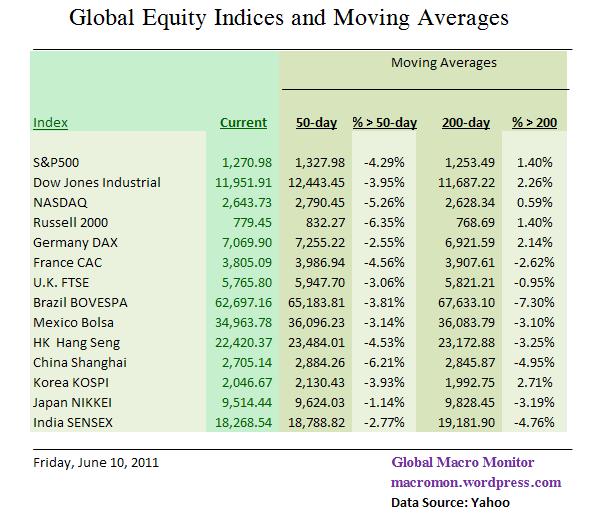
Though the markets are oversold, which could produce a nut crushing short squeeze, all signs are pointing red and we still sense a  high level of complacency out there.   A flush to at least the 200-day moving averages on the major U.S. indices seems likely,  about 2 percent lower, before a decent bounce ensues.  There are  probably more than an enough algo programs written to buy at the 200-day that these levels should be respected.

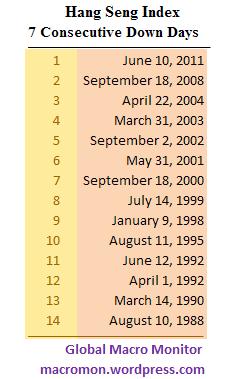
The Hang Seng index closed down a rare seventh consecutive day on Friday.  Anyone notice a pattern here?   We’re watching for a possible break in the Hang Seng and Shanghai, which are about 1 ½ percent above critical support.   If these give way, grab your helmets.   Good luck next week!

(click here if charts are not observable)

Posted in Week in Review | Tagged , , , , , , , | 2 Comments

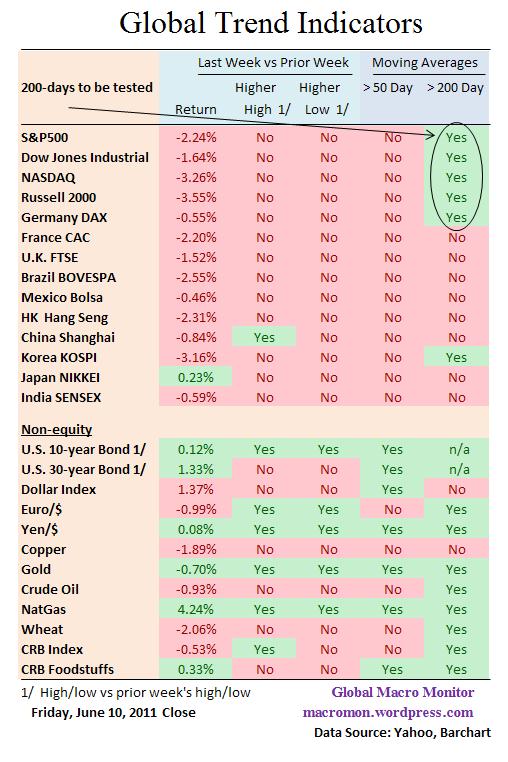
Global Trend Indicators


(click here if tables are not observable)

Posted in Global Stock Performance, Global Trend Indicators | Tagged , , , , , , , | Leave a comment

Moving Day?

We want to clarify and answer some of the questions that have come in about the phrase “Moving Day for the Administration” in our prior post.   We surely did not mean the administration will or should be moving from the White House.  This is a nonpartisan site and we hope the best and success for every President, both Republican and Democrat,  because we’re all better off if the leader of the free world is doing well.

What we meant by “Moving Day,” a golf term, is best defined by leaderboard.com:

Within the context of the PGA’s typical four-day tournaments, Thursday and Friday are used to whittle the field down to the final forty or so who will play the weekend rounds. Everyone who fails to make the cut goes home.

Saturday is called “moving day” because it is the day where competitors try to set themselves up for the final push on Sunday. As a result, you’ll frequently see certain players advance up the leaderboard by leaps and bounds. Others collapse under the pressure and slide quickly, knowing that simply by making the cut, they’ve assured themselves a decent share of the purse.

So “moving” refers to the journey up or down the leaderboard standings.  

We noted that 2011, the third year of a first term President, is looking a lot like 1991,  and we know what happened to President Bush #41 in 1992 election.   So think of moving day as 2011, the year that positions the President for the final round in 2012.  The Administration desperately needs to reach deep and find something to move it up the leader board.  Surely they’re cooking something up.  Keep it on your radar.

Posted in Economics, Fiscal Policy, Politics | Tagged , , | Leave a comment

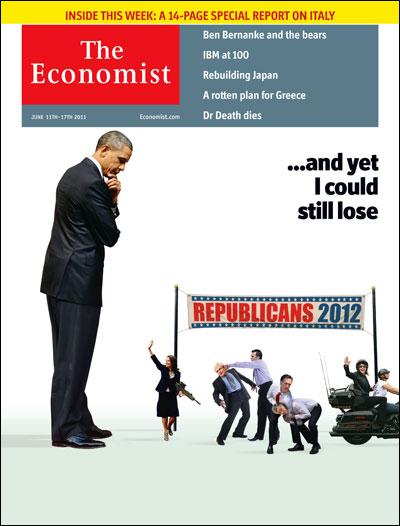
The Weekend Read: It’s Moving Day for the Administration

No President since Franklin Roosevelt has won re-election with unemployment higher than 7.2%, and Obama’s own economists in February predicted 8.6% unemployment in 2012. That number may yet be revised upward in light of recent economic headwinds, including the Japanese earthquake, gasoline prices approaching $4 a gallon and continued economic troubles in Europe. “We could use a break,” admits one Administration official.   – Time

Bonds
Bond Risk Highest Since Eisenhower as U.S. Pushes Longer Issues – Bloomberg

China
Are Speculators Behind China’s Art Boom? – CNBC
China’s coming collapse – FinanceAsia
China’s factories face big, labor-driven changes – MarketWatch
China May trade gap smaller than expected – Reuters
China official warns on weak dollar and excessive dollar holdings – Reuters

Commodities
Diverse Supply of Rare Earths Needed by U.S., Sandalow Says – Bloomberg
In Hyperinflation’s Aftermath, How Germany Went Back to Gold – Forbes
Natural Gas Entering ‘Golden Age’  – WSJ
OPEC Warns of Supply Gap – WSJ
Traders flummoxed by natural gas ‘flash crash’ – FT
Who is afraid of commodity cartels? – FT

Currencies
How to Kill a Dollar – Barry Eichengreen

Economics
Comparing 2011 with 1937 – John Taylor
The world economy survives crisis after crisis – FT
There’s No Stimulant In Stimulus – IBD
Why Washington Has No Plans to Ride to the Economic Rescue – Time

Emerging Markets
‘Monstrous Risks’ in Emerging Markets: Bernstein – CNBC
Peru’s President-Elect: Want To Use Brazil As An Example – WSJ
Why Peru’s New President Worries Investors – Bloomberg

Europe
EU sovereign debt: Not an easy bailout – New Europe
Greece at the brink as politics takes centre stage – Globe and Mail
Greek Austerity Numbers Don’t Add Up: Analyst – CNBC
Investor Jim Grant Says ECB ‘Factually Insolvent’ – WSJ
The global fallout of a eurozone collapse – Ken Rogoff
Why Greek Mountain Is No Uruguay Bump – WSJ

General
Ms. Lagarde’s Poisoned Chalice – The American
What Makes Christine Lagarde The Front Runner? – II

Geopolitical
Flood of Syrian refugees heads for Turkey – FT
Iranian Submarines in the Red Sea – Stratfor

Housing
Three big banks fail in foreclosure relief program – LA Times

Markets
Big Funds See Red in China – WSJ
Five down weeks stir crash whispers – MarketWatch
Hong Kong Stocks Drop to 12-Week Low on Global Recovery Concern – Bloomberg
Stock Market At Important Testing Phase – Index Universe
US equity outflows largest in 10 months – FT

Monetary/Fiscal Policy
Fed Begins Tri-Party Reverse Repos With Money Market Funds – Bloomberg
Fed Expands Capital Reviews to 35 Biggest Banks – Bloomberg
Money Magic – Raghuram Rajan

Technology
Cloud threatens to end PC’s reign – FT
GE Combines Natural Gas, Wind, and Solar – TR
Mediterranean Solar Goes Large – TR
New Way to Make Lighter, Stronger Steel – Science Daily

Video:  Spectacular video of lightning inside Chile Puyehue volcano ash cloud

(click here if video is not observable)

Posted in The Weekend Read | Tagged , , | 2 Comments

Hang Seng Falls 7th Straight Day

We take notice when the Hang Seng speaks as it is one of our indicator species for global risk appetite.  The index closed down for the seventh consecutive day, which has initially happened only 14 times since 1987, and is also close to breaking major support.   The Shanghai gyrated during today’s  trading session, but managed a late rally to close up on the day.   Time to reduce or get shorty risk, in our opinion.  Stay tuned.

(click here if chart is not observable)

Posted in Black Swan Watch, Equities, Global Stock Performance | Tagged , | 2 Comments

The Great QE2 Flush Out

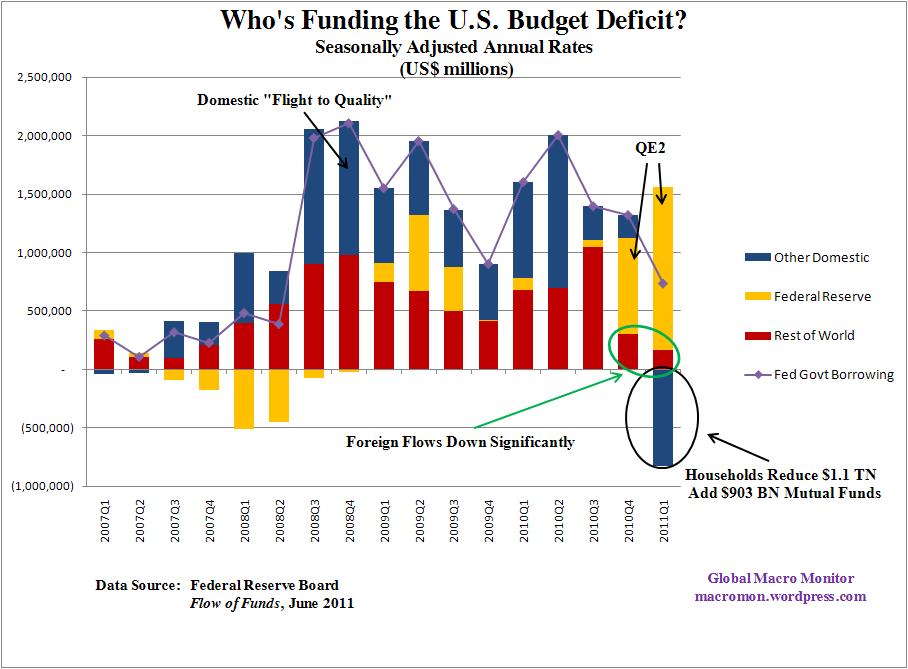
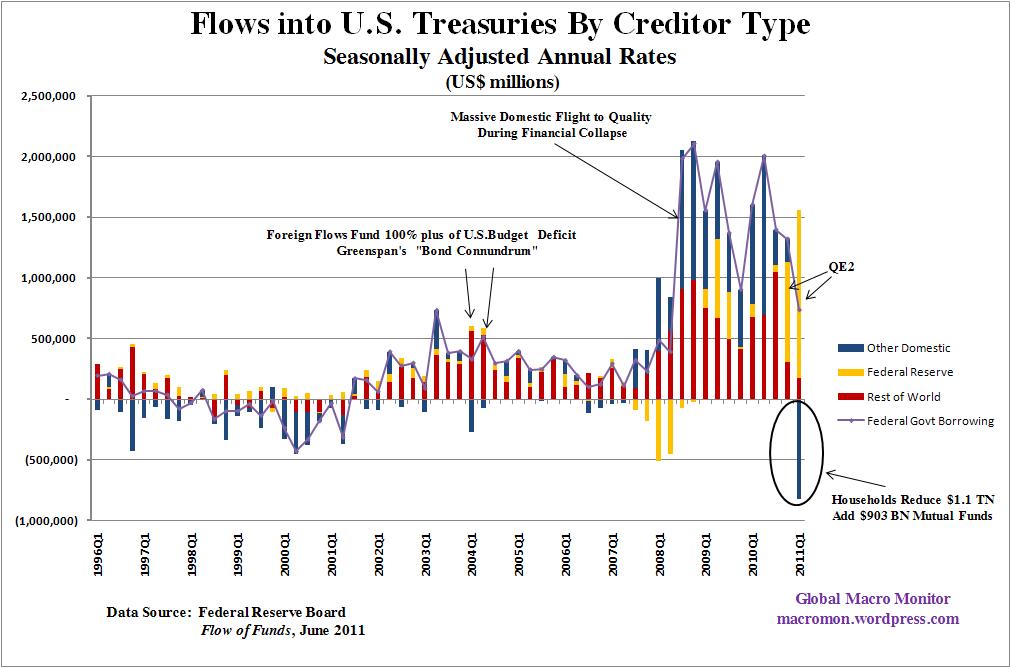
We’ve updated our Treasury flow charts with new data from today’s release of the Federal Reserve’s Flow of Funds Accounts.   The quarterly data are seasonally adjusted and annualized.    They reveal quite an interesting picture.

In Q1 2011, the Fed’s QE2 purchases of Treasuries totaled $1.3 TN on a seasonally adjusted annual basis.  This number far exceeds the QE2 total program and is one of the reasons why we tend to discount government statistics which have been seasonally adjusted, annualized,  and sliced and diced eight ways to Sunday.   It’s all we have to work with, however.

Rather than obsessing over absolute numbers, we focus on the relative movements and flows which are quite revealing.  The Fed’s QE2 program has been quite successful in flushing households and nonprofits out of their Treasury holdings into asset classes such as mutual funds (see table F.100).

It’s also interesting that foreign flows into Treasuries has declined significantly since the start of QE2 and as a proportional source of financing for the U.S. budget deficit is at one of the lowest levels in years.   Though the Fed will continue buying Treasuries with the proceeds from maturing securities — which we estimate to be around $230.4 BN from July1, 2011 to December 2012 — the end of QE2 will be a big test for the markets.

Unless credit markets begin to recover in a significant way,  the source of new liquidity to drive major markets is in question, in our opinion.   Flows into one market — whether it be equities, bonds, commodities, or foreign assets — will likely be at the expense at another and follow a zero-sum game.

The trick now for traders and investors will be to try and get ahead of the reallocation and determine which market gets sold and which receive the proceeds.   Our best guess (and that’s all it is)  is the first post QE2 trade will be commodities and Treasuries get sold and high quality/strong balance sheet corporate equities and bonds are bought.  It’s about to get very interesting.   Stay tuned.

(click here if charts are not available)

Posted in Bonds, Budget Deficit, Charts, Dollar, Equities, Monetary Policy, Sovereign Debt | Tagged , , , , | 4 Comments