This is hot from the latest Federal Reserve Flow of Funds data. Foreigners own 47.1 percent of the $9.4 TN of marketable Treasuries outstanding at the end of Q1 2o11 with the Fed a distant second at 14.2 percent. We’ll be back later with more analysis of the newly released data. Click on chart for better resolution.
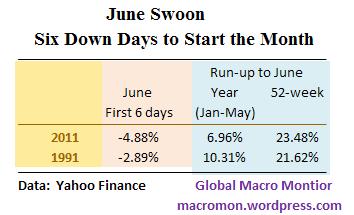
The S&P500 closed 0.42 percent lower today, the sixth consecutive down day to start the month of June. Only once in the past 60 years has the S&P started June with six straight lower closes. After an 18.24 percent early year run-up on the back of the first Gulf War victory the S&P peaked in mid-April 1991, corrected, rallied, then proceeded to trade down six consecutive days at the beginning of June.
Similar to 2011, 1991 was the third year of a first term President, the economy was suffering from the aftermath of an oil price shock and in the midst of a severe bank lending credit crunch, and the unemployment rate remained stubbornly high throughout 1991 and into the 1992 election. President Obama and his advisors should use 1991 as a case study in how to lose the Presidency.
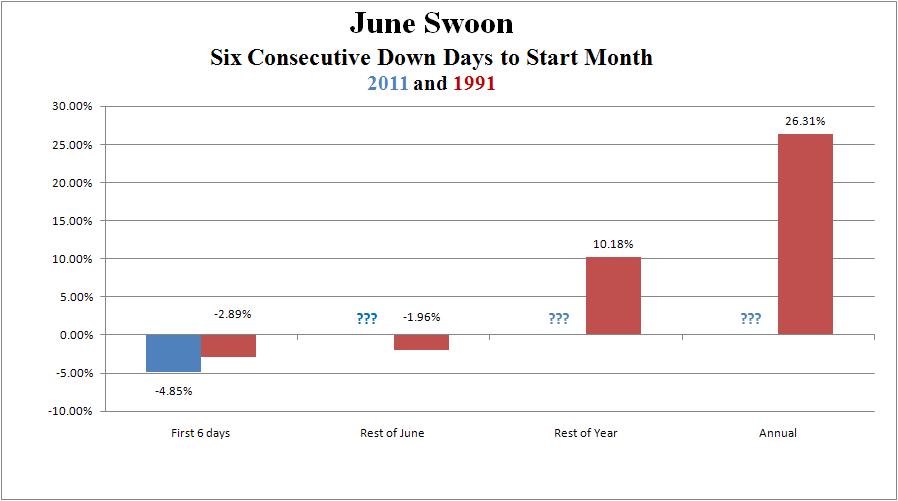
Nevertheless, the chart below shows that after peaking in April 1991, the S&P500 traded in a 7-8 percent range until December when it ramped over 10 percent in the last 14 trading days of the year to generate an annual return of 26.31 percent. We have also superimposed the S&P500’s 2011 performance on the chart.
Will 2011 repeat or rhyme with 1991? We don’t know, but 1991 does show that being patient and preserving capital while the market consolidated a large run-up paid handsomely.
Furthermore, there are enough similarities between the two years to make us think about the case where stocks trade in a similar range before breaking higher later in the year after many of the issues currently weighing on the market are resolved or become more clear. Holding and bouncing off the S&P500’s 200-day moving average at around 1249 would make a 1991-like scenario more convincing.
A negative close on Thursday would make seven straight down days for the S&P500. In our 1950-2011 database, this has only happened 83 times and is unprecedented for the first seven trading days of June. Stay tuned.
In cause you missed this, here is Saturday Night Live’s skit of Dominique Strauss-Kahn’s first night at Rikers Island. Who writes this stuff? Pretty impressive grasp of the European Debt Crisis.
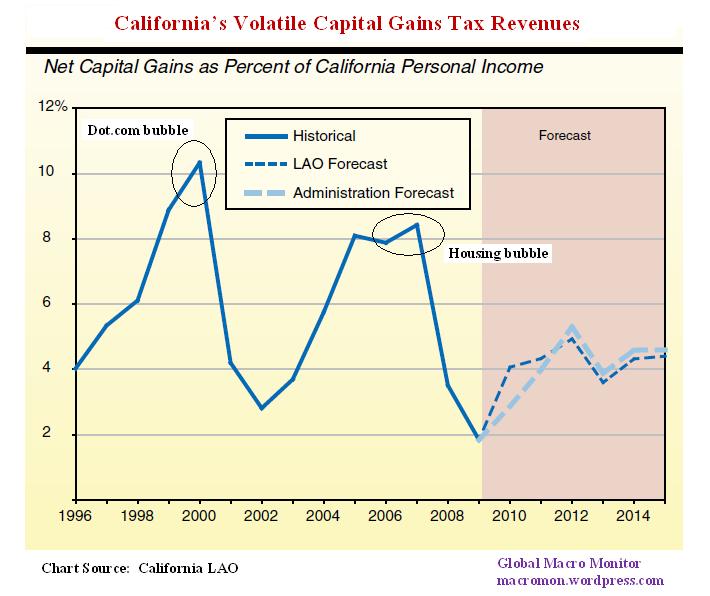
The following chart is from the California Legislative Analyst’s Office (LAO) and is indicative of the state government’s unstable revenue base. The government receives a higher proportion of its revenue from personal income taxes than most states, which is also greatly affected by capital gains taxes during boom-bust cycles. The lesson is not to program expenditures based on these bubble revenues. The Clinton Administration clearly understood this. Governor Gray Davis did not and paid dearly.
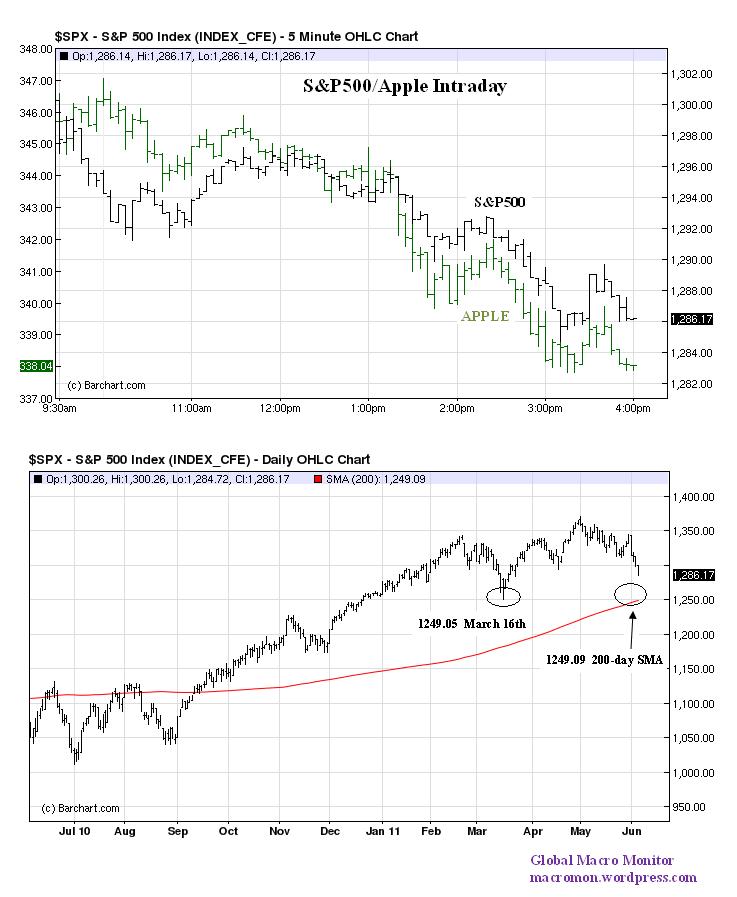
U.S. equities continued their downtrend with the S&P500 closing off 1.08 percent on the day. The chart below illustrates how the mid-day hard sell-off in Apple took the S&P500 with it (see here for Apple’s leadership role). The market was not impressed, at least for today, with the company’s new product introduction at the annual developer conference and sold the stock down $5.40 or 1.57 percent.
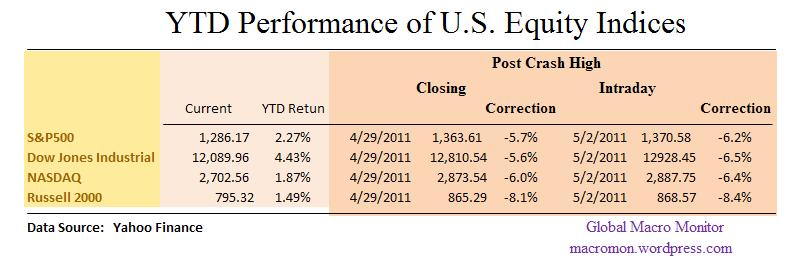
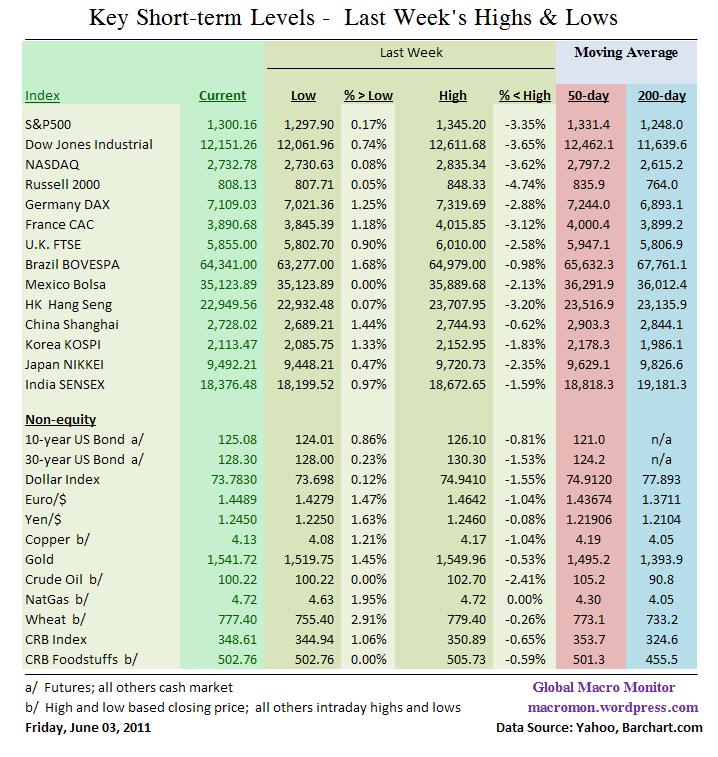
All three of the S&P500 short-term support levels we mentioned in earlier posts have now been taken out. The current sell-off feels a lot worse than the 5.7 percent as detailed in the table below. A large driver of volatility is the dynamic between perception and reality and it kind of feels to us the market perceives stock prices should be lower.
We now view the 200-day moving average, currently sitting at 1249.09 (moving averages are dynamic), or about 3 percent lower, as critical and very important support. The 200-day also, interestingly, coincides with the March 16th low of 1249.05. If you believe in lucky numbers, a move to and bounce off the 200-day at 1249-ish would result in an 8.88 percent correction from the May 2nd intraday high of 1370.58. How Feng shui!
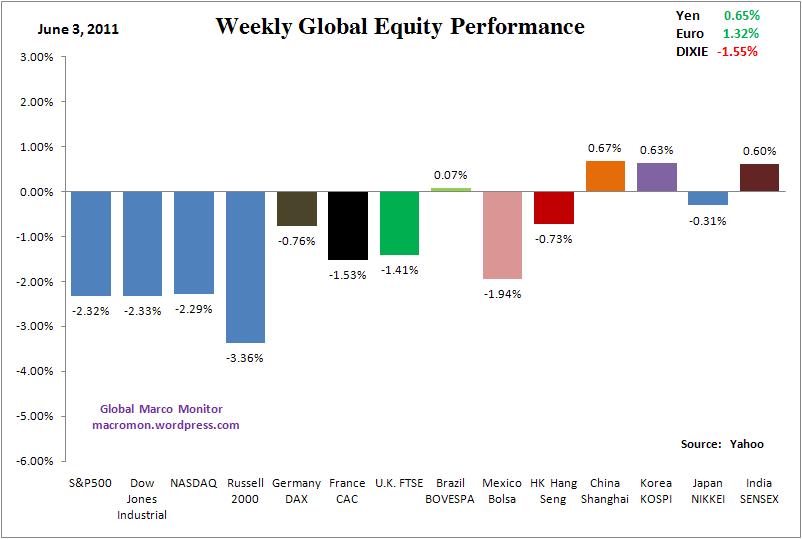
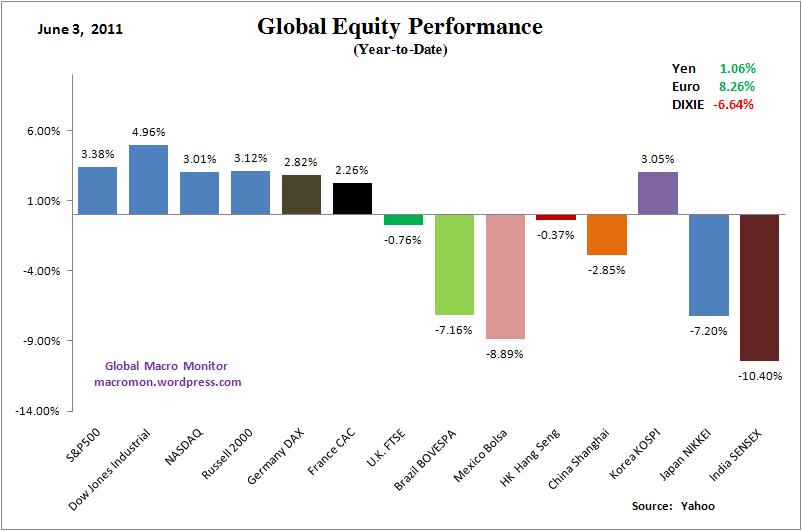
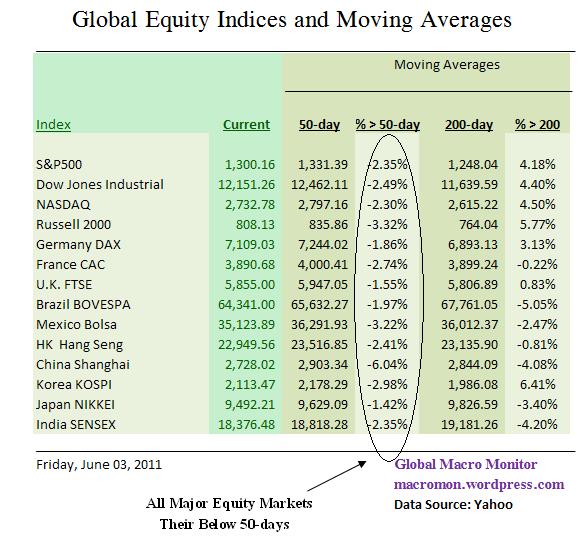
The S&P500 and Dow Jones Industrials suffered their worst weekly loss of the year, both down 2.3 percent. The U.S. and European equity indices had bearish outside moves and all major global equity indices we track closed the week below their 50-day moving averages. Asia fared better only due to the fact they closed before the release of Friday’s weak employment data. Investors and traders have definitely sold in May and gone away in the S&P500, Dow Jones, and all three European equity indices, which have had negative closes for five weeks in a row.
On the positive side, the Brazilian BOVESPA looks like it’s trying to put in a bottom and the Shanghai Composite was able to hold its January’s important closing low of 2677 after trading down to 2689 early in the week. We will be watching Asia closely at the open on Sunday night as their equity markets have a chance to react to Friday’s employment report.
Apple, the general of this bull market, closed up 1.79 percent on the week and could be a catalyst for a market bounce if Mr. Jobs surprises at the company’s worldwide developers conference this week. Many traders are short the stock going into the conference on the expectation nothing of significance will be announced. Shorting Apple? Ouch!
U.S. Treasury bonds closed stronger, but were unable to take out Wednesday’s highs even on the dismal employment data. The dollar closed down for the second straight week and we find it interesting that risk assets have been unable to rally on the weak dollar. Though it’s too early to tell, keep this on your radar as the weak dollar/risk on trade may be a changin’.
The power of zero (interest rates) as a risk-on market prop may be about to face its first serious test. The toxic brew, which would signal something more serious than a garden variety correction, would be the combination of a weaker dollar, equity and bonds moving lower, crude oil and gold moving higher. Not yet a high probability event, in our opinion, and let’s hope we don’t see it, but keep it on your McSwan list. A credible and sustainable long-term debt/fiscal program included in a Congressional debt ceiling deal would go a long way in easing the concerns of the ratings agencies and increase the confidence of foreign investors in their dollar holdings. Further dithering will be costly.
For much of 2010, the slumping economy was affecting white-collar, highly educated workers almost as much as it was affecting less educated and blue-collar workers. That’s no longer the case. In recent months, the economy has once again been easier on college graduates than it has on everyone else, much as it was during nearly all of 2008 and 2009.
The overall result is that the recession and its long aftermath have widened the portion of inequality that stems from education.
Last month, the share of four-year college graduates with jobs jumped to 74 percent, from 73.5 percent in April and 73.2 percent in January, according to Friday’s jobs report. That is the only educational group whose employment percentage is higher than it was in January. – David Leonhardt,NY Times
China
As China’s Workers Get a Raise, Companies Fret – NY Times
China’s rise vs. Asian rise – Korea Times
China’s Water Shortage: Where the River Ends – FP
Chinese Slowdown May Lead to 75% Plunge in Commodities, S&P Says – Bloomberg
Fate of China property is global concern – FT
How China is Driving Demand for Gold – Market Watch
Li Na Dethrones Schiavone at French Open – NY Times
Commodities
Gold signaling hyperinflation? – MarketWatch
OPEC considers increase in oil output – FT
Companies
Could Apple still surprise at its conference? – MarketWatch
Ford announces 1.0-liter EcoBoost, its smallest engine ever – CNET
Goldman’s ‘Big Short’ Could Be a Big Problem – Atlantic
Sino Forest share fall hits Paulson fund – FT
The Apple Decade – CNBC
8 Important Facts From Groupon’s Unusual IPO Filing – Atlantic
Economics
A litany of special factors exposes the recovery’s fragility – Economist
Apologies – we need a toxic rethink on the economy – FT
Dealing with the evils of stagflation – FT
ISM service-sector index offers a bright spot – Barron’s
Macro policy and the recovery – Economist
Nonfarm payroll employment changed little (+54,000) in May – BLS
The great iPhone trade-off – FT
The Return of the Blue-Collar Downturn – NY Times
US home price double dip erases post-crisis gains – FT
Emerging Markets
Brazilian growth shows signs of softening – FT
Investors Pour More Money Into Emerging-Market Funds – WSJ
Europe
Anger mounts in Greece to bailout deal – Guardian
Euro in Crisis: Can it Survive? – Megan Mcardle
Greece: Ireland’s partner in crisis – Irish Times
Greece: Europe’s Lehman Brothers? – Elliot Wave
Intolerable choices for the eurozone, Martin Wolf – FT
The ECB’s stealth bailout – VOX
The EU’s Rules to Default By, Daniel Gros – Project Syndicate
The Euro’s PIG-Headed Masters – Ken Rogoff
Trichet seeks single EU finance ministry – FT
What Will a Nuclear-Free Germany Cost? – TR
General
How To Choose the IMF’s Next Leader – Joseph Stiglitz
Why Agustín Carstens should not be next head of the IMF – Guardian
Geopolitical
Are We Prepared for a Multipolar World Economy? – Project Syndicate
Egypt’s demographic pressure – Where and how to create jobs? – VOX
US warns Beijing over South China Sea – FT
Yemen’s president injured in attack on palace – Wash Post
Markets
Don’t buy into Wall Street’s ‘summer rally’ promos – Wash Post
Martin Sass: Not a Flashy Investor, Just Successful – NY Times
No matter how you slice it, stocks not undervalued – Mark Hulbert
The World After QE2 – Barron’s
What the End of QE2 Means for the Stock Market – Forbes
Wall Street’s Random Walk Doesn’t Exist – Real Clear Markets
Monetary/Fiscal Policy
Bill Gross on Fed Policy, Investment Strategy – Bloomberg
Is There A Difference Between QE And Printing Money? – Forbes
Moody’s warns of US default – FT
Fed Considers Raising Capital Requirements for Banks – NY Times
US CREDIT-Debt worry draws speculators to US CDS – IFR
War of Ideas on U.S. Budget Overshadows Job Struggle – NY Times
Will the Fed do QE3? – Wash Post
Technology
How Friends Influence Gadget Adoption – TR
The digital wallet soon to be in every pocket – Reuters
Nvidia CEO, Qualcomm VP differ on ‘quad’ future – CNET
Peter Thiel Tells Why He Will Pay You to Drop Out of School – NY Times
Protein from Bones of 600K -Year-Old Mammoth Extracted Successfully – ScienceDaily
Tapping Quantum Effects for Software that Learns – TR
The Limits of Tornado Predictions – TR
Video: China’s Li Na Wins French Open Championship
Wow! Some incredible video out of Australia. Makes you kind of think the earth’s atmosphere is becoming as unstable as the global markets! Wonder if quantitative easing would help? (click here if video is observable)

 (click here if chart is not observable)