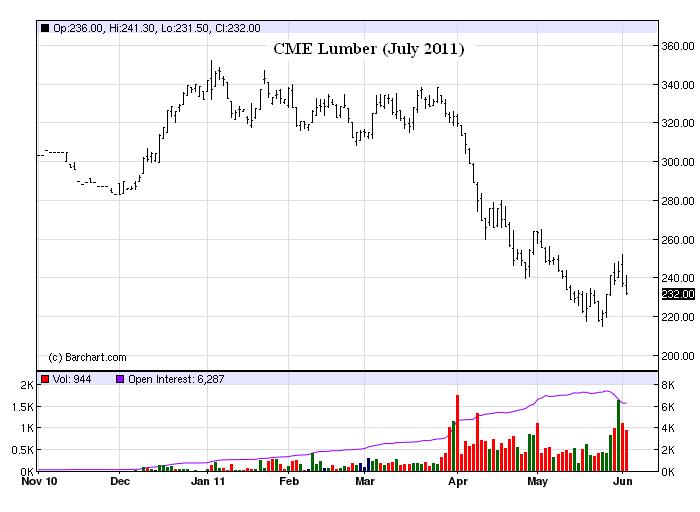
In the chart below we take a look at the relationship between lumber prices and private nonfarm payrolls. Clearly they tend to move together on a monthly basis. One of the transmission mechanisms of monetary policy is the impact of interest rate changes on the construction sector, which has historically been a leader of past economic recoveries.
This is clearly not the case in the current balance sheet growth recession, so we are not as confident in the lumber price/nonfarm payroll relationship. Nevertheless, lumber futures have been under heavy pressure since the end of March, down over 30 percent, no doubt, partially the result of the double dip in housing prices. It will interesting to see how, or if, the correction in lumber shows up in the private nonfarm payroll number tomorrow.
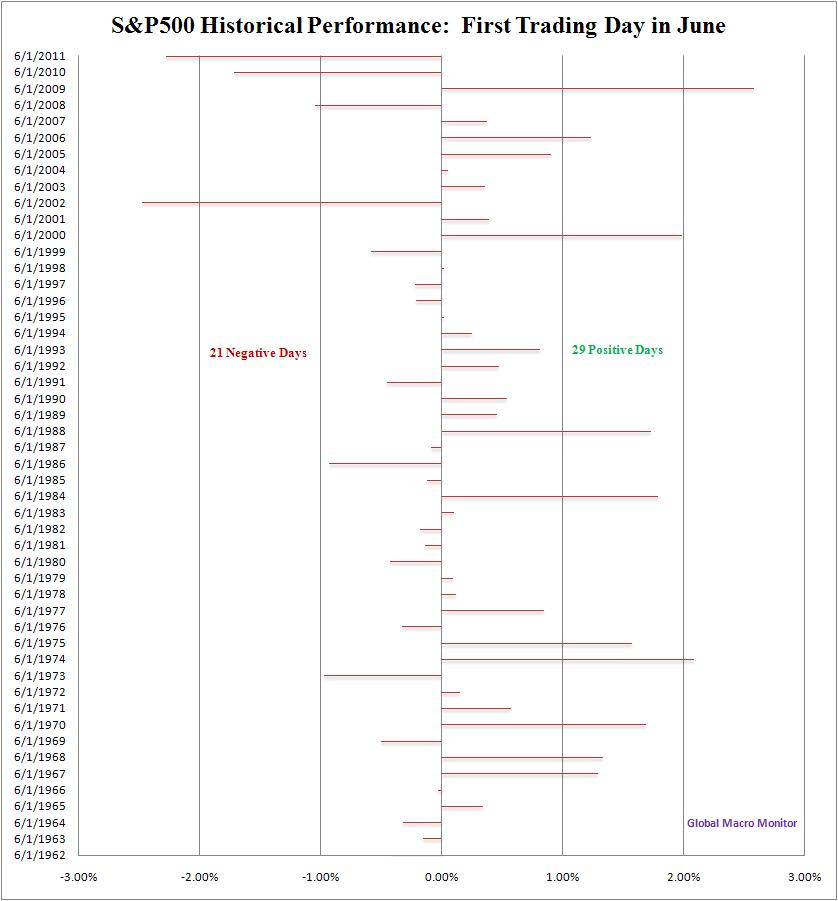
Today’s 2.28 percent decline in the S&P500 ranks as the second worst start of June in the past 50 years. Since 1962 there have 29 up days and 21 down days to start the month. The S&P closed below the 50-day and closely watched 100-day moving average. Given the ugly macro picture, we doubt last week’s low of 1311.80 holds, which leaves 1300 and 1294 as the next level of support before a move down to the 200-day moving average at around 1245.
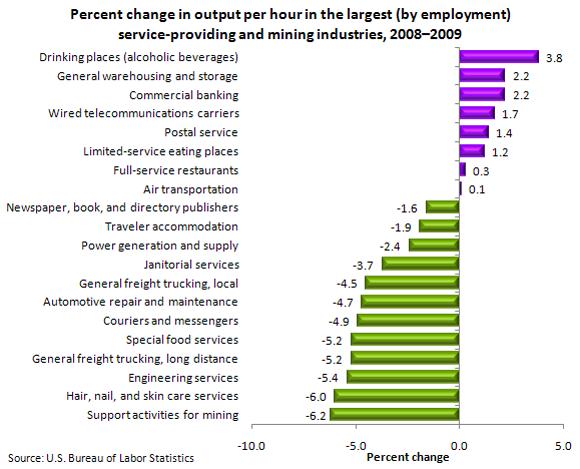
They always told us that bars do well during tough economic times and are a counter-cyclical industry. For proof (abv), go no further than our Chart of the Day from the BLS. The data measures “productivity in the selected industries relating output to the labor hours used in the production of that output.”
Bartenders, working fewer hours, were pouring a lot more stiff ones per shift back then. We also note the decline in productivity in the hair, nail and skin services industry. Our working hypothesis here is that Hank Paulson, Ben Bernanke, Tim Geithner, Wall Street, bank CEOs, hedge fund managers and traders all skipped out on their manicures during those hair-raising and nail biting days of 2008/early 2009. Lower revenues with workers, mostly on commission, standing around; ergo, the lower measure of productivity.
With more days like today, we expect the productivity measures in these two industries to be further validated.
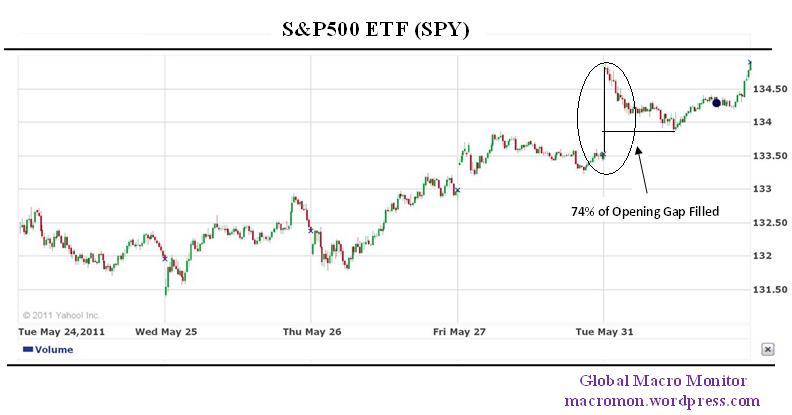
A quick update on our earlier post on today’s S&P500 gap open. The SPY made an intraday low of $133.84 after its 0.93 percent gap up at the open at $134.77. This closed 74 percent of the gap, consistent with our post,
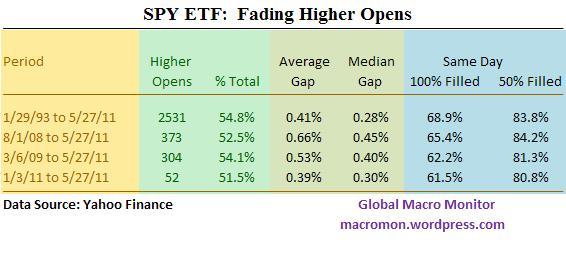
What stands out is that in all periods the opening gap higher is at least 50 percent filled on the same day in 80 percent of the higher opens. Fading up and buying down opens are a favorite of the trading set and you can see here that on higher opens they have the probabilities on their side.
Still an impressive trading session and close at the highs of the day.
Apple was up over $10 today in a rare 3 percent plus move not related to an earnings release and its biggest gain since the 3.28 percent January 24th bounce after the post earnings sell-off. The stock was bolstered by Apple’s announcement that Steve Jobs will give the keynote speech at the company’s Worldwide Developers Conferenceon June 6th.
The concern over Steve Jobs health is repressing the stock price, which, is undervalued, in our opinion. The balance sheet has $71 per share of cash and liquid long-term investments. If Apple can earn $27 per share for the fiscal year ending in September, which we think it can, the stock is trading at a cash adjusted P.E. of 10.5. The all-time closing and intraday high, of $363.13 and $364.90, respectively, made on February 16th , are less than 5 percent from today’s close. A chip shot. (click here for our valuation matrix)
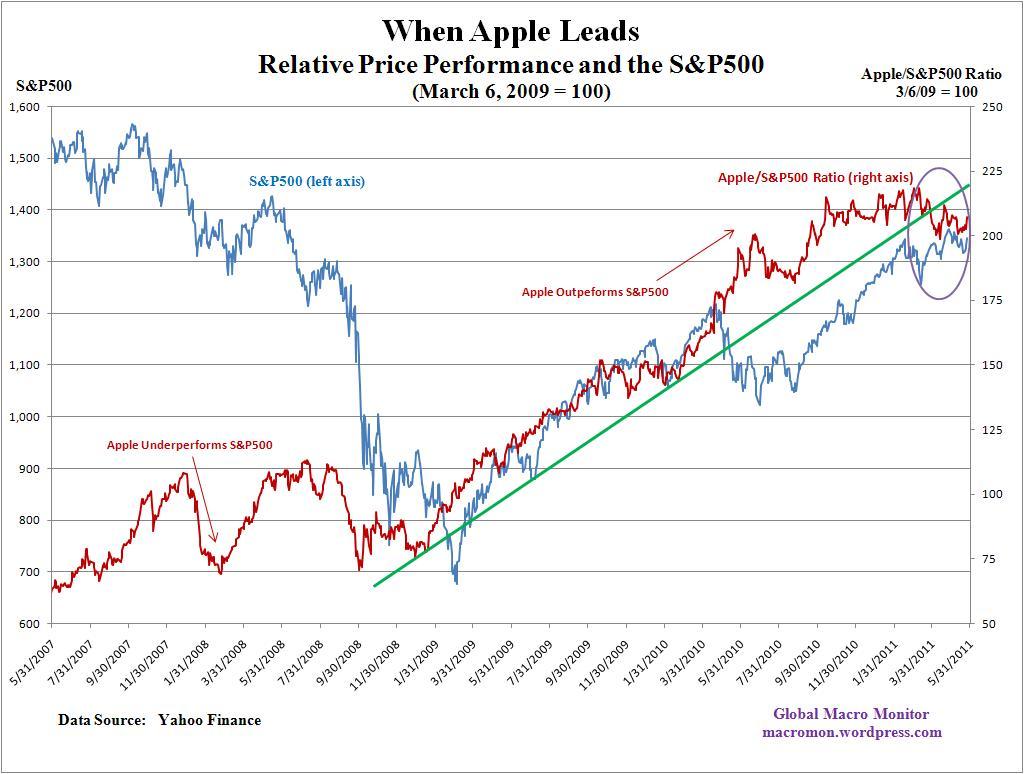
We believe the overall market needs Apple as its leader just as the chart below shows has been the case since the March 2009 crash lows. The company embodies the “new global economy” and its innovation is the medicine to cure a relatively ugly global macro picture. Think iPad-like medical devices/apps that become small town medical clinics, which could then greatly reduce health care costs, for example.
We can’t see the Malthusian case as the story — where investors, traders, and sovereigns continue to dump dollars for commodities, such as crude oil and foodstuffs – that will lead markets higher and a good outcome. In fact, we believe “that trade” is one of the main factors behind the downshift in the global economy and is close to its tipping point, both, economically and politically. QE3, anyone?
Wall Street does need its crack and has a lot of political power so we aren’t heavily betting against another round of quantitative easing. Banks are not expanding credit and the Fed is the only printing press in town. Even if it sends gas prices to $10 per gallon, real wages in the tank, the economy lower, and ushers in an “Arab Spring” in the G7 and/or abandonment of the U.S. dollar.
Technology and “Innovation Nation” (IN) is what will save us, not zero interest rates and more QE3, and the policy obsession should be to facilitate the Innovation Nation. The Apple story is not over, in our opinion, and we need the stock to kick into high gear here to power equity markets higher. Hopefully, today was the start.
Note the chart consists of two data series: 1) S&P500; and 2) the Apple/S&P500 price ratio, indexed to a base price of March 6, 2009, the S&P500’s intraday crash low. Once the market, as reflected by the S&P500, lost Apple’s leadership earlier this year it began to stall.
The overnight markets are all lathered up and maybe offside on the Greece bailout news (haven’t we seen this picture before?) so we thought we’d take a quick look at gap up opens in the SPY (S&P500) ETF. Since the SPY began trading in January 1993 it has opened up 54.8% of the days with a mean higher open of 0.41 percent and median of 0.28 percent. On the same day it has filled the gap higher 68.9 percent of time.
Unfilled opening gaps are rare and markets will usually attempt to fill them. The S&P 500 just recently filled its April 19-20th gap open at around 1312, which now looks like short-term support. In the table below, we’ve broken down higher opens by time periods: 1) lifetime of the SPY; 2) Beginning of financial crisis to Friday’s close; 3) the March ’09 bottom to Friday’s close; and 4) the current year.
What stands out is that in all periods the opening gap higher is at least 50 percent filled on the same day in 80 percent of the higher opens. Fading up and buying down opens are a favorite of the trading set and you can see here that on higher opens they have the probabilities on their side. We will have more in depth analysis on this in future posts. Stay tuned! (click here if table is not observable)
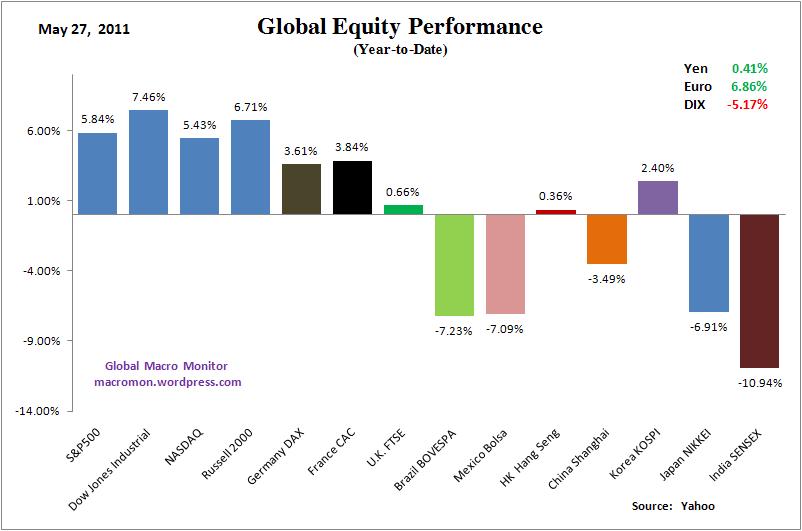
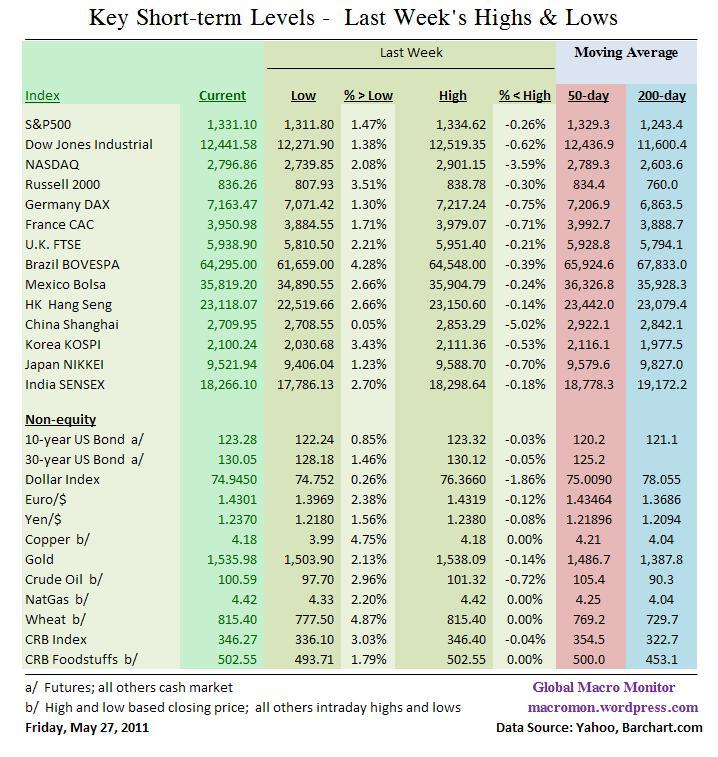
The global equity markets continued their poor performance on very low volume. All the U.S. equity indices were able to capture their 50-day moving average on the low volume end of the week rally. All, however, made lower highs and lower lows versus the prior week.
The Shanghai Composite was down over 5 percent and sits at a key Fibonacci retracement and support level. A break of the January 20th close of 2677 would most likely take the index down to the 2600 area, the last major support before the October 2008 lows. Keep this one on your radar, folks.
Apple, the general of the current bull market, continues to churn in a 10 percent range ($326-$365) with support at 326. We note Apple’s dismal trading volume on Thursday and Friday of 7 million shares each day. Excluding last year’s Christmas to New Year’s session, Apple hasn’t seen such back-to-back low volume days sense August 2005, when the stock was trading with a 42 handle!
On a more positive note, the Brazilian BOVESPA was able to bounce off last July’s lows and close up 2.71 percent, its second best weekly performance of the year. The Mexican BOLSA, up 1.48 percent, put in a higher high and a higher low relative to the previous week. Can the tail wag the dog? That is, Brazil, one of China’s largest suppliers, lead the Shanghai out of its death spiral. Wouldn’t that be interesting?
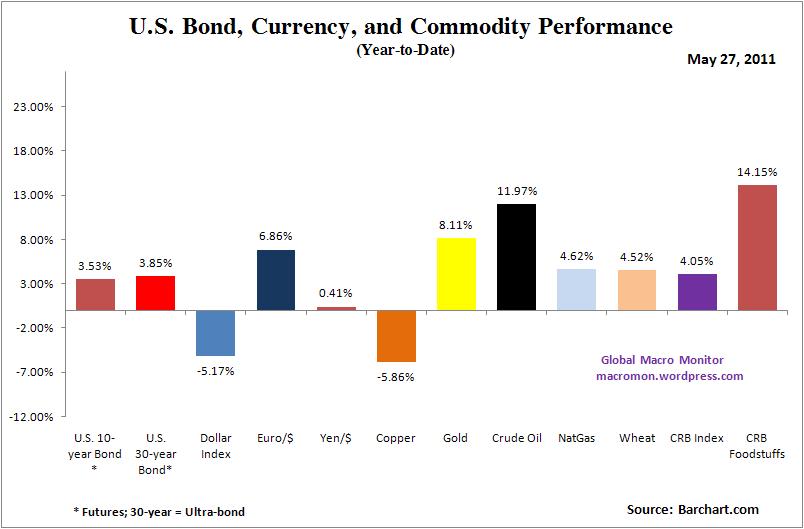
Bonds continued to rally and commodities, led by natural gas, were up for the week. Gold was up 1.62 percent and the dollar index was down 0.65 percent on the week. Bonds up, commodities up?
May has been a cruel month to trade and a hamburger grinder for capital. These trendless and low volume markets are not for us. We don’t see many catalysts on the horizon except the Power of Zero (interest rates).
Take Friday, for example, Der Spiegel comes out with a report that the ECB’s balance sheet is toxic and full of bonds of the periphery. The Euro rallies. After warnings from Trichet and the ECB that a Greek default will result in a “Lehman moment”, EU officials, nevertheless, appear to have capitulated to the inevitable. What happens? European banks rally on comfort from Citibank that all is well within the Eurozone financial sector soul.
Citibank? Sell the rumor and buy the fact? Posturing? Not that easy, not that simple, and not the end of this very ugly story, in our opinion. Just shows that weird things happen when only traders are involved. Be careful out there.
We also take the investment wisdom of one of the marshals at our local golf club to heart, “with zero interest rates, you can’t keep your money in the bank.” In other words, cash is trash. He’s retired and a super guy and we hope and pray he doesn’t get hurt as the Bernank has forced him to become a speculator. You think he has swapped out of 3-month CDs into Neodymium?
If you’re getting a bikini wax in Brazil, you’ll likely find that the cost is rising. And if you’re an economic policy maker, you’ll likely see that as a problem, since the bikini wax is one of the items the Brazilians track to figure out inflation.
As with services ranging from car repair to dentistry, the price of waxing is going up in one of the world’s most important emerging markets. Inflation is moving above the government’s target and may force Alexandre Tombini, the central bank president, to prolong his policy of interest-rate hikes.
– Bloomberg
Bonds
Are These Havens Really the Safest Places to go? – WSJ
Bill Gross Says Savers at a Disadvantage for Years – Bloomberg
Gulf Islamic bond sales seen set for revival – Reuters
Hon Hai sells bond at 1.51 pct yield, exceeds expectations – Reuters
Mexico’s Pemex In Market With 30-Year Global Bond –WSJ
China
China to spend nearly $1 trln on roads, bridges in next 5 yrs –Xinhua – Reuters
China should raise interest rates by another 50bps: OECD – Reuters
China warns banks against “disguised” deposit rate rises – Reuters
Chinese banks may face spike in credit losses as Beijing cools economy, warns S&P – WSJ
Corriente’s Hart Bets Against China’s Yuan on Concerns of Rising Inflation – Bloomberg
Huge implications as world economy moves to the east – SMH
Prepare for an Attack of the China Bears – WSJ
Ten Reasons Why China is Different, Stephen Roach – Project Syndicate
Commodities
Crude prices vulnerable to physical trading tricks – FT
G-8: Rising commodity prices headwind to recovery – Market Watch
Goldman calls bottom of commodity market … six weeks after calling top – Guardian
Is Gasoline Demand Running on Vapors? – WSJ
Top Copper Producer Chile Sees Prices Staying High as China Economy Cools – Bloomberg
UAE to fix food prices as global commodities rise – Reuters
Economics
Contracts to buy U.S. homes fall to a 7-month low – AP
Economies around the world are growing more slowly – AP
Forget the debt ceiling and focus on debt – Glen Hubbard, FT
Emerging Markets
Brazil’s Mantega foresees Brazil growth above global average – Reuters
China’s Interest in Farmland Makes Brazil Uneasy – NY Times
IMF follows the “hot” money in Brazil – BBC
In Brazil, the Bikini Wax Is a Harbinger of Inflation – Bloomberg
Mexico and Chile signal easing inflation concerns – Reuters
Equities
Fiat to buy US government’s Chrysler stake – FT
iPad taking some bite out of PC sales, says iSuppli – CNET
Europe
After Default, Greece Needs “Time-out” from Eurozone – Martin Feldstein
Debt contagion fears return to the eurozone – FT
ECB’s Balance Sheet Contains Massive Risks – Der Spiegel
Greek Leaders Fail to Reach Consensus on Austerity Measures – NY Times
The Euro Zone’s Brittle French Center – WSJ
Spanish police move against demonstrators – FT
What Would a Greek Haircut Mean for Germany? – Der Spiegel
General
Fischer to IMF? If Jupiter and Mars align and Brazil rebuffs Mexico, then maybe – WaPost
Seoul gives Lagarde bid for IMF job a boost – FT
The IMF’s Emerging Conflict – WSJ
Geopolitical
G8 offers $20bn to aid Arab democracies – FT
Japan
Fitch Cuts Outlook on Japan Sovereign Debt to Negative – Reuters
Japan: Prices Up, But Deflation Not Over – NTD
Japan shows how to defuse debt time-bomb – Asia Times
Monetary/Fiscal Policy IMF sees few risks from the end of Fed’s QE2 – Reuters
Science/Technology
A Car Battery at Half the Price – TR
Five Days of Tornado-Generating Storms as Seen from Space – TR Healthy Aging in a Pill – Science News
10 Emerging Technologies 2011 – TR
An informative chart from the BLS showing the unemployment rate by region. Last month, the highest regional unemployment rate in the United States was in the West at 10.4 percent. The Northeast and Midwest had the lowest rates, 8.0 and 8.1 percent, respectively. Note the April y-o-y sharp drop of 1.6 percentage points (p.p.) in the Midwest versus the relatively smaller declines in the Northeast (0.8 p.p.), West (0.7 p.p.), and the South (0.6 p.p).
The Midwest is being helped by the boom in agricultural prices, farm values, and especially, resurgence in manufacturing. The Federal Reserve Bank of Chicago,
The rebounding District [Midwest] economy is being pulled along by its two hallmark goods industries—agriculture and, especially, manufacturing. The manufacturing output recovery has far exceeded overall output growth in both the nation and the District. Since the District’s manufacturing concentration exceeds that of the nation, this unbalanced recovery has exerted an outsized effect on the District economy….The District’s primary agricultural sectors have also contributed mightily to economic recovery. So far in 2011, both corn and soybean prices are trading well above 2010 and well above their previous 5-year ranges. Milk and hog prices are also trading at prices above their previous averages.


 (click here if charts are not observable)