…market observers are increasingly uneasy about stretched valuations. Equity prices have surged on the back of lower risk premiums and abundant liquidity, but profit growth has not always kept pace. This creates a situation analogous to driving a vehicle with a low fuel tank: while the road ahead may appear clear, no one knows exactly when and where the car will run out of gas or err…charge. – GMM
Nothing is more fun than “picking up nickels in front of a steamroller,” right?.
OpenAI CEO Sam Altman reportedly said that an AI bubble is forming.
“When bubbles happen, smart people get overexcited about a kernel of truth,” Altman told The Verge. “Are we in a phase where investors as a whole are overexcited about AI? My opinion is yes. Is AI the most… pic.twitter.com/BFqVFmI852
Must view video, folks. May be the most important 4 1/2 minutes of your life!
“AI is most likely both a bubble and eventually going to be the most important technology of the 21st century.”
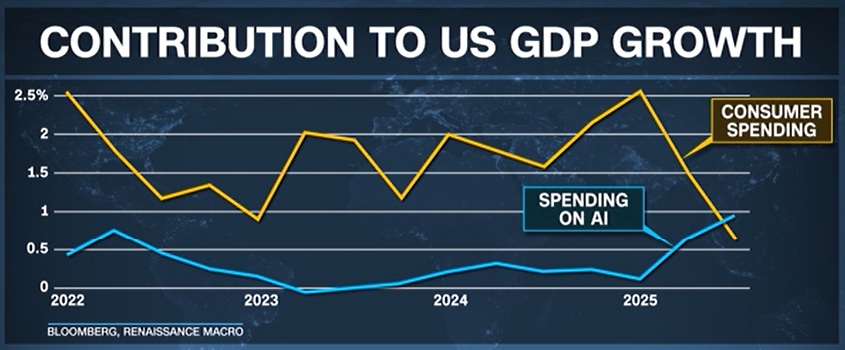
The biggest hyper scalers…the big tech companies, like Meta and Microsoft are spending hundreds of billions of dollars, maybe up to $400 billion this year, on the infrastructure to build Artificial Intelligence…Last quarter, spending on Artificial Intelligence added more to GDP than total consumer spending…That statistic is completely crazy, consumer spending is 70 percent of the economy. — Dereck Thompson
Investor appetite for risk continues to surge as U.S. corporate credit spreads tighten to levels not seen in nearly three decades. Investment-grade spreads have narrowed to just 88 basis points, the tightest since 1997, according to Bloomberg. A parallel trend is evident in emerging markets, where the spread on corporate bonds has fallen to just 200 basis points—a 20-year low. The abundance of liquidity and the absence of default concerns have driven demand for credit, thus suppressing required risk premiums.
This compression of credit spreads is also impacting the equity risk premium—the extra return investors demand for holding stocks over risk-free assets. As credit markets send signals of reduced financial stress, equities have become relatively more attractive. Lower discount rates are supporting higher equity valuations, with major indices such as the S&P 500 hitting new all-time highs. Investors are increasingly tolerating richer valuations in search of returns, a dynamic fueling continued stock market gains.
Regional Economic Insights
Europe is treading water economically, with inflation near target but growth continuing to stagnate. The ECB remains on watch as disinflationary forces persist. Japan, meanwhile, could see a modest rate hike in October, but with consumer demand soft and inflation subdued, policy normalization is expected to proceed slowly. Equity markets there have attracted some capital due to corporate reforms and yen weakness.
China’s economy remains under pressure, with weakening consumer confidence and ongoing stress in the housing market. While policymakers have introduced targeted easing, industrial production and retail sales data disappointed, reinforcing concerns over long-term structural headwinds.
Mexico, in contrast, is one of the more robust emerging markets. Strong remittances, prudent fiscal policy, and positive terms of trade have attracted foreign capital inflows. The Mexican peso remains a top performer, buoyed by confidence in macroeconomic stability and nearshoring trends.
Inflation: CPI-PPI Divergence
U.S. inflation data delivered a mixed message last week. The Consumer Price Index (CPI) came in below expectations, reinforcing optimism about cooling inflation. In contrast, the Producer Price Index (PPI) rose more than anticipated, suggesting sticky wholesale input costs. This divergence has not derailed expectations for a Fed rate cut in September, but it does introduce uncertainty regarding the durability of disinflation trends.
Valuations and the “Low Fuel Tank” Risk
Despite the bullish backdrop, market observers are increasingly uneasy about stretched valuations. Equity prices have surged on the back of lower risk premiums and abundant liquidity, but profit growth has not always kept pace. This creates a situation analogous to driving a vehicle with a low fuel tank: while the road ahead may appear clear, no one knows exactly when and where the car will run out of gas or err…charge.
Markets can continue to climb for some time, supported by technical momentum and investor optimism. However, just like a car running on fumes, the current rally may face sudden exhaustion, whether triggered by an unexpected inflation shock, earnings miss, or geopolitical blow-up. Investors are advised to monitor underlying fundamentals closely, particularly as valuations rise to levels that price in very optimistic assumptions.
MARKETS
Key Themes
Contraction of Credit Spreads
U.S. investment-grade credit spreads narrowed to 27-year lows amid yield chase and “FOMO” behavior.
Emerging market corporate spreads also declined to near 20-year lows, prompting a surge in new issuance from Latin American and Asian companies.
Narrowing spreads reduce the equity risk premium, driving investors into equities and sustaining high valuations.
Equity Market Momentum vs. Valuation Risk
Equities rose modestly again as the S&P 500 posted its fifth consecutive weekly gain.
However, market valuations are “stretched,” with high forward P/E multiples amid narrow breadth, especially in tech.
Valuations are likened to driving with a near-empty fuel tank: while the rally can continue, the risk of a sudden reversal is growing.
Conflicting Inflation Signals
July CPI showed soft core inflation (+0.2% m/m), bringing the 3-month annualized core CPI to 3.1%.
PPI, however, surprised to the upside with goods and services prices both accelerating, complicating Fed policy expectations.
Markets still price in a Fed rate cut in September, though officials’ comments suggest caution.
UNITED STATES
Economy
Labor Market
Jobless claims remain low, but signs of cooling persist as continuing claims edge higher.
Real average hourly earnings fell -0.2% m/m, indicating weakening consumer purchasing power.
Corporate Profits and Spending
Robust corporate issuance in credit markets suggests confidence, though valuations are fueling concerns of overextension.
AI-linked investment remains a key driver of tech sector optimism.
EUROZONE
Macro Conditions
Disinflation Trends
Inflation hovering near ECB’s 2% target; disinflationary forces expected to persist into Q4.
Core goods prices easing due to subdued demand and global goods cycle weakness.
Growth Outlook
Economic activity remains lackluster, with signs of stagnation and low confidence among consumers and firms.
UNITED KINGDOM
Labor and Growth Trends
Mixed Economic Data
Wage growth decelerating gradually.
GDP growth in Q2 remained positive but is showing signs of moderation.
Inflationary Pressures
Services inflation remains sticky, maintaining BoE in a cautious stance.
JAPAN
Policy Outlook
Rate Normalization
BoJ is expected to hike in October due to rising inflation and wage pressures.
Policymakers are balancing gradual normalization with fragile consumer demand.
CHINA
Growth and Structural Challenges
Disappointing Data
Downside surprises in activity metrics due to fading fiscal stimulus and the crackdown on “involution” (over-competition culture).
Real estate sector continues to drag with declining prices and rising vacancies.
External Pressures
Weak exports and tensions with the U.S. over trade and tariffs further complicate policy support.
EMERGING MARKETS
Capital Markets
Debt Issuance Surge
EM corporates, especially in LatAm and Asia, are issuing at record pace as spreads hit historic lows.
External Account Stability
Despite trade uncertainties, strong terms of trade and restrained domestic demand are supporting EM current accounts.
RISKS AND OUTLOOK
Valuation Warning
Equity valuations are increasingly detached from earnings fundamentals.
Market behavior driven by liquidity, AI enthusiasm, and credit compression.
As spreads compress, the equity risk premium continues to fall—leaving less margin for error.
Cautionary Note: Market conditions resemble driving with a nearly empty gas tank where momentum can carry the rally further, but without a clear catalyst or refueling (e.g., earnings upgrades, growth acceleration), a stall could be sudden and sharp.
Geopolitical and Policy Risks
Trade tensions remain elevated; Trump’s tariff rhetoric and upcoming meetings (e.g., with Putin) introduce uncertainty.
Central bank communications, especially at Jackson Hole, may challenge market assumptions about the timing of rate cuts.
Week Ahead: August 19–23, 2025
Economic Data Releases
United States
Existing Home Sales (Thu, Aug 22):
Focus will be on how higher mortgage rates are continuing to weigh on housing demand.
A soft print may reinforce market expectations for a more dovish Fed posture later in the year.
Preliminary S&P Global PMI (Thu, Aug 22):
Flash readings for both services and manufacturing sectors.
Key in gauging Q3 economic momentum.
A potential uptick would suggest resilience in private sector activity despite tighter credit.
Euro Area
PMI Reports (Thu, Aug 22):
Flash PMIs from Germany and France expected.
Continued weakness in manufacturing could weigh on EUR and reinforce ECB caution.
Japan
No major macroeconomic releases listed for the week.
China
No scheduled Tier 1 economic data for the week, but markets will continue monitoring for:
Additional government stimulus announcements.
Property market stabilization efforts.
Central Bank Actions
U.S. Federal Reserve
No scheduled FOMC meeting this week, but Fed speakers will be closely watched for guidance post-CPI and PPI.
The divergence between a cooler CPI and hotter PPI has raised debate on inflation stickiness.
Market pricing continues to lean toward a possible rate cut by November.
European Central Bank (ECB)
No policy meeting this week.
ECB officials are expected to speak publicly amid weakening Eurozone data.
Markets are looking for signals on potential rate cuts as early as Q4 2025.
Bank of Japan (BoJ)
No meeting scheduled.
Continued attention on yen weakness and potential currency interventions if depreciation persists.
Earnings Reports
U.S.
The Q2 earnings season is winding down, but some key reports still due:
NVIDIA (Wed, Aug 21):
Most highly anticipated earnings release of the week.
Critical for gauging sentiment in AI and tech sector.
Strong performance could further boost risk appetite and tech leadership.
Lowe’s (Tue, Aug 20):
Insights into consumer discretionary and home improvement sector amid housing slowdown.
Palo Alto Networks (Mon, Aug 19):
Cybersecurity sector check-in; particularly sensitive to enterprise IT spending trends.
Europe
No major earnings from Euro Stoxx 50 companies scheduled for the week.
Asia
Limited high-impact earnings; investors remain focused on macro trends and Chinese policy developments.
Key Themes to Watch
Credit Market Conditions:
Corporate bond spreads remain historically tight (U.S. IG spreads at lowest in 27 years) .
EM corporate spreads near two-decade lows, fueling issuance booms .
These conditions are compressing the equity risk premium, justifying high valuations—though risk of reversal looms.
Inflation Divergence:
U.S. CPI (Jul): Softer than expected; supports disinflation narrative.
U.S. PPI (Jul): Surprised to the upside, indicating upstream price pressures remain .
Market reaction hinges on which data stream the Fed prioritizes.
Valuation Caution:
Current equity valuations are elevated; likened by analysts to “driving with the fuel light on”—you can keep going, but the margin for error is narrowing .
Any earnings or macroeconomic disappointment could trigger a repricing of risk.
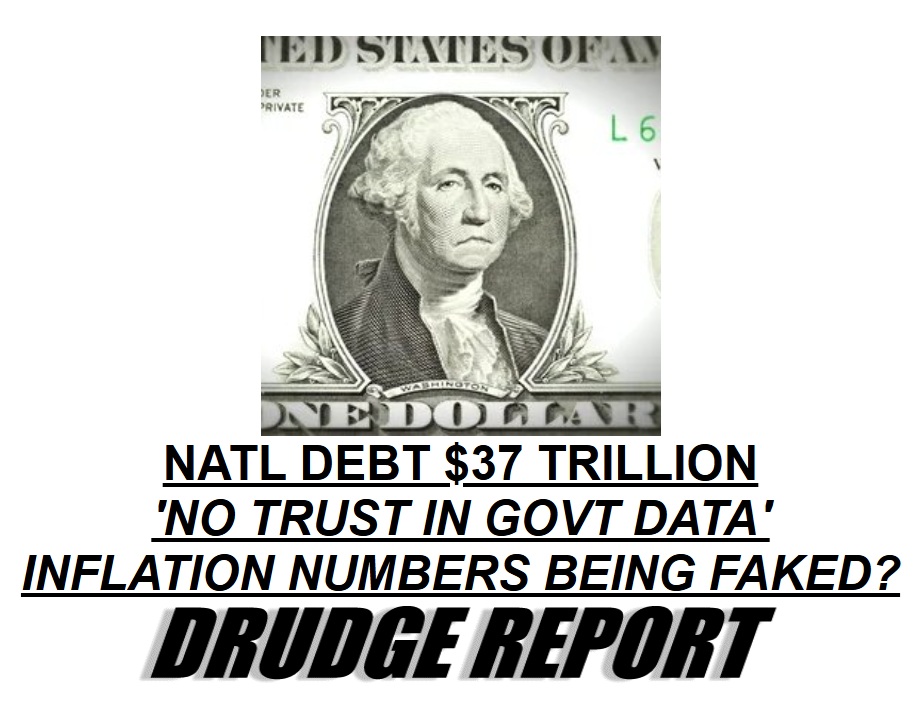
Today’s Drudge Report headline, with George Washington staring from a dollar bill under the headline “NATL DEBT $37 TRILLION” and accusations of falsified inflation data, encapsulates the growing perception that America’s fiscal and political trajectory is veering toward Banana Republic territory. As both a political analyst and an economist who worked in Argentina during its catastrophic hyperinflation of the late 1980s, I find the parallels increasingly unsettling.
Key Economic Indicators The United States is experiencing a dangerous cocktail: record-high national debt; persistently large fiscal deficits; protectionist trade policies; official economic statistics under attack, and the risk of being manipulated by the government; creeping autocracy and authoritarianism; and equity markets at euphoric highs. The S&P 500’s surge masks a hollow core — real wage stagnation, eroded purchasing power, and an over-reliance on debt-financed consumption. The slow erosion of trust in official inflation data compounds the problem; when investors, households, and global creditors doubt government numbers, policy credibility collapses.
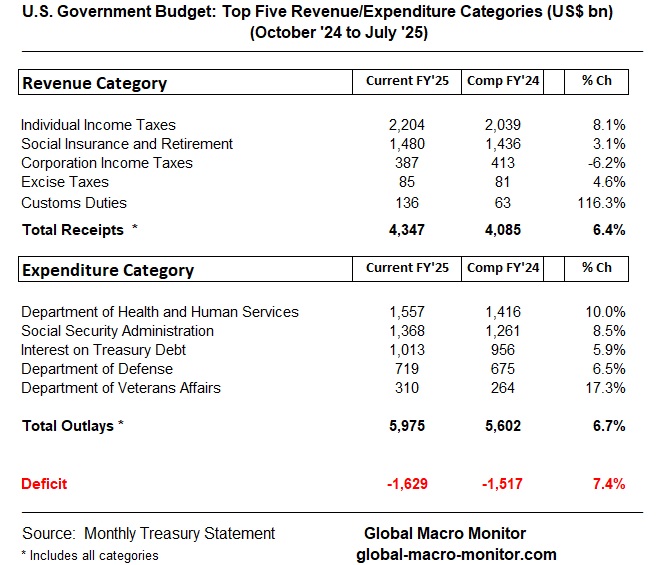
Historical Comparison: Argentina’s Warning In Argentina, I watched the population sleepwalk into financial ruin, lulled by artificially low inflation figures, fiscal policy that relied too much on boosting revenues rather than controlling spending, the lack of an independent central bank, huge wealth and income inequalities, and massive capital flight. Though the U.S. and Argentina economies are vastly different, some similarities we see in the U.S. today are ominous. Once objective data is politicized, the ability to correct course without severe social pain vanishes. Moreover, the hoopla over tariff revenues as the fiscal savior is just that – hoopla. As the table illustrates below, customs duties only account for 3 percent (albeit growing) of the U.S. government budget receipts.
Future Outlook If the U.S. continues this trajectory—i.e, rejecting credible statistics, pressuring companies to sideline dissenting economists, and relying on market highs to reassure the public—it risks a future where reality intrudes suddenly and brutally. We may awaken to an economy impaired not by external shocks, but by our own self-inflicted distortions. The lesson from Argentina is clear: complacency is not a cushion, it’s a trapdoor.
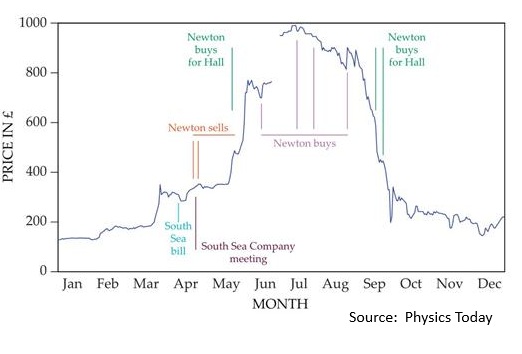
Gravity and the Lesson of Isaac Newton Let us end with a story of how gravity was really discovered.
Isaac Newton, one of history’s greatest scientific minds, was not immune to the powerful pull of speculative mania. During the South Sea Bubble of 1720, Newton initially demonstrated prudence, selling his shares early for a healthy profit. But as prices soared and friends grew fabulously wealthy, he succumbed to what we now call FOMO—Fear of Missing Out—and re-entered the market near its peak. When the bubble burst, Newton suffered catastrophic losses, later lamenting that he could “calculate the motions of the heavenly bodies, but not the madness of men.”
His experience was a sobering demonstration of a truth he already understood in physics: what rises rapidly under its own momentum will inevitably be pulled back down by gravity. Today’s U.S. markets, now more speculative than at any time in history, mirror that same dangerous psychology. Algorithm-driven surges, meme stock frenzies, and short-term profit chasing have replaced long-term fundamentals, creating an economic environment where upward momentum feels unstoppable—until it isn’t.
Newton’s loss was more than financial; it was a recognition that the laws of nature apply to human behavior in markets as well as to falling apples. In a culture that prizes speed and quick gains over discipline, his hard-earned lesson is more relevant than ever: gravity is patient, and in markets, it always wins in the end.
Domingo Cavallo, Argentina Finance Minister (1991-96, 2001), touting the country’s convertibility of one peso = one dollar during its currency board regime. The currency board eventually collapsed in 2001 under the weight of massive capital flight. The peso now trades at 1,313.00 per/$US