I flew the Concorde a couple times. Took off from London at 7 pm and landed at JFK at 5:30 pm, the closest I have come to time travel!
It’s been almost 20 years since the Concorde was retired, putting an end to commercial supersonic flight for the very rich. But out in Colorado, the startup Boom Technology has raised $160 million in its quest to build a replacement, one that should be cheaper, more comfortable and able to fly more routes. Here’s an exclusive first look at Boom’s prototype test plane, the XB-1. – Bloomberg QuickTake
We are not taking a victory lap yet but we have been warning President Trump’s focus on the stock market was not only bad economics but also a losing political proposition. Next Tuesday the option expires.
But the juxtaposition of a weak economy with high asset prices that result from low interest rates could provoke public anger, especially if it coincides with unemployment concentrated among poorly paid service-sector workers. – Economist, October 8, 2020
We will get a record-shattering 30 percent plus Q3 GDP release tomorrow but don’t forget the downside-upside asymmetry. If the economy falls 50 percent, it takes a 100 percent increase to get back to even.
And a stock market clinging close to its highs with an unemployment rate that has nearly tripled will reopen the wounds of the Great Financial Crisis (GFC) that the “fat cats” were once again bailed out at the expense of Main Street.
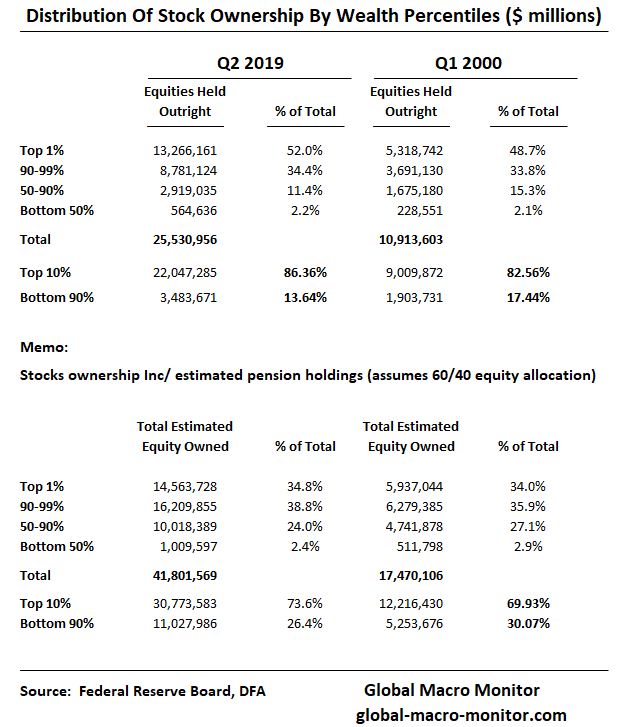
…Moreover, a narrative is beginning to take shape that the Trump administration and his Republicans are more of a Trojan Horse for the 1 percent and Greenwich set. That is, tax cuts for the wealthy and large corporations while cutting social services and healthcare for the middle class and pumping up and bailing out stocks at the expense of Main Street, where the top 10 percent directly hold almost 90 percent of total stock wealth while the bottom 90 percent have only a little over 10 percent.
At the same time, the Trump administration presents itself as sort of a dysfunctional Honey Boo Boo reality show to entertain its base. Though what some may perceive as a nice circus act but not quite exactly the savior of the working and middle class that many voted for. – GMM, May 2020
401(K)s
We hear a lot these days the term “Trojan Horse” applied to the current administration. You did hear that here first, by the way.
Trump’s focus on the stock market was misplaced. He talks about how everyone’s 401k skyrocketing. Really?
In 2019, the average 401(k) account balance was $92,148, according to Vanguard data.
Each year, the investment company analyzes account data from 5 million retirement accounts. Across these accounts, the typical account balance varies widely by the method used to calculate it — while the average 401(k) savings balance is over $90,000, the median account balance is much less at $22,217, according to Vanguard’s latest data, which was calculated in 2019. – Business Insider
Most people just don’t have much direct exposure to equities even if they have had their 401(K)s maxed out in the FANG stocks. Moreover, the median 401k could barely pay a half year’s rent in any decent size city in the United States.
Not Feeling It
The bottom line is most people haven’t and don’t feel the stock bull market, if, that is, we are still in a bull market. The S&P peaked on September 2nd at 3588.11 and is off almost 8.9 percent from the high.
The following exchange took place between President Reagan and reporters after the market close on Black Monday, October 19, 1987. Leaving to visit the First Lady in the hospital, President Reagan spoke just after the market lost over 20 percent of its value on the day.
Q: What about the market? Tomorrow will it go down again? President Reagan: I don’t know. You tell me.
Q: Is the market your fault? President Reagan: Is it my fault? For what, taking cookies to my wife?
Q: Reaganomics?
President Reagan: I just told you. Good Lord, we reduced the deficit over last year by $70 billion. And all the other things I’ve told you about the economy are as solid as I told you. So, no, I have no more knowledge of why it took place than you have.
Thirty-three years ago today, now infamously known as Black Monday, my grandfather, M. Peter McPherson, was Deputy Secretary of the U.S. Treasury and acting Secretary that day, while Treasury Secretary James Baker was in the air traveling to Europe. McPherson was the most senior Treasury official left in Washington to handle the crisis.
The stock market had already peaked in August after an almost 100 percent rally in the prior two years. By late August, the DJIA had gained 44 percent in a matter of seven months, raising concerns of an asset bubble, and had become very volatile as interest rates had been rising rapidly since bottoming in September of the prior year.
Similar to 1929, where the stock market peaked in early September, the markets had already begun to unravel, foreshadowing the record losses that would develop that Monday in October.
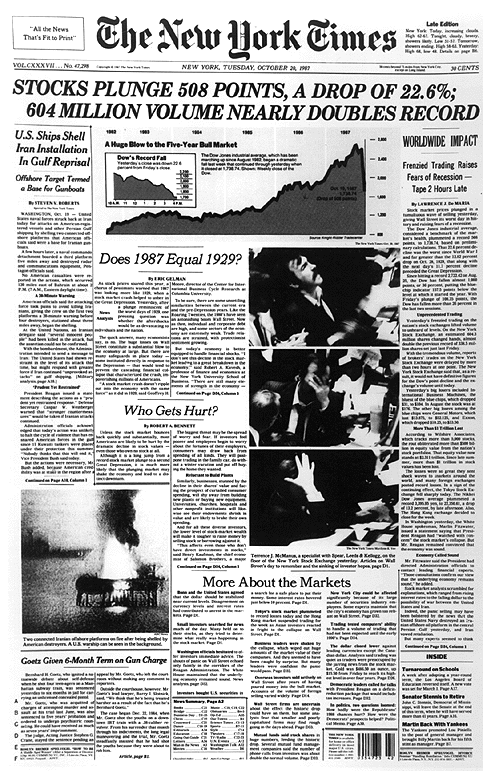
As the markets around the world began to crash, my grandfather convened with the U.S. Treasury’s Undersecretary of Domestic Finance and the Department Chief of Staff to discuss the government’s appropriate response. The Dow Jones eventually closed 508 points down, or a 22.61 percent, almost double the historic Crash of 1929, where the Dow fell 12.8 percent in one day.
Government Kicks Into Action
According to my grandfather, the situation demanded that his team put together a plan to calm the markets. The economy was doing fine, and there were no signs of recession. Real GDP growth came in at 3.5 percent in 1987.
Jitters about the U.S. trade deficit, rising interest rates, and the path of the U.S. dollar during the Plaza Accord are oft-cited as the fundamental reasons that triggered the crash, but nobody knows for sure. Trees don’t grow to the sky, and neither do markets. Stocks markets do what stocks markets do, keep their own schedule, and march to their own drummer.
The team’s conclusion at Treasury that day was the market was under severe strain for technical reasons and complicated by the new computerized program trading related to portfolio insurance. Nevertheless, the steep losses were causing significant dislocations in the financial markets.
Many large firms were under heavy liquidity pressure and were dangerously close to not making their margin calls and on the brink of failure.
My grandfather and his team placed a call to the then-new Federal Reserve Chairman, Alan Greenspan, only two months into the job, to encourage the issuance of a Fed statement that it would do whatever it takes to provide the liquidity to keep markets functioning.
It wasn’t the time to think about the policy’s broader economic implications, such as the potential moral hazard, as the plane was on fire and going down and desperately needed a rescue plan.
It was also clear Greenspan had been thinking along similar lines.
Fed officials drafted much longer statements for release, but Greenspan reasoned that a short, clear message would do the most to stabilize markets.
It is also important to point out that when Secretary Baker arrived in Europe late that day, he immediately began communicating with key finance ministers, such as those from Germany, Japan, France, and the UK to coordinate a global response to the financial crisis.
October 20
Greenspan issued his statement the next morning, October 20,
“The Federal Reserve, consistent with its responsibilities as the Nation’s central bank, affirmed today its readiness to serve as a source of liquidity to support the economic and financial system.” – FRB
In typical Greenspan fashion, the statement was vague in methodology yet resolute in purpose.
The market opened down and continued falling, there were no buyers and it appeared, at one point, the global financial system was headed for a complete meltdown.
“Tuesday was the most dangerous day we had in 50 years,” says Felix Rohatyn, a general partner in Lazard Freres & Co. “I think we came within an hour” of a disintegration of the stock market, he says. “The fact we didn’t have a meltdown doesn’t mean we didn’t have a breakdown. – WSJ
Then at about 12:38 pm, with many stocks not trading and pressure growing to close the markets a miracle seemed to happen.
With the closing of the Big Board seemingly imminent and the market in disarray, with virtually all options and futures trading halted, something happened that some later described as a miracle: In the space of about five or six minutes, the Major Market Index futures contract, the only viable surrogate for the Dow Jones Industrial Average and the only major index still trading, staged the most powerful rally in its history. The MMI rose on the Chicago Board of Trade from a discount of nearly 60 points to a premium of about 12 points. Because each point represents about five in the industrial average, the rally was the equivalent of a lightning-like 360-point rise in the Dow. Some believe that this extraordinary move set the stage for the salvation of the world’s markets. – WSJ
The rest, as they say, is history.
My grandfather felt that the Treasury’s phone call contributed to Greenspan’s thinking and as he made the decision to issue a statement to calm the market. The statement was the most critical event in stabilizing the markets and preventing substantial economic damage to the U.S. and the global economy.
My grandfather spoke about how the simplicity of the message prevented speculation while instilling confidence. Not unlike ECB President Mario Draghi’s, “whatever it takes” July 2012 speech, which saved the Euro currency, the European banking system, and ultimately the European Union during their debt crisis in 2011-12.
The Birth Of Stock Market Moral Hazard
Some argue, including one of the regular authors on this website, the Fed’s response to Black Monday ushered in a new era of faux investor confidence and the moral hazard that the central bank will always backstop falling markets. Thus, forever distorting market risk and real price discovery and contributing to the current boom-bust asset market cycle the global economy now experiences and will be extremely difficult to reverse.
Global Macro Monitor (GMM) often argues, which is not necessarily my own opinion, what was supposed to be a one-off market intervention in 1987 has now become the norm, which monetary policymakers will find it impossible to extract itself from, ultimately resulting in a major market and economic dislocation. We shall see.
President Reagan’s Confidence And Sense of Calm
During the crisis, President Reagan, whose administration my grandfather served several key roles in, was an excellent communicator and never once conveyed a sense of panic in October 1987.
Though not having a financial background, President Reagan did have a degree in economics and understood the nature of markets and how they coveted a sense of calm and leadership from the government during such a crisis.
The following video is President Reagan speaking to the press at the White House on Black Monday as he is preparing to board Marine One to visit the First Lady in the hospital.
Skip to the dialogue, which starts 5:40 minutes in.
Note President Reagan’s incredibly calm demeanor and sense of confidence after the most massive stock market crash in U.S. history.
His quote defines the group think of today’s marginal buyer with the qualification that stocks always go up. Well, at least, most of the time as the holding period time horizon expands.
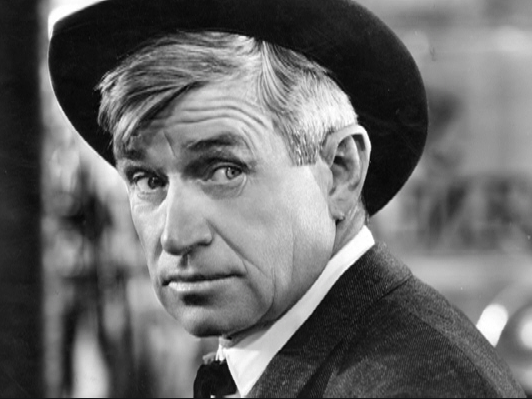
Don’t gamble; take all your savings and buy some good stock and hold it till it goes up, then sell it. If it don’t go up, don’t buy it. – Will Rodgers
The Corner Solution End Game
Mr. Rodgers lived and suffered the consequences of the Fed’s grand failure to provide liquidity to failing banks – even the solvent ones — in 1931-32 that caused the U.S. money supply to contract 25 percent and put the “Great” in the Great Depression.
Now the Fed has swung to the other extreme and seemingly provides liquidity to the markets every time the S&P, say, drops 10 points. As a consequence, a “muddle through” scenario has been taken off the table, and the end game will be a corner solution,
Corner Solution
A solution to a minimization or maximization problem where an interior solution is infeasible. – definitions.net
The U.S. economy is now so dependent on debt monetization and asset price bubbles there is no longer the potential for a soft landing. It’s either fire or ice, hyperinflation or debt deflation. We think the former.
Just a quick note on what we believe has been one of the largest factors, along with globalization to the disinflationary forces over the past 30 years. That is the secular decline in the price of semiconductor prices. Semiconductors are the basic building block of today’s economy, as was oil during the industrial revolution.
Semiconductor Prices
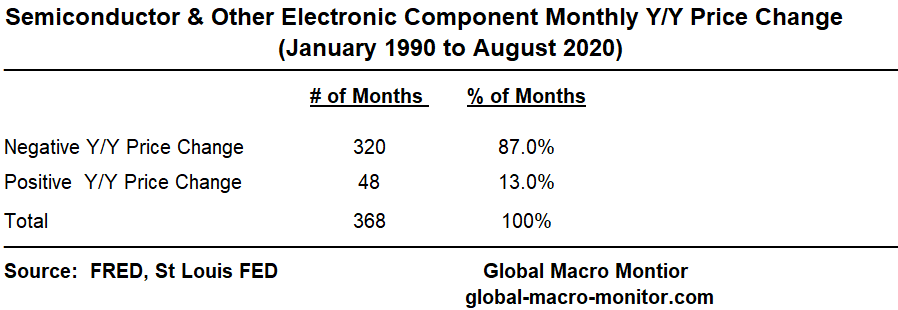
The price of semiconductors and other electronic components has been declining for more than 30 years as illustrated in the monthly year-on-year price changes in the chart below.
Stunningly, 320 of the 368 months since January 1990 or 87.0 percent of the observations, the price of semiconductor and other electronic components have experienced negative year-on-year growth.
Deflation, no. Relative price changes, yes, brought on mainly by technology and to some extent globalization.
The Great Misread
The kneejerk reaction of most economists, including yours truly, when observing such steep secular declines in prices — down 48 percent over the past 30 years — is to attribute it to collapsing demand. Not so, with this commodity, however.
The above chart and table below illustrate the rapid and sustained growth in semiconductor production over the past several decades.
Since 1990, for example, semiconductor shipments in the U.S. have grown by 37K plus percent or 21.4 percent annually. Pretty amazing as prices have fallen by almost 5o percent.
Clearly, the positive supply shock of technology and globalization has put downward pressure on the “new oil” of the modern economy, which is a major factor contributing to the macro disinflationary pressures the economy has experienced over the past 30 years.
Here’s to hoping the trend continues but de-globalization and geopolitical instability make us less sanguine, however.
Taiwan, The Most Important Geopolitical Important Country In History?
Lastly, a little sidebar on the geopolitical and strategic importance of Taiwan as the Straight gets hot, hot, hot. See here and here.
If Intel falls further behind and leading-edge semiconductor manufacturing becomes concentrated in Taiwan then Taiwan will become geopolitically important in a way that the Middle East never was. Modern semiconductor manufacturing is at least as important to the economy as oil was in the 1970s. But in the case of oil, at least it was available all over the world albeit at higher prices than in the Middle East. Imagine a world where oil only came from one country, and how important that country would have been for the last hundred years. That is what the world would look like if Intel cannot find its footing and continue to manufacture chips at the leading-edge here in America. Taiwan could become by far the most geopolitically important country in the history of the world. – themarket.ch
We have been writing for ten years about the coming “Clash of Generations” but we never, ever, in our wildest imagination believed it would result in an “elderly are expendable” vibe. Senicide.
The word “senicide” — meaning the deliberate murder of the elderly — is less well known, though of older provenance. According to the Oxford English Dictionary, it was first used by the Victorian explorer Sir Henry Hamilton Johnston. “The ancient Sardi of Sardinia,” he wrote in 1889, “regarded it as a sacred . . . duty for the young to kill their old relations.” – Boston Globe
Who would have ever believed it would also have the implicit support of the President of the United States, the oldest ever to sit in the Oval Office nearing the end of his first term. Ronald Reagan was 77 years when he left office.
My 17-year old is more worried and careful about COVID than I because she doesn’t want to get her dad sick. She is more willing, though not happy to sacrifice hanging with her friends to protect her grandmother and parents.
In the final average of registered-voter polls, Trump led Clinton by 5 points among seniors. His advantage was 6 points among likely voters. These polls are suggesting something along the lines of 25- to 30-point shifts in Biden’s direction…Importantly, I already have noted how this movement among seniors is being seen on the state level as well. In Florida, for instance, where seniors make up around 30% of voters, Biden’s winning with voters 65 and older. Last time around, Clinton lost those voters by nearly 10 points in the final preelection polls. – CNN
"It's incredibly selfish of older people or neurotic people who are timid & afraid & won't come out of their basements to confine children & young people to miss out on the most important part of their lives" – Fox News is now straight up blaming old & vulnerable people for Covid pic.twitter.com/mLhiwDHmrN
We suspect a Blue 1980-ish outcome in the popular vote where Trump wins around 41 percent of the popular vote (close to where he is currently polling), which is about the same percentage as President Carter won, but wins a bit more than the six states than Carter did in the electoral college. – Global Macro Monitor, April 13
Tax Selling?
If markets were efficient, there should be massive tax selling or front running of the almost doubling of the capital gains tax for the stock ownership class that is coming in a Biden Administration. Not the case. so far, as markets have been nationalized and do not reflect even a speck fundamental value.
The Wall Street cheerleaders always find a way spin everything bullish because their bonus depends on it.
Ridding the world of Trump is good for the world, the country, and my children.
Have no delusions, however, a Biden Administration with Democrats controlling both Houses of Congress will not be kind to Capital. Though the election result will be similar to 1980, the political and economic policies to come will be the polar opposites.
Nevertheless, I still think the tax front running selling is coming in the next few months unless the stock market is signally hyperinflation, which is not a zero probability. The Fed’s relentless propping up of asset markets has created an endgame of what economist’s call “corner solutions.” Fire or ice, hyperinflation or deflation. Brace yourselves.
Never thought I would live like a climate refugee but here I am again couch surfing trying to put together a Plan B as the family is staying at the Hyatt in another city. Four freaking straight years of this, you’d think a trend is developing.
I’ve joined an elite club, where the last two homes I lived have been destroyed by violent wildfires.
Wake Up World
Wake up world, Rome is burning. Think of your children and grandchildren’s future.
No worries though, the stock market is rocking, no?
Was it Groucho that once said, “Bull markets are the opium of the people?” Or was that some German dude, a Jerry Garcia, Grateful Dead look alike?
Wherever you live, wherever you hide, however you delude yourself, climate change is coming for you. Ignorance and denial, or “the Chinese hoax” is not going to shield your children or grandchildren from the violent forces of nature as Mother Earth convulses from the previous generations mistreatment.
The debate is over, Mother Nature is rendering her opinion: we live in a spaceship economy and not a cowboy economy.
In the memorable phrase of economist Kenneth Boulding, the United States was “cowboy economy,” with a frontier ethic of limitless resources.
Boulding suggested instead a “spaceship economy,” in which people conserve and reuse material and energy, like astronauts aboard an orbiting capsule. – NY Times
This One Hurts
Though I am not much of a Material Girl — “you never see a U-Haul behind a hearse” — this loss really hurts personally. It was my favorite home that I have ever lived. Our long tree lined driveway always reminded me of Magnolia Lane at Augusta, home of the Masters Golf Tournament.
O, the fantasies, gone forever.
It may be a few weeks before GMM is back up and running. Gotta buy some socks, underwear, toothpaste, a new computer, and, ya’ know, find a place to live.
I am thankful to be part of the Lucky Sperm Club (LSC) and have the means to make the transition relatively easy. Not going to be so for most of the climate refugees of the future. Brace yourselves.