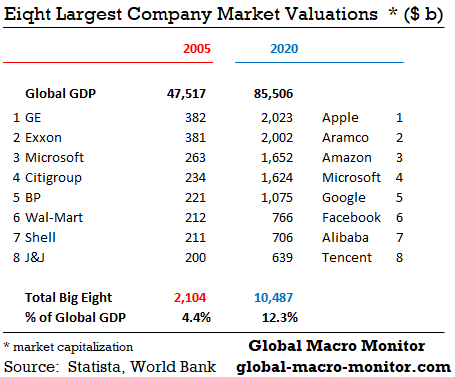
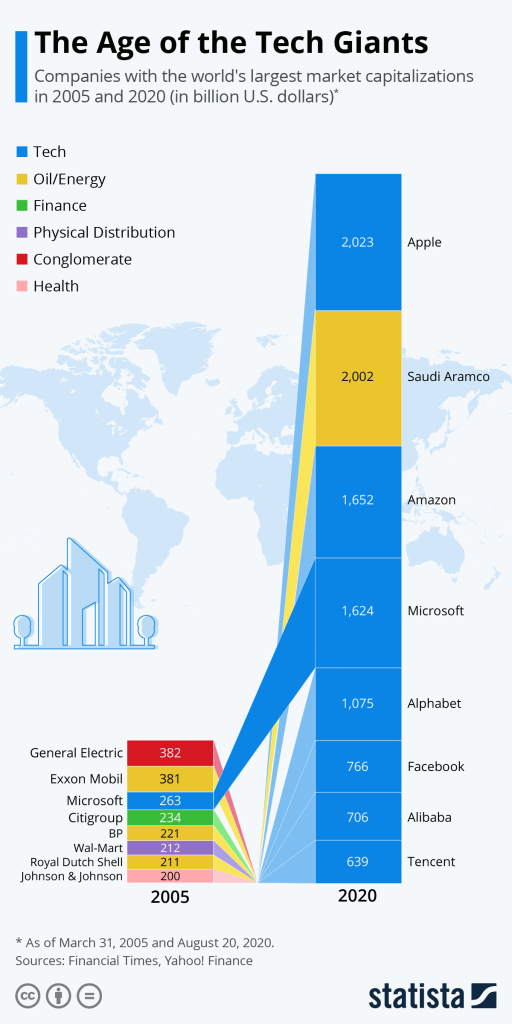
Stunning transformation of the world’s largest stocks over the past decade-and-a-half. When normalized to global GDP it also illustrates the economic and market power of the largest stocks. The data in the below table show that the the top eight most valuable companies were just 4.4 percent of global GDP in 2005 compared to 12.3 percent today.
Moreover, three of the largest U.S. companies, Microsoft, Google and Facebook do not have supply chains in the traditional sense, which puts downward pressure on labor demand. Even Apple, which outsources most of its production, employs only 140k workers — many of which are lower paid workers in the retail stores — compared to GE’s 320K in 2005, and only 12k employees at its Cupertino campus, where the good paying jobs are located, or were before the pandemic.
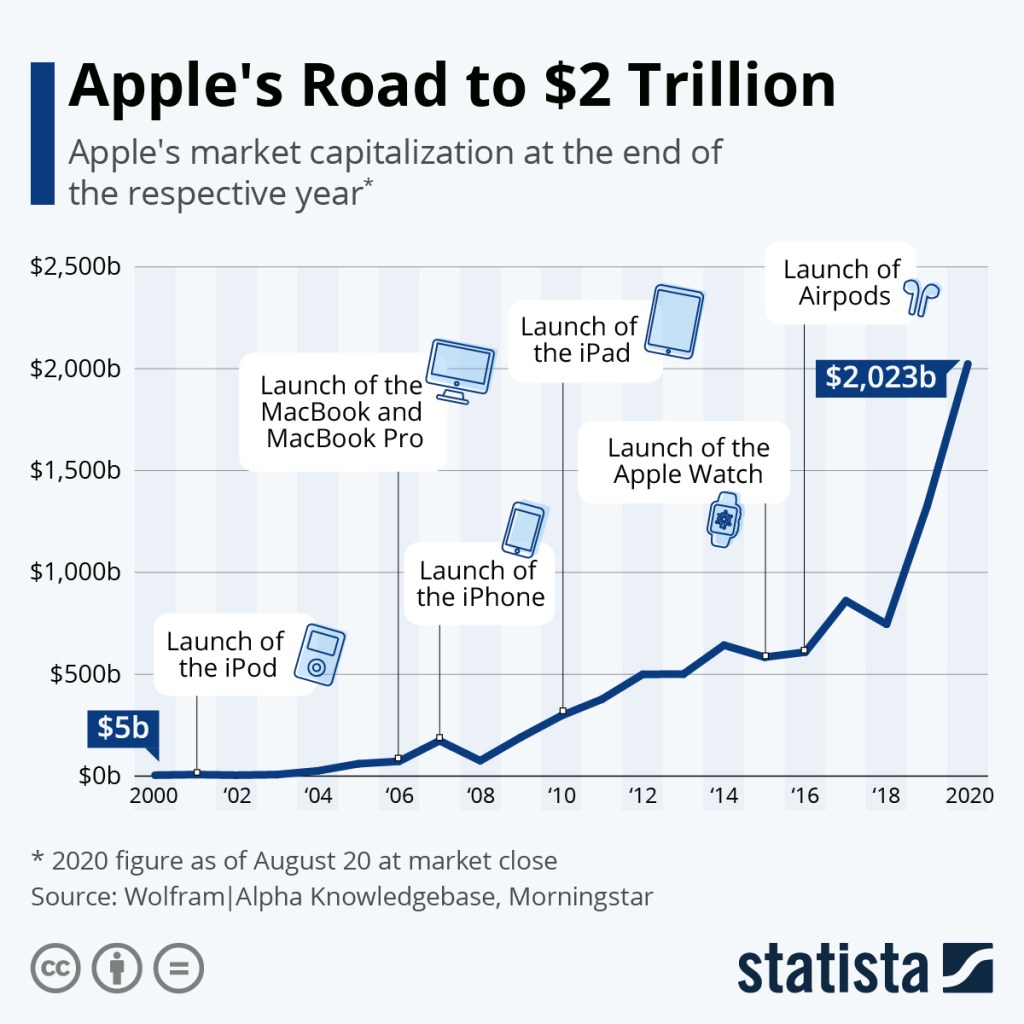
Apple closed Friday with a stunning market capitalization of $2.127 trillion. Just for some context, the company is now worth more than every state’s GDP in the country with the exception of California ($3.1 trillion), and larger than all but seven of the world’s economies, just behind France’s $2.71 trillion GDP.
Spare us the lectures, professors, we understand the complexities of comparing flow (GDPs) with stock (market capitalization) variables.
While the macro boys at GMM are off hunting Black Swans, I am making money to keep the lights on. – Carol K., GMM, August 11th
Yes, Carol K is correct, and we thank her for keeping the lights on at GMM. We do like hunting Black Swans though if purely defined we wouldn’t know what we are hunting. You know, the unknown unknowns thingy.
By the way, the three ETFs that Carol K. fancied in her August 11th post, Investing In The Economy Of The Future, are up 9.30 percent, 6.41 percent, and 11.95 percent vs. the S&P’s 1.90 percent. Thanks, CK, for subsidizing our trophy hunting.
Here’s a macro swan we recently discovered that really worries us and may help explain the spike in gold prices as Treasury rollover risk has increased markedly because of it.
Just so we don’t set the MMT crowd’s hair on fire, we will define rollover risk as the market becoming hesitant to refinance the $5 trillion of T-bills maturing in the next year, which will force the Fed to step up to monetize the maturing bills to prevent short-term yields from spiking and/or the government from defaulting, which, of course, will send gold to the moon and the dollar to the deepest parts of Hades.
Or, as Russia did in 1998 and Argentina chose to do recently, rather setting off an inflationary spiral — yes, inflation even with an output gap — the U.S. G could choose to default/restructure and reprofile its short-term debt. Highly unlikely but not impossible (if the political calculus favors it) as some suggest.
T-Bill Financing Spikes As Percent Of Total Marketable Debt
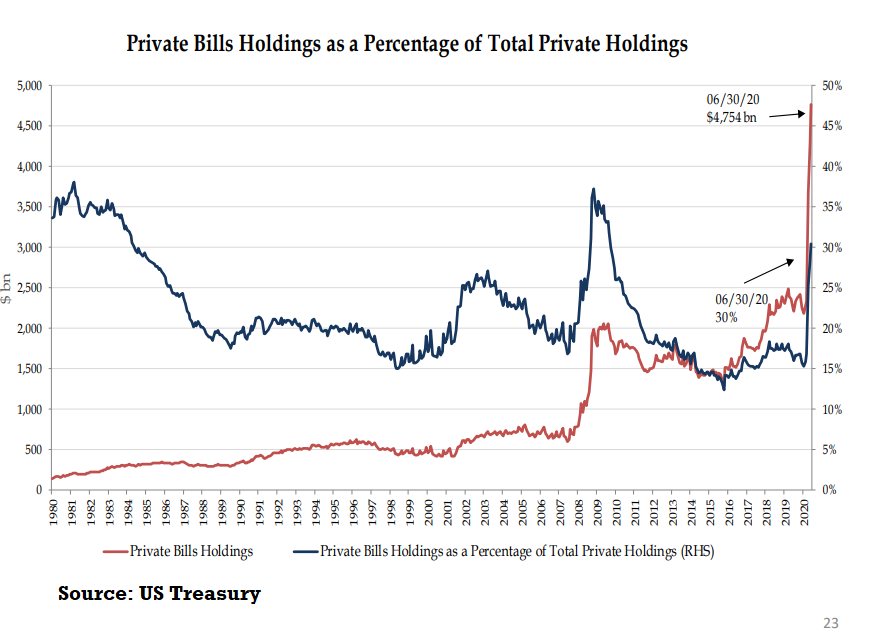
Take a look at the chart of the Treasury’s marketable debt profile held by the private sector (x/ Fed). Anyone who has worked in the emerging markets understands how dangerous it is for a sovereign to depend on short-term financing to fund a swelling budget deficit and a rapidly growing debt stock.
The current stock of T-bills outstanding is now around 26 percent of GDP compared to 14 percent during the last big spike during Great Financial Crisis (GFC).
Treasury officials do not seem concerned, however,
The recent rise in private sector savings is the largest on record and flows associated with that savings growth should continue to support private sector demand for T-Bills. – Treasury Presentation To TBAC
We understand the COVID crisis has put extraordinary stress on the U.S. budget, much of it will be temporary (fingers crossed), and at zero interest rates is essentially free financing for the taxpayer.
Moreover, yield curve management attempts to prevent interest rate spikes on the long end, which would result if the Treasury listened to the idjits who advocate a trillion-dollar issuance of 30-year bonds to finance, whatever.
My god, who is going to buy $1 trillion or even $100 billion of 30-year bonds at a 1.35 percent nominal yield or a negative real yield of around 50 bps? Expected inflation and breakeven rates are even distorted as the FED now owns over 18 percent of TIPs.
Benchmark U.S. Treasury yields surged to seven-week highs on Thursday after the Treasury sold a record amount of 30-year bonds to weak demand, the final sale of $112 billion in new coupon-bearing supply this week.
The Treasury sold $26 billion in bonds, up from $22 billion at its last quarterly refunding in May.
The debt sold at a high yield of 1.406%, around three basis points higher than where the debt traded before the sale. Primary dealers took a larger than average share of 28% of the bonds, indicating tepid demand from investors. The bid-to-cover ratio of 2.14 times was the lowest since July 2019. – Reuters, August 13th
Treasury Curve Distortion
Ground control to Investor Tom, take your reality pills, and put your thinking caps on. Current interest rates are relatively meaningless in terms of resembling anything close to fundamental reality or an economic signal.
There are few real money buyers of Treasury coupons at current rates.
77 percent of Treasury Curve Held By Fed And Foreigners
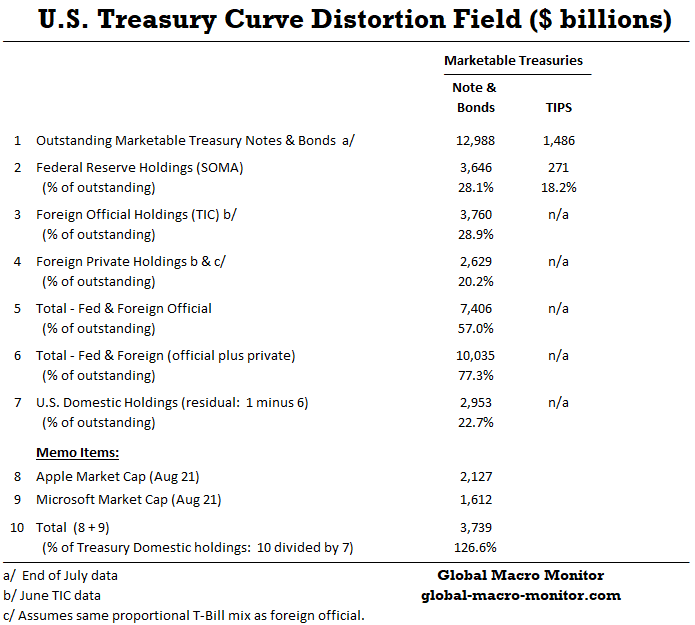
The following table illustrates that both the Fed and foreign central banks hold 57 percent of the current stock of outstanding Treasury coupon securities, who have no sensitivity to market prices, are not directed by market forces except to keep asset prices elevated. Private foreign investors hold about 20 percent of the $13 trillion of marketable notes and bonds held by the public.
Together, the Fed and foreigners control over 77 percent of the Treasury curve, leaving a residual of only about $3 trillion held by domestic U.S. investors.
Apple & Microsoft’s Market Cap > Treasuries Held By U.S. Domestics
To further illustrate how distorted financial markets are Apple and Microsoft’s combined market cap, alone, at Friday’s close was 126 percent of the total stock of Treasury notes and bonds held by U.S. private domestic investors.
Now, what is the bond market telling us?
Still wondering why the financial markets are behaving like a whacko from Waco?
Hidden Faultline In Bills & May Show Up In Repo Market Again
Nonetheless, short-term T-bills will have to be paid off or rolled over. There is no free lunch and we suspect this is where a big potential problem hides.
As the above chart shows, T-Bills have gone from about 15 percent of a much smaller stock of total marketable debt at the end of January to 30 percent of outstanding Treasury securities privately held at the end of June, while the total stock of marketable debt has increased by 19 percent in just five months.
Declining Trend In Bid-to-Cover Ratios
The Bid-to-Cover ratio for bills has been in a declining trend over the past decade.
Could it because they now yield zero percent? However, T-Bills yielded zero percent during the first ZIRP road trip, which lastest for almost five years after the Great Financial Crisis (GFC) so something else must be going on. We are open to suggestions.
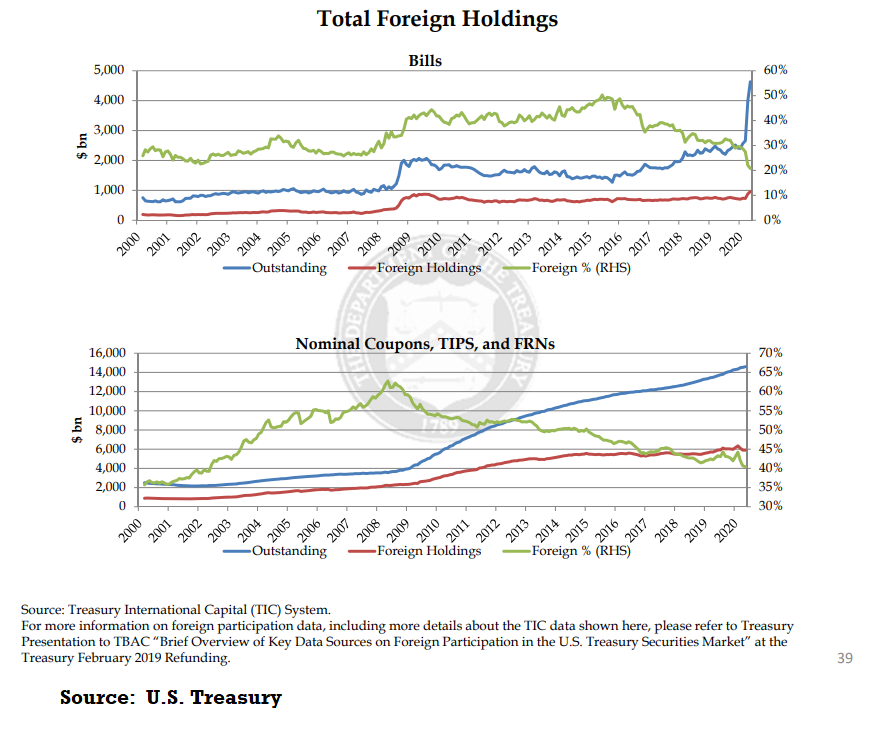
Contrary to conventional wisdom the relative demand for Treasury securities by foreigners has been waning. Foreign holdings of U.S. T-bills has declined from over 50 percent of the total stock to around 20 percent over the past five years. Moreover, the percentage of foreign holdings of Treasury coupon securities, TIPs, and FRNs have fallen from as high as 60 percent of the total stock to 40 percent, levels not seen since the early aughts.
Though foreign central banks still hold about 28 percent of the stock of coupons, the Fed has really stepped up as the marginal buyer during the COVID crisis, increasing its holdings of notes and bonds from $2.384 trillion at the end of January to $4.177 trillion by end-June. During the same period, foreign central banks have reduced their holdings from $3.875 trillion to $3.760 trillion.
Upshot
The global financial markets are extremely distorted primarily due to how central banks have manipulated their government bond markets. Because the U.S. remains the world’s dominant reserve currency, foreign central bank recycling of their foreign exchange reserves back into the U.S. Treasury market has, for many years, further distorted U.S. interest rates.
The COVID crisis and the subsequent huge financing requirements of the U.S. Treasury have created anomalies in how the government finances itself, including an over, and what we deem a potentially dangerous, dependence on short-term debt. This is a faultline on nobody’s radar.
There you have it, folks, now you’re in the know. It’s no longer a Black Swan.
Joe Biden currently stands a good chance of winning the presidency. He is a lifelong centrist but could turn out to be the most ambitious Democratic president in generations.
We’re reposting our piece from November 2017 on the retail space in Manhattan along with a recent video Tweet we found today, which is un-fricking-believable. The video is a bit dated but our ears on the ground say it’s still pretty bad. Who is holding the mortgages on these buildings and why isn’t it making headlines or even adding one brick in the Wall of Worry?
Bleecker Street, said Faith Hope Consolo, the chairwoman of the retail group for the real estate firm Douglas Elliman, “had a real European panache. People associated it with something special, something different.” Ms. Consolo, who has negotiated several deals on the street, added: “We had visitors from all over that said, ‘We’ve got to get to Bleecker Street.’ It became a must-see, a must-go.”
Early on, Ms. Consolo said, rents on the street were around $75 per square foot. By the mid-to-late 2000s, they had risen to $300. Those rates were unaffordable for many shop owners like Mr. Nusraty, who was forced out in 2008 when, he said, his lease was up and his monthly rent skyrocketed to $45,000, from $7,000. – NY Times
Retail not just being Amazoned in Manhattan, retailers are being priced out of business by exorbitant rents. Note to commercial landlords: Lower your rents! But, God forbid, that would be deflationary!
One response to the neoclassical argument is that, in fact, prices are not perfectly flexible (they exhibit “stickiness”). For this reason, the economy is not self-correcting, at least not in the short run. Wages and prices may be “too high” (and, therefore, result in suppliers offering larger quantities for sale than demanders are able and willing to buy), but not come down quickly and eliminate the market surplus. This view has been widely attributed to John Maynard Keynes, and is, in fact, a key argument in what is known as “New Keynesian” economic theory. – Dollars & Sense
.
.
During its incarnation as a fashion theme park, Bleecker Street hosted no fewer than six Marc Jacobs boutiques on a four-block stretch, including a women’s store, a men’s store and a Little Marc for high-end children’s clothing. Ralph Lauren operated three stores in this leafy, charming area, and Coach had stores at 370 and 372-374 Bleecker. Joining those brands, at various points, were Comptoir des Cotonniers (345 Bleecker Street), Brooks Brothers Black Fleece (351), MM6 by Maison Margiela (363), Juicy Couture (368), Mulberry (387) and Lulu Guinness (394).
Today, every one of those clothing and accessories shops is closed.
Mr. Sietsema, the senior critic at Eater NY, has watched with mild schadenfreude but greater alarm as his neighborhood has undergone yet another transformation from a famed retail corridor whose commercial rents and exclusivity rivaled Rodeo Drive in Beverly Hills, Calif., to a street that “looks like a Rust Belt city,” with all these empty storefronts, as a friend of Mr. Sietsema’s put it to him recently.
In the heart of the former shoppers’ paradise — the five-block stretch running from Christopher Street to Bank Street — more than a dozen retail spaces sit empty. Where textured-leather totes and cashmere scarves once beckoned to passers-by, the windows are now covered with brown construction paper, with “For Lease” signs and directives to “Please visit us at our other locations.”
– NY Times, May 31, 2017
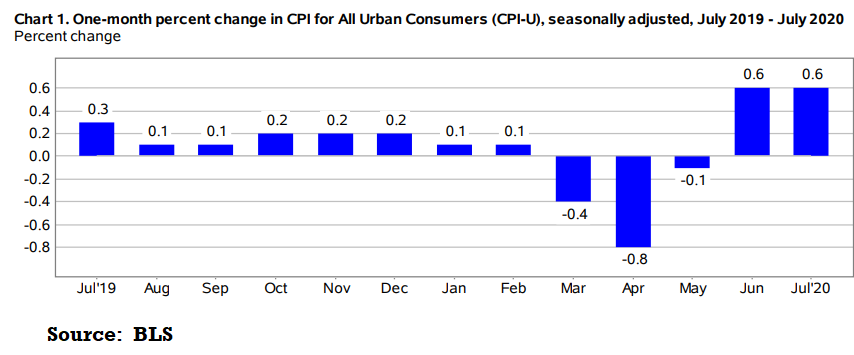
The index for all items less food and energy rose 0.6 percent in July, its largest increase since January 1991. The index for motor vehicle insurance increased sharply in July, as it did the previous month. The indexes for shelter, communication, used cars and trucks, and medical care also increased in July, while the index for recreation declined. –BLS, August 12th
Are you surprised? The largest monthly increase since 1991 or the first back-to-back monthly prints of > = 0.6 percent prints since July 2008? Moreover, it’s only the third distinct period of such high back-to-back monthly inflation prints since November 1990.
We get it, now is not the time to worry about an uptick in inflation when the global economy is on the verge of collapsing into a black hole. There will be consequences, however.
No doubt an accelerated vaccine is great hope for and would be bullish for humanity but would it be bullish for markets? Would the Fed panic with inflation now running at an annual rate of 3.7 percent over the past two months with such an enormous amount of stimulus in the economy?
Have The Principles Of Economics Been Repealed?
Somebody from the woke crowd please tap us on the shoulder and wake us if the principles of economics have been repealed.
I have argued for many years, and contrary to popular opinion that self-directed investors (SDI), who are not subject to the constraints of a professional portfolio manager, can outperform passive/indexed managed funds. SDIs must be willing to put in, at minimum, a significant amount of time and effort to screen, analyze, and construct a portfolio of high-quality stocks. While the macro boys at GMM are off hunting Black Swans, I am making money to keep the lights on.
Futuristic Sectors
In researching companies operating in specific niche sub-sectors we consider to be best positioned for sustainable and healthy future growth, I have concluded that an actively-managed ETF makes the most sense. It is a more efficient use of my time and, more importantly, taps the expertise of the manager to provide a higher risk-adjusted return.
Until recently, my portfolio typically held high-quality dividend growth stocks providing a significant amount of annual income. I’ve recently taken profits in several names, which I’ve owned for several years. I believe we’re facing a longer than expected recovery period from the economic damage inflicted by COVID-19, and many of the stocks I sold will suffer as a result.
Political Risk
Also, as we at GMM have posted on several occasions, a clean sweep by the Democrats, which is looking increasingly likely, will result in both an increase in individual and corporate income taxes. Furthermore, changes to capital gains taxes, and the treatment of dividend income are also a high probability. At some point, we suspect the market to begin pricing these events, which will be stock market negative. Let me stop there and leave the political speculation to others. Not my purpose here.
Future Sustainable Growth Industries
The main focus of my current portfolio analysis is on sub or micro-sectors, which focus on the economy of the future, such as genomics, artificial intelligence, robotics, 5G technologies, and the Internet of Things (IoT). These sectors are dominated mainly by higher-risk small-cap and micro-cap stocks. Some of these companies may or may not become “The Next Big Thing;” some will be taken out by more prominent names in the technology/healthcare sectors, and some will go bankrupt.
Specialization Of Labor
I must confess that analyzing these less established micro-cap stocks isn’t my strength or comparative advantage. I’ve found small and micro-cap companies much more difficult to evaluate using the metrics that have served me well in the large-cap space. Moreover, the growth trajectories of smaller cap companies in such niche sub-sectors are often far less predictable. Many of these “story stocks of the future” are relatively newer companies, have very little analyst coverage, and limited public information available.
Thus, in this particular situation, I believe an actively-managed ETF with an experienced and knowledgable portfolio manager makes more sense than picking individual names. Yes, you will likely pay a higher expense ratio for an actively managed, niche area ETF, but the additional returns with less aggravation are worth it. The table below illustrates that even many of the passive ETFs operating in niche GICS classifications sport expense ratios almost as high as the actively managed, and they merely track an index!
If you’re still not convinced, an expense ratio in the ballpark of 0.75% is still far below the fees for a typical actively managed mutual fund or a closed-end fund (CEF).
ETFs For The Future
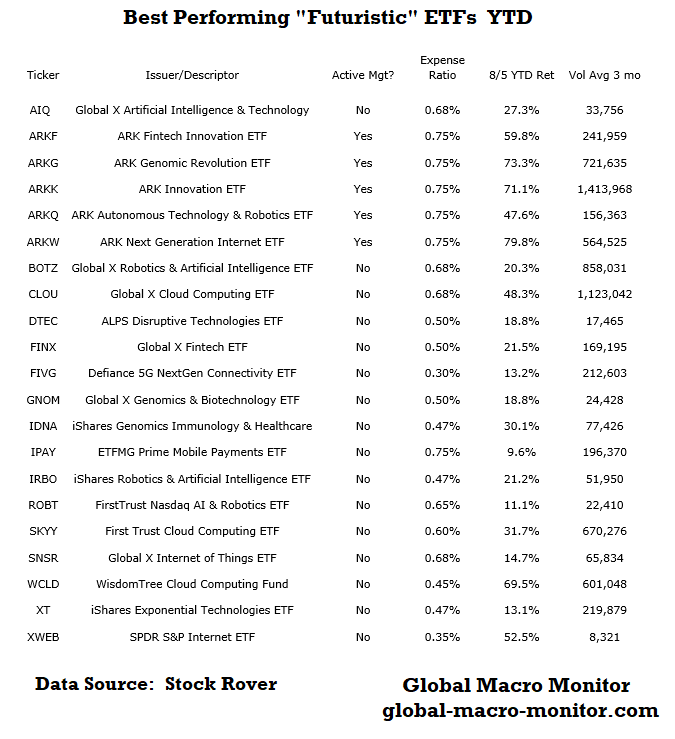
I’ve put together the following table of some of the top-performing ETFs for the year, focused on artificial intelligence, robotics, cloud computing, genomics, fintech, and the Internet of Things (IoT) as of the August 5th market close. There are many other ETFs in this space, which I did not include a fund if their three-month average daily trading volume is below 10,000 shares. Several ETFs have performed exceptionally well this year yet are not included because they are so thinly traded, some as little 750-1,000 shares per trading day. Even if you’re a small investor looking to pick up a relatively small number of shares, I have found that the lack of liquidity and the wide bid/offer spreads in such thinly traded stocks is suboptimal.
The table illustrates the ARK Invest family of actively managed ETFs have outsized returns — especially when compared to SPY’s (S&P 500 index fund) YTD return of 3.85%. Some of these ETFs hold a significant position in Tesla (TSLA) – a few close to 10 percent of its holdings. Tesla is up over 230 percent YTD.
The ARK ETFs also meet my liquidity requirements, with the average daily shares trading in the hundreds of thousands over the past three months. I’ve initiated starter positions in ARKQ (Autonomous Technology & Robotics ETF) and ARKG (Genomic Revolution ETF) and will launch a position in ARKW (Next Generation Internet) on the next pullback.
Another exciting play with a lot of growth in its runway, which has suffered after the March COVID-crash, is the ETFMG Prime Mobile Payments ETF (IPAY). I’ve held this in my portfolio in the past, and it has performed quite well for me. The ETF has holdings in the biggest names in the payments space, such as Square, PayPal, Visa, Mastercard, Fiserv, etc.. It’s YTD performance has surprisingly lagged its historical “growth” status, even though the global COVID lockdowns have created explosive growth in online retail. It’s a fund that I am keeping on my watchlist and hope to reenter soon.
Focusing on total return is what it’s all about investing with a long term horizon. While most of my focus is on high-quality companies, which pay a reliable and steadily increasing dividend, I do not shy away from opportunities in the high growth story sectors of the economy. Investing in the trends that will drive the economy of the future can generate explosive returns, but it is not easy as it seems to pick the winners, which is why I prefer managed ETFs.
Disclaimer: I am not offering financial advice, nor am I a financial advisor. I hold no professional certifications. I do not manage money/investments professionally for third parties and only manage only my portfolio and assist family members’ with their investment portfolios. I am a member of the Global Macro Monitor (GMM) team, with my main focus on stock picking. Information provided in this post is not investment advice, and my conclusions are based on my analysis. Investors should consider performing their in-depth due diligence before buying or selling securities.