
This goat may just beat out Tom Brady as the real GOAT!
https://twitter.com/msmollyrachael/status/1092865117665005568?s=12
This goat may just beat out Tom Brady as the real GOAT!
https://twitter.com/msmollyrachael/status/1092865117665005568?s=12
Can it really be this easy? Another Bull Trap With A Doji On Top?
If this bear market repeats or even rhymes with its recent history, here is the scenario:
Wednesday: The S&P500 trades through its 200-day moving average and closes with a nicely formed green candlestick or an attractive Doji.
Thursday: The market opens near Wednesday’s close, trades 10-15 points higher, gives it all back then some, only to close unched, tracing out a classic Doji candlestick. Or, follows up Wednesday’s Doji with a big sell-off back through the 200-day.
Friday: The bottom drops out of the market and breaks the 200-day.
It’s never that easy.
The market psychology has changed and believes it now owns the Fed.
China Deal
A China trade deal is going to get done as Trump will be forced to cave on the big issues and the two supers ink probably nothing more than our pig in a poke in the Year of the Pig,
One of Donald Trump’s most persistent economic promises has been to rewrite the U.S. relationship with China. Yet as he approaches a potential deal, some of the very hawks who have cheered on the president’s trade war already fear he may end up falling short.
With less than a month before a March 1 deadline for either a deal or an increase in U.S. tariffs, hardliners inside and outside the administration fret Trump is being outplayed by Chinese President Xi Jinping and seduced by what they see as empty promises. – Bloomberg, Feb 4th
“Trump is being outplayed by President Xi Jinping” has been an ongoing theme here at Global Macro Monitor. Never a political statement just analysis and sizing up the competition.
Hate to (no, not really) say it again, “you heard it here first,” folks!
Me thinks Trump & Co. are going to be played by Xi & Co. like a Chinese fiddle. – GMM, March 27th
Imagine the global chaos if Trump agrees with Xi on heads of terms and the Fox News Triumvirate — Sean, Rush, and Ann — start pounding POTUS as weak, just as they did over the first Senate government funding deal, which didn’t include a Wall. It’s always prudent to price some Mad King risk with this White House.
The Setup
Because the S&P500 is now so overbought – the highest RSI since the market top – the risk of another facial from a short position is limited, in our opinion. Waiting for the 200-day to be penetrated, then setting a short limit order just a few points below the 200-day, right around today’s close.
The Stop Signal
Two or three green candle closes above the 200-day sets the index up to challenge the December high and key Fibo at 2800. Whoops, we were wrong again.
As always we do reserve the right to be wrong, as we, or you, or anyone else, don’t know jack scheisse about the future.
Stay frosty, comrades.

One morning closer to Venezuela’s economic “morning-after-plan.”
File this one under you heard it here first. Right here, in fact.
These are stunning numbers, folks. Only 30 percent of Republicans oppose Senator Warren’s wealth tax.
The tax plan proposed by AOC is also 13 points above water.

Yeah, yeah, we get it. It’s early. The only possible way to see the wealth gap closing of any significance in the next 21 months is to have a large revaluation of the 1 percenters’ assets.
Possible but not healthy and wouldn’t bet the ranch on it. Moreover, much better to pull up the bottom than pull down the top. That will take some social investments.
The Young Are Woke
It didn’t take a genius to see this coming especially if the younger generations got woke. Trump woke them.


Jamie Dimon, always the visionary, is way out in front of this.
Individuals earning the most can afford to pay more, and I have no problem paying higher taxes to address some of the fundamental challenges and inequities in our society. — Jamie Dimon
It feels like a prairie fire, folks. An old friend ways in.
The numbers suggest the political ground upon which the 2020 presidential campaign will be fought is shifting in dramatic ways, reflecting the rise in inequality in the United States and growing concerns in the electorate about the fairness of the American system.
“There is a deep wellspring in terms of perception of unfairness in the economy that’s been tapped into here that either didn’t exist five years ago or existed and had not had a chance to be expressed,” said Michael Cembalest, chairman of market and investment strategy at JPMorgan Asset Management who has studied the latest tax proposals. “This is quite a moment in American economic history where all of a sudden in a matter of months this thing has kind of exploded like this.” – Politco, Feburary 4th
If you’re flying a kite and it begins to move left, it just could be that is the way the wind is blowing. Not advocating, observing and just sayin’.
Long Munis/Short Treasuries.
Stunning!
Maybe the NFL will change rules on replay.
NFW does it even come close to the bad call that ruined the Detroit Tigers pitcher Armando Galarraga perfect game with two outs in the bottom of the ninth. That was a heartbreak hill. I think this led to instant replay in MLB.
Nevertheless, shit happens. The late, great Dwight Clark once said the “officiating will always be bad.” You need to factor that in.
Life’s not fair, sports fans. It could be worse.
There is always inequity in life. Some men are killed in a war and some men are wounded, and some men never leave the country, and some men are stationed in the Antarctic and some are stationed in San Francisco. It’s very hard in military or in personal life to assure complete equality. Life is unfair. – President Kennedy
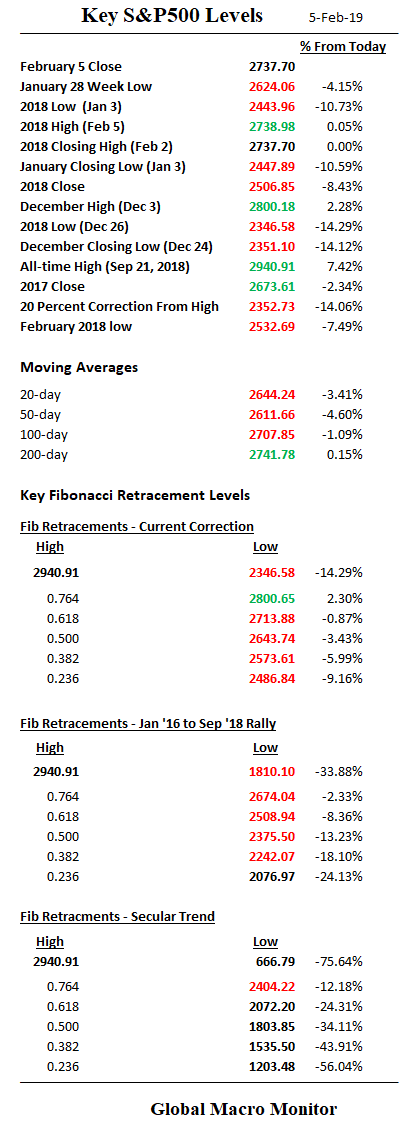
We begin the new week with the S&P500 up over 15 percent from the December 26th intraday low at 2346.58 and sitting right at the 100-day moving average (2710.88) and the key .618 Fibo retracement at 2713.88. Last weekend we wrote,
Nevertheless, the market feels like it wants to go higher. Buoyed by the Friday’s WSJ article the Fed is rethinking the balance sheet – big hat, no cattle, in our opinion – decent earnings and better sentiment on China’s economy, which is reflected in RMB appreciation. We expect the S&P to take out the recent high at 2675.47 and then set its sight on 2710-2720, which is the zip code of a yuuuge Fibo level and the 100-day moving average. – GMM, Jan 27th
Here we are. Friday’s intraday high traded through the 2713 but couldn’t hold it.
The strong employment data, which was very noisy including furloughed Federal employees taking part-time jobs, is leading some to ask was the Fed cave premature? It could be that the policy mistake the markets were worried about in December is the exact policy – dovishness — Mr. Market, Mr. President, and Mr. Cramer were advocating.
Retrofitting Fundamentals
What we saw in December/January, folks, was the new socialism — privatizing profits and nationalizing losses. The government (in the form of the Fed) was moved into action – switching, softening its tone, or what you will — as losses of stock investors mounted. There was little domestic data to cause the Fed to switch x/ market worries and pressure from POTUS and the market cheerleaders. It was the classic case of “retrofitting fundamentals.” That is the market is going down so the economy must be going down.
China will always be China until their exchange rate and reserve position breaks. The economy weakens, President Xi dials up some public sector investment, banks fall in line and GDP increases. The RMB is strengthening so, in our opinion, it’s working.
Stocks And The Economy
The NASDAQ fell over 80 percent after the turn of the century and we had at worst a mild recession, which was caused mainly by the business sector pulling back on cap ex. and not the consumer tanking. We are in a new economy now, however, which is highly dependent on asset prices.
Fleecing Of The Millenials
Unfortunately, the policy of manipulating asset prices higher to save the economy from the Great Financial Crisis (GFC) over the past decade has created unsustainable politics
It has set the young, who own relatively few assets, versus the old, who own the most.
The Fleecing of Millennials
For Americans under the age of 40, the 21st century has resembled one long recession…
This loss of dynamism hurts millennials and the younger Generation Z, even as baby boomers are often doing O.K. Because the layoff rate has declined since 2000, most older workers have been able to hold on to their jobs. For those who are retired, their income — through a combination of Social Security and 401(k)’s — still outpaces inflation on average.
But many younger workers are struggling to launch themselves into good-paying careers. They then lack the money to buy a first home or begin investing in the stock market. Yes, older workers face their own challenges, like age discrimination. Over all, though, the generational gap in both income and wealth is growing. – NY Times

The young finally came out to vote in the 2018 midterms and they brought and will continue to bring their pitchforks. Here is the latest from the Hill,
Taxing the rich becomes hot topic of debate for 2020 hopefuls
A debate over how hard to tax the rich is taking center stage in the early days of the 2020 presidential race.
Likely candidates who are more to the left are leaning heavily on messaging that says wealthy Americans need to be taxed significantly more, and they’re backing that up with proposals to make their mark on the issue. – The Hill
We hear many in the political dumb-dumb class dismiss these policy prescriptions. Comments such as the “Democrats can’t win because they are moving too far left.” At our nicest, we would call that naive.
What if the country (the majority) is moving left, which we believe it is as the younger generations, saddled with debt and carbon from the baby boomers enter the political fray en masse. We don’t advocate for these policies at GMM, but try to anticipate and skate to where the political puck is going to be, not where it has been. You were warned, comrades.
Moreover, we’ve been writing about the coming “Clash of Generations” for years. See here.
Back To The Market
The Fed has thus far been all talk and has done nothing yet to back up its dovishness. But if the labor markets continue to tighten, and tight they are – ask any contractor trying to build or a young couple trying to buy their first home — the Fed will have to move back to a tightening bias.
We concede WalMart and the Home Depots can draw upon a pool of labor that was once the retired class as many baby boomers cannot afford to retire at 65 years-old. That is what may be happening as the experts try and discredit the Philips Curve.
We saw this all throughout the Northeast during our summer trip back to east coast.
Surprised at the poverty of seniors in New England. Most of the cashiers in retail were closer to 80 years old than 40 years old. My friends tell me one factor is simple demographics. Maine, for example, is the oldest state in the country; – GMM, August 15th
The last thing the market needs up here, after the 15 percent bounce, is a “ball busting” Fed, which is losing its cred faster than a Todd Gurley 40-yard dash. But that’s a bit way off into the future.
What Now?
One thing we have learned over the past decade of trading is that the algos love to set bull and bear traps to confound the market gurus and ruin the P&Ls of individual traders. We sense another major bull trap is forming right here.
MarketWatch had a good piece out this weekend,
Note the common and concurrent elements of the previous two big market tops (2000, 2007) versus now:
- New market highs tagging the upper monthly Bollinger band on a monthly negative RSI (relative strength index) divergence — check.
- A steep correction off the highs that breaks a multi-year trend line — check.
- A turning of the monthly MACD (Moving Average Convergence Divergence) toward south and the histogram to negative — check.
- A correction that transverses all the way from the upper monthly Bollinger band to the lower monthly Bollinger band before bouncing — check.
- A counter rally that moves all the way from the lower Bollinger band to the middle Bollinger band, the 20MA — check.
- A counter rally that produces a bump in the RSI around the middle zone, alleviating oversold conditions — check.
- All these events occurring following an extended trend of lower unemployment, signaling the coming end of a business cycle — check.
- All these events coinciding with a reversal in yields — check.
- All these events coinciding with a Federal Reserve suddenly halting its rate hike cycle — check.
I submit that the counter rally is consistent with all of those factors. Indeed, as with counter rallies in the past, this rally remains below its broken trend line. – MarketWatch
Upshot
The next big macro factor to move the market is a China trade deal.
We do expect more happy talk, though the final deal will be nothing more than a “pig in a poke“, in our opinion. Trump may also come under pressure for caving or meeting Xi “halfway” adding some Mad King risk to markets.
Thus we expect the market to trade through the .618 Fibo at 2713 and kiss or temporarily pierce the 200-day moving average at 2740, getting the bulls Super Bowl lathered up, before reversing and setting on a new trajectory to test the December low.
Big support at 2610-2625, which includes last week’s low and the 20 and 50-day moving averages.
Happy hunting this week, folks. Rams by 10.
This is will be the last actionable piece for the free riders. More to come on that.


Help keep the lights on at the Global Macro Monitor. Contribute any amount based on your perception of our value added by clicking the PayPal donate widget at the right side of the screen. You don’t need a PayPal account just a credit card. Thank you!


