The Blowback Begins: Ohio Farmer Vents On Trade War

Hope you all take the time to read this piece by an Ohio soybean farmer caught up in Trump’s trade wars.

Tariffs hurt the many and help the few.  The “tyranny of the minority,” if you will, and that is before taking into account the casualties of tit-for-tat retaliation.

Let me tell you a riddle. “I slept with a billionaire because he said he loved me. I expected to make love, but in the morning I realized I was getting screwed. When I went to tell the world, I was offered cash to keep my mouth shut.” Who am I? No, I’m not a model or someone named Stormy. I’m the American farmer.

In the mid-1980s we were awash with over production in the corn and soybean sectors. Agriculture got busy, boarded planes, trains and automobiles and started building markets around the world, one handshake and one relationship at a time. We used our own funds through our check off dollars and trade associations to build markets in Mexico, Canada, Latin America and the Pacific Rim. And we didn’t stop there. In partnership with the U.S. taxpayers, we built an ethanol industry to ensure another renewable energy source for U.S. consumers.  –  Christopher Gibbs, Sidney Daily News

Hat Tip:  @Noahpinion

Politics

Big special election in Ohio’s 12th Congressional District on Tuesday.   President Trump was stumping today for the Republican candidate.   The seat has been held by Republicans since 1920, except for an eight-year stretch in the 1930s and a two-year term in 1980.  It’s tight, folks

Monmouth University poll released this week shows a tight race, with Balderson receiving 44% support to O’Connor’s 43%, with 11% of respondents saying they are undecided.  – CNN

Stunning given the Republican beat the Democrat in the 2016 general for this seat,  66.6 percent to 39.8 percent,  a whopping spread of 26.8 percent.

If the Dems take this one, the Republicans and the president are in deep-deep trouble. Even if it comes anywhere near to as close as the polls suggest, it still spells doom for the White House.

We are becoming more confident of our Lavender Wave prediction for the November midterms.

Massive Lavender Wave Coming In November

We believe there will be a massive “lavender wave,” in the November midterms.  Lavender is the color combination of pink and blue.

In a recent poll, the president’s approval rating among men is 54 percent positive and 45 percent negative. Among women, it’s 32 percent positive and 65 percent negative.   There are many more women registered voters than men.

In elections, women are also more likely to vote in higher numbers and have done so for decades.  Women have cast between four and seven million more votes than men in recent elections.

Moreover, the revulsion toward the president among women has not only made them more likely to vote but has turned them into activists.  Women are running for office this year in record numbers.

Recall it was the African-American women who put Doug Jones over the top in Alabama’s special U.S. Senate election against Roy Moore last year.  Exit polls showed that 98 percent of black women supported Jones.

Do the math, folks.  Listen to the water cooler talk, read the cartoons.

The Dems will control the House, and probably Senate come next January.   PredictIt gives the Dems a 68 percent probability of taking back the House but only a 30 percent chance of taking the Senate.   We will take that bet, however, a 3,600 percent compounded annual return if Chuck becomes the next Majority Leader.

A Lavender Wave is not even remotely priced by the markets.

We suspect panic will begin to seep in when everyone returns from the beach in September.  Not a political statement just our observations and inferences based on the data.

Posted in Agriculture, Trade War, Uncategorized | Tagged , , , | 35 Comments

Contrarian Crush & Why LT Rates Are Going Much Higher

This Bloomberg  piece was published before Facebook blew up but still you get the drift.  Betting against the crowd has been a disaster recently.   It always is until it isn’t.

In the past year, a contrarian portfolio that invests in the stocks that are least loved by fund managers and bets against their biggest holdings lost nearly 23 percent of its value. That’s the worst annual performance in more than five years for a strategy that until recently had produced consistent gains, according to a research note out this week from Bank of America Merrill Lynch. It has also been down four quarters in a row, a first. Two years ago, the same strategy would have been up nearly 17 percent, and more than 20 percent the year before that.  – Bloomberg,  July 5th

Only MoMo Market

Big Bets Against The Bond

By the way,  one of the most crowded trades in the market is to be short 10-year bond futures.    Wouldn’t bet against that crowd as many are.   The big short has been on for almost a year now and many events should, and would have in the past,  squeezed the bears hard but hasn’t, such as the stock market crash in early February.

There must be a spectre haunting the bond market.

We expect longer-term rates to move much higher sometime very soon (x/ some Black Swan flight-to-quality event), and the shorts will be paid handsomely.

Sometimes the crowd is right. and the many are smarter than the few.

The latest data from U.S. futures exchanges show that hedge funds and speculators last week accumulated a record short position in five-year, 10-year, and 30-year Treasuries futures, and also expanded their short position in two-year notes.

Commodity Futures Trading Commission figures show they now hold a record net short position of 715,965 contracts in five-year Treasury futures, 509,498 contracts in 10-year futures, and 212,674 contracts in 30-year futures.  – Reuters, July 30th

Hope to be out with a comprehensive piece with lots of data on our bond market view on Monday.

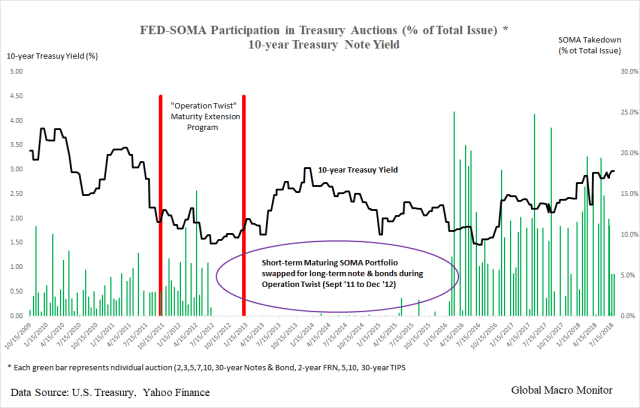
Here is a little teaser.

SOMA_Auctions_1

Feedback on the chart, please.

Stay tuned.

Posted in Black Swan Watch, Bonds, Equities, Uncategorized | Tagged , , , | 2 Comments

Week In Review – August 3

Summary

  • Turkey still getting hammered across the board, and now in a pissing match with the U.S. over the detention of Pastor Andrew Brunson
  • The Italian Treasury was in supporting its bond market after a sharp sell-off over budget fears
  • The dollar is showing strength with the Dixie closing above 95. Having a tough time cracking 95.5 but we expect a breakout coming soon
  • Chinese stocks took a hammering with Shanghai now down over 17 percent YTD.  Prevailing meme China losing trade war.  Laughable
  • FAANG bounced on Apple’s market cap  surpassing 1012 dollars
  • The VIX closing in on a ten handle during the Dog Days of Augie
  • Timber again for Lumber

Commentary:  None.  Keeping it tight, don’t like it, and going to the beach.  Political risk is rising and not priced.  Rome is burning, again, with one of the fires caused by a flat tire.


Week_Chart_2


Week_Chart_1

Week_2018_ETFs


Week_Table

Posted in Uncategorized, Week in Review | Tagged , , , , , , | Leave a comment

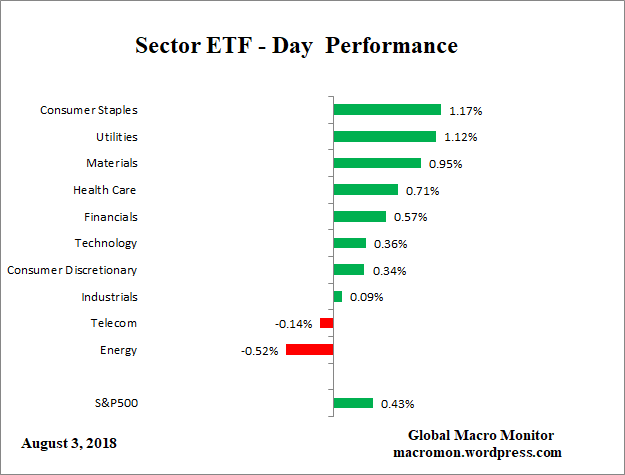
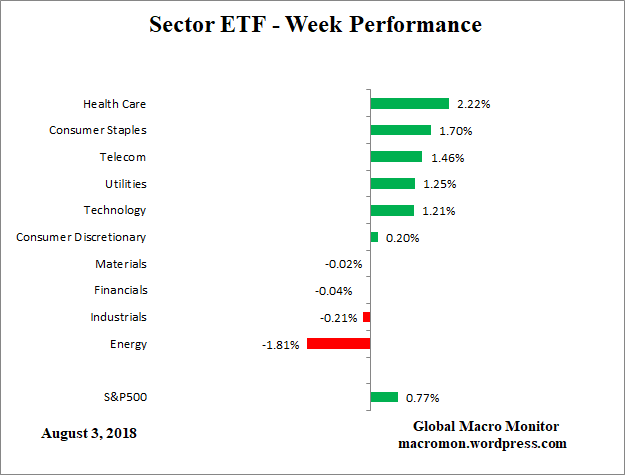
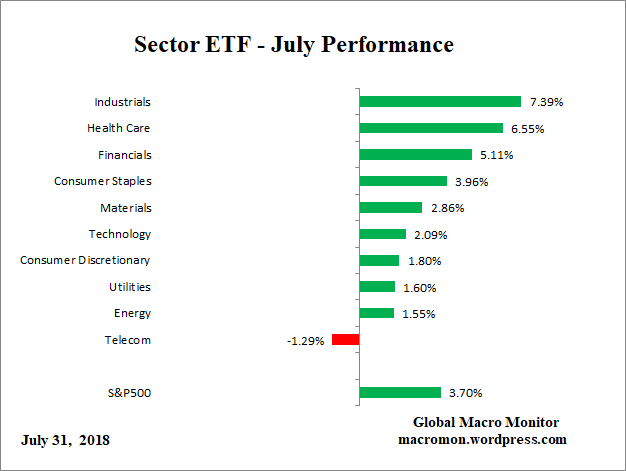
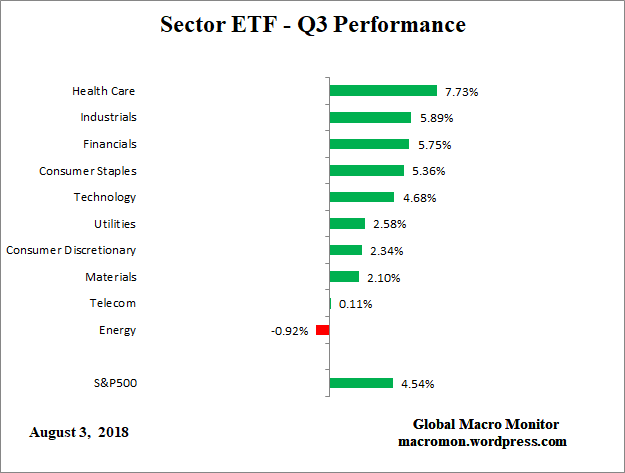
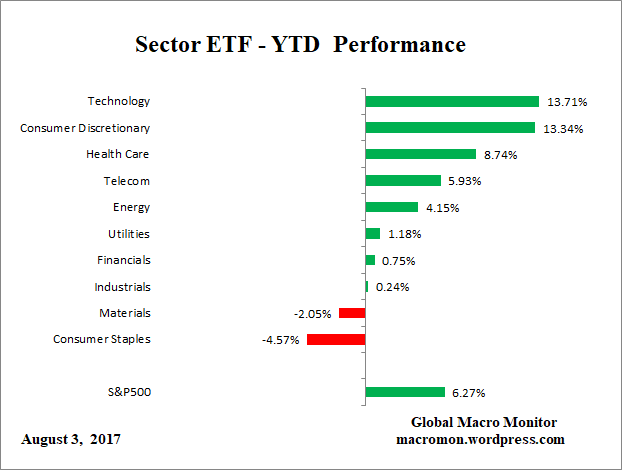
Sector ETF Performance – August 3

ETF_D

ETF_W

ETF_M

ETF_Q

ETF_YTD

Posted in Sector ETF Peformance, Uncategorized | Tagged | Leave a comment

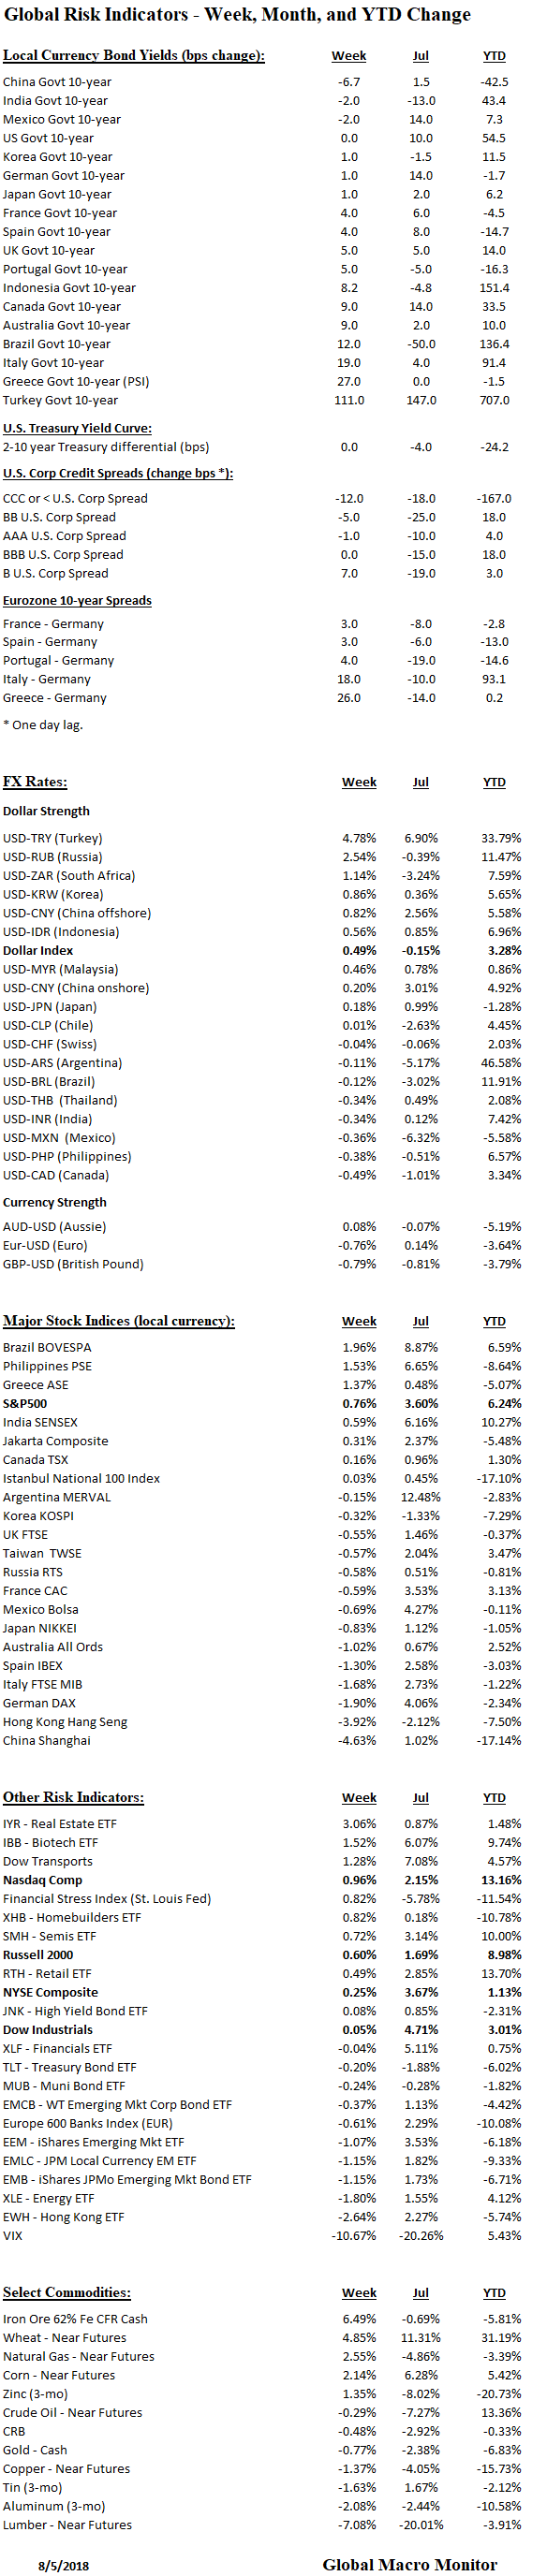
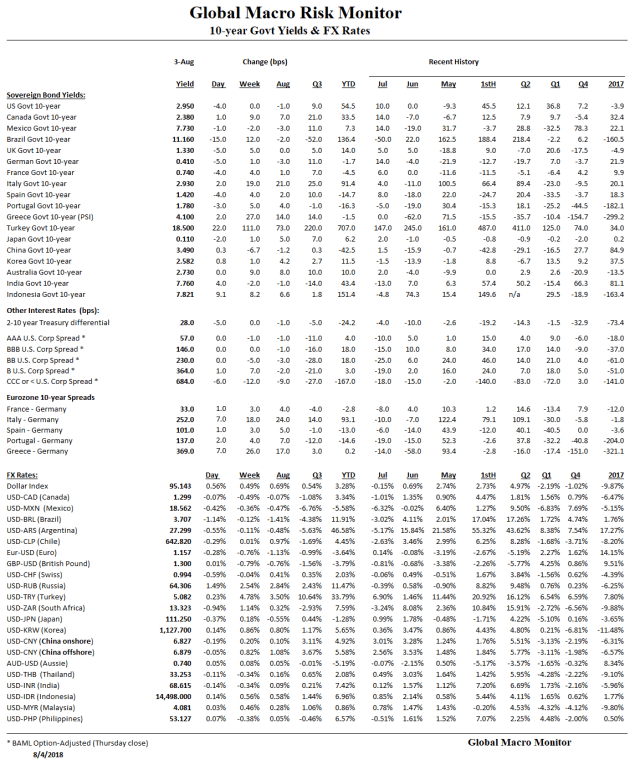
Global Risk Monitor – August 3

RiskMon_1.png

RiskMon_2

Posted in Daily Risk Monitor, Uncategorized | Tagged , , , , , | Leave a comment

Political Economy Of The July Employment Report

It is 94 days and 10 hours until the November 6th midterm election, which will determine the fate of the Trump presidency.  All things are now political, including, and, most notable, today’s nonfarm payrolls report.

We did an in-depth analysis of what is happening in the labor market in our May post, Deconstructing The U.S. Jobs Market.

July Employment Report

Nonfarm payrolls came in less than expected, increasing by 157k in July with the unemployment rate moving down slightly to 3.9 percent.   Payroll jobs extended their streak of 94 consecutive months of positive growth, which began in October 2010.

The average monthly change in payroll employment during the streak has been an increase of 200k jobs per month.  July’s number thus underperformed the average but prior months were revised up, increasing the 3-month moving average to 224k.     There is too much noise in the data to make inferences from one month of data.

The Trump v. Obama Jobs Machine 

As we move closer to the November election, a big debate is coming on the economy, especially over jobs.    The economy is in good shape, but the growth is not trickling down to most of the labor force.

The economy, as measured by real GDP growth, is significantly stronger in the first 18 months of the Trump administration than the last 18 months of President Obama’s term. However,  job creation is oddly lagging, and real wage growth is lower under Trump than Obama.

Monthly Job Increases

The chart illustrates the monthly change in nonfarm payrolls in President Trump’s first 18 months has averaged 190k versus President Obama’s 206k in his last 18 months in office.


NFP_Monthly Change

There are three more employment reports before the midterm elections, and nonfarm payrolls will have to increase by an average of 350k per month for Trump’s job machine to exceed Obama’s 213k monthly increase in his last 21 months in office.    That just ain’t gonna happen, folks.

Employment Growth By Sector

The table breaks down the job changes by sector.

NFP_Table

Not Your Mother’s Manufacturing Jobs

President Trump deserves credit for reviving manufacturing employment, but these are not the traditional manufacturing jobs of historical folklore.  For example, employment in the auto and light truck manufacturing sector continues to decline, 9k jobs lost since President Trump took office.   This may be one of the factors why he is polling so poorly in Michigan and the midwest states.

Moreover,  even after the implementation of tariffs,  employment in the primary metals manufacturing sector, which includes the celebrated steel mills has only increased by 14k since January 2017.

It also seems odd wage growth is much slower in manufacturing and mining under Trump. It may be due to the fact there is so much slack in these sectors.

Food And Booze Manufacturing Jobs

Conversely,  employment in food manufacturing and brewpubs (producing craft beer), wineries, and distilleries is booming, and account for more than 20 percent of the manufacturing jobs created during the current administration.  What the hard hats would probably label “snowflake” manufacturing are what economists call nondurable goods.

Upshot

The economy continues to hum along, but most the gains appear to be accruing to capital rather than labor.  We do sense a  political outrage building over the tax cuts being used mainly for stock buybacks and not new hiring or wage increases.

Here is a rant from a recent piece from none other than Forbes Magazine, the bastion of capitalist Wall Street,

The decades-long diversion of business income to shareholders has resulted in a soaring stock market but also stagnating incomes for most of the population. If this gargantuan transfer of assets to the existing owners of shares is allowed to continue, nothing less than a global political or financial cataclysm—or both—is in the offing. The good news is that remedial action may be on the way.

Let’s be clear. A massive extraction of resources for shareholders is not the way capitalism used to work. What’s now happening would have been illegal only a few decades ago. The principal mechanism enabling this massive shift of resources—an estimated $1 trillion in 2018 alone—is a practice known as share buybacks: firms purchase their own shares so as to increase the value of each individual share and so enrich the existing owners of shares.

When conducted on a large scale in the open market, share buybacks used to be considered illegal as they constituted obvious stock price manipulation. But they were effectively legalized in 1982 by a hard-to-understand SEC regulation: rule 10b-18. As a result, executives of public corporations, rather than creating fresh value and new customers through entrepreneurship and innovation, began extracting value for shareholders (and themselves) by buying back their own shares. The emphasis on generating immediate returns to boost the current stock price in due course created a short-term focus in public corporations at the expense of innovation, long-term shareholder value, and the dynamism of the entire economy.  – Forbes,  July 8, 2018

October Surprise? 

President Trump and the Republicans are getting minimal political traction from the strong economy for the above reasons and headed for a major political facial in the midterm elections.

We fully expect an October surprise, probably in the form of some Potemkin Village-esque trade deal with China, much like the Korean trade deal farce,  for example.

Potemkim.png

It will be too little, too late, and certainly won’t change the women’s vote.

Contemplate this.  My old Congressman from Greenwich Village,  Jerry Nadler, current ranking member, as the new chairman of the House Judiciary Committee in the next Congress.  Subpoena power galore.  The president’s worst nightmare.

The next Congress is sure to be full of political fireworks and massive uncertainty.    Not priced.

Posted in Employment, Uncategorized | Tagged , | Leave a comment

‘Toon of the Day: Stock Buybacks

Toon_Buybacks

Source:   New Yorker

Tell us it ain’t so, Forbes, the bastion of capitalism and Wall Street.   Using such words as  “global political or financial cataclysm”  to warn us about the consequences of stock buybacks?   Double Yikes!

The decades-long diversion of business income to shareholders has resulted in a soaring stock market but also stagnating incomes for most of the population. If this gargantuan transfer of assets to the existing owners of shares is allowed to continue, nothing less than a global political or financial cataclysm—or both—is in the offing. The good news is that remedial action may be on the way.

Let’s be clear. A massive extraction of resources for shareholders is not the way capitalism used to work. What’s now happening would have been illegal only a few decades ago. The principal mechanism enabling this massive shift of resources—an estimated $1 trillion in 2018 alone—is a practice known as share buybacks: firms purchase their own shares so as to increase the value of each individual share and so enrich the existing owners of shares.
Forbes, July 8, 2018

Posted in Cartoon of the Day, Uncategorized | Tagged , | Leave a comment

Inflation Drives Apple Market Cap To One Trillion Dollars

1012

Apple’s market cap hit 1012 dollars today.

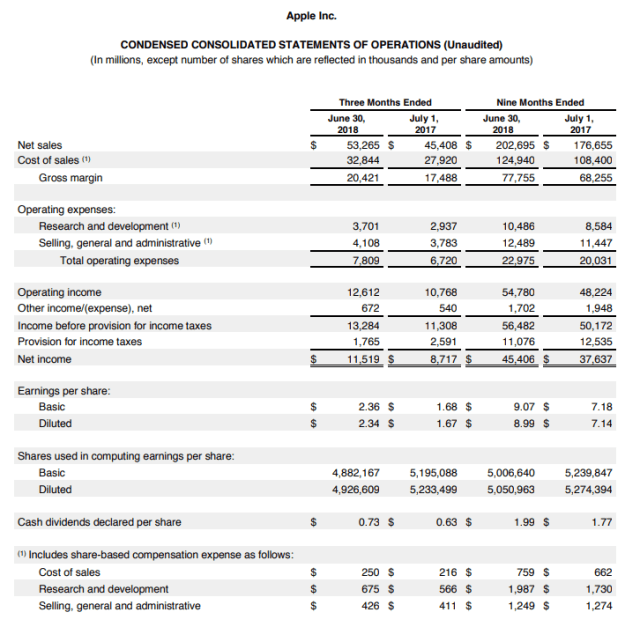
Impressive but no pom-poms here at Global Macro Monitor.  We would be more impressed if Apple’s main businesses were doing better and the company was more focused on electrical engineering rather than financial engineering.

Don’t get us long, I mean wrong,  we were The Dallas Cowboy Cheerleaders for Apple’s stock pre-2015.   Check the record.

Just the data, ma’am

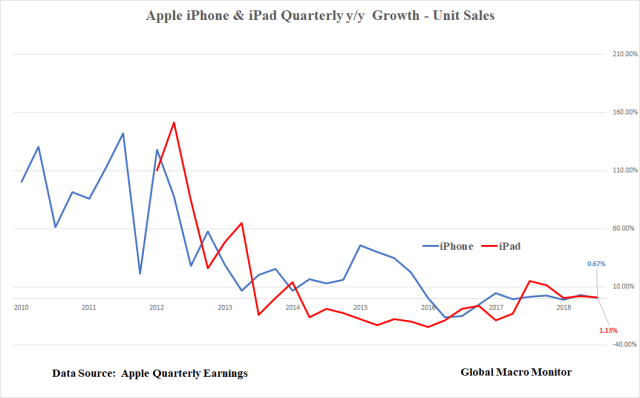
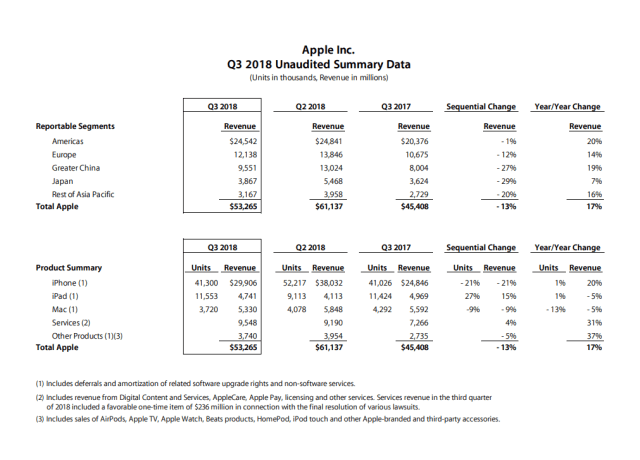
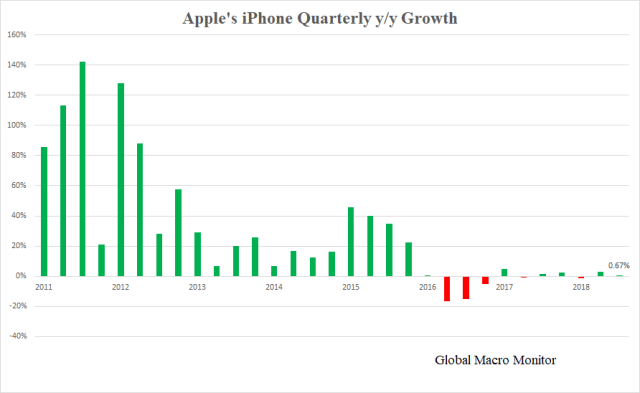
The table below illustrates that almost all of Apple’s revenue growth was driven by inflation, that is the price increase for iPhones.   Unit sales growth for the company’s three major products  – iPhone, iPad, and Mac – were either flatish year over year or negative.  This has been the case now for several years.


Apple_Earnings Inflation

Apple_iPhone_iPad Unit Sales Growth

If Apple were not able to significantly raise iPhone prices (mainly through the upgrade to the X) and only grow revenues by the device’s unit sales growth of 0.67 percent,  Apple’s total revenues would have been about one third of what was posted, or 6.7 percent versus 17.3 percent.

One thousand dollar smart phones are not a sustainable proposition, in our opinion, folks.  China, or somebody, somewhere, will, or already is producing a quality equivalent smart phone for $250.

Are iPhones Peacock Feathers? 

Yes, yes, and yes, still not a Porsche.   We get it.

Our sense, however, millennials, and the youngers, are not as into conspicuous consumption as the self-absorbed boomers are.

An iPhone is not peacock feathers, folks, at least we don’t think so.

Does owning  an Apple iPhone really signal superior genes to the opposite sex?

Make sure to click on the peacock feathers link to understand what the hell we are talking about!

An Omen Of Coming Inflation?

Furthermore, Apple’s inflation driven earnings may be an omen of a larger inflation coming to the overall economy.

Of course, the  iPhone X was a much better quality phone and will almost certainly be hedonically adjusted by the BLS so it won’t show up in the CPI.

Ridiculous.   Real wages and purchasing power decline as consumers purchase higher priced items, regardless if the camera phone has a better resolution.

But, hey, if Apple can charge $1,000 for a phone why not ________  for any item.   Fill in the blank for your company and seller or supplier of choice.

Great Products, But What Have You Done For Us Lately?

We love Apple products, have loved the stock in the past, and have a double digit number of Apple devices in our household.

We will like the stock much more when they are driven more by electrical engineering (product innovation) rather than financial engineering (stock buybacks).

The New Supply-Side Economics of Asset Markets 

Finally, the limiting supply (shifting supply curve left) induced surge in Apple price shares due to buybacks is endemic of today’s asset markets, in general.  Most notable in risk-free bonds — restricting supply through QE, which distorts the risk-free interest rate,  of which all assets are priced; though this is slowly changing;   housing  with all cash investors and private equity — now the largest holder of single family homes, and gouging renters;  and equities through the massive buyback programs.

Moreover,  there is feedback loop buying bias induced by the move to passive investing.

The “Steel Bubble”

These are a few of the major factors why these overvalued asset markets are so much harder to pop than the asset bubbles of Christmas past.    See our posts on the “steel bubble.”

Apple, The Stock

Toppy.  Selling the hype and waiting for the “new, new thang.”   If they build it, I will come.

Overall market action bullish.   No sellers, until they sell.  Today’s action is a signal that no-liquidity August has arrived.   Go to the beach!

Stay tuned.


Jul31_Apple_1

Posted in Apple, Inflation/Deflation, Innovation, Uncategorized | Tagged , , , | 18 Comments

The Streak

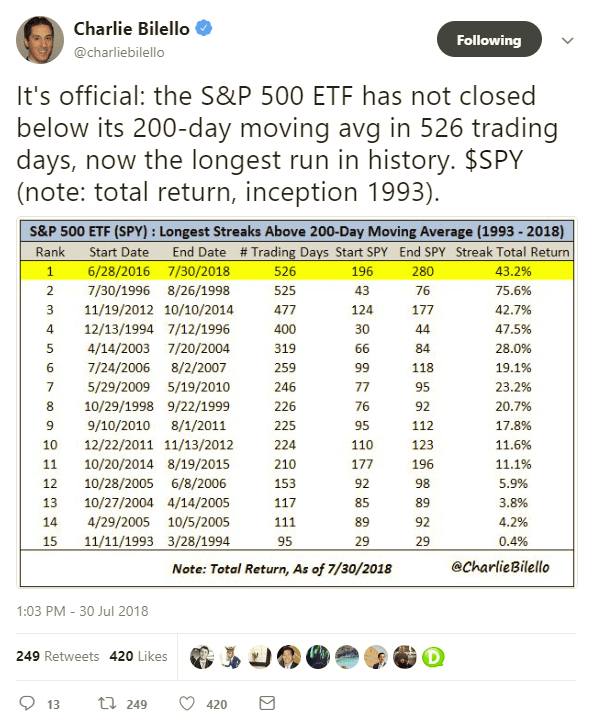
In case you missed Charlie B.’s excellent table from yesterday, which illustrates the S&P500 has not closed below its 200-day moving average in 526 days, here you go.

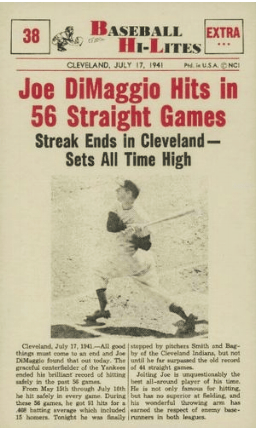
Stunning, especially given Joltin’ Joe’s hitting streak lasted 526 consecutive games.  Coincidence?   You decide.

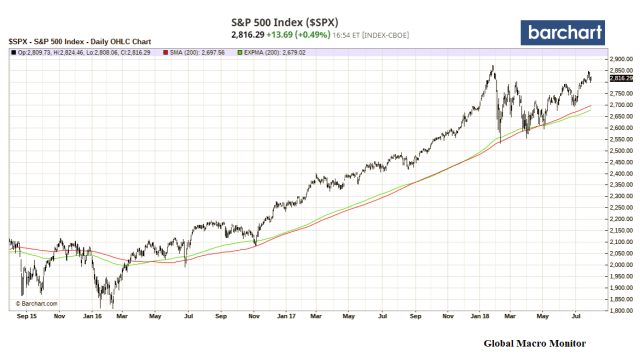
We do have the S&P500 closing below its 200-day April 2, 2018, however.  Not the case for the exponential 200-day versus the simple 200-day,  but moving to the exponential opens up earlier days for such a breach.   The same holds for the  SPY, the S&P500 ETF.  We have the question into Charlie.

Even so, the simple 200-day has been the steel curtain of support for the stock market over the past two years.   The classic moving average took a massive pounding late March to early May yet still held, which we noted in our,  Stock Bull & Bear Traps Galore post in early May,

Relentless Pounding Of The 200-day Moving Average

A lower swing high, that is below 2.717,  will almost seal the fate the bears will take out the 200-day sometime very soon.  They have been relentlessly pounding the 200-day during this correction.

In bull markets, the 200-day may be tested maybe once or twice over a short period then bounce big and continue the uptrend.  Not test it every third day as it seems to be doing recently.

Some believe what doesn’t kill you makes you stronger.

Personal character?  Absolutely.

Technical support levels?  We don’t think so.

Eventually,  the front line will crack, even if it is the robots defending it.  And, what if they decide to all retreat at the same time and go offer only, as they did in the flash crash?

When contemplating the constant hammering of the S&P500’s 200-day moving average, think the financial equivalent of Chairman Mao’s “human wave theory.”

“overwhelm the defenders by the sheer weight of numbers” – Wikipedia 

-Global Macro Monitor,  May 7

We concluded wrongly.   Thank you ‘bots, algos, machines, drones or whatever the hell you want to call them.

We do expect the 200-day to be breached  sometime before the year-end, however, with a higher probability of it happening in August or September.  In case you’re wondering, the current S&P simple 200-day is at 2698,  or about 4 ½ percent below today’s close.

Stay tuned.


Streak_Chart_2


Streak_Chart_1

Streak_Chart_3

Posted in Equities, Uncategorized | Tagged , | 11 Comments

Apple Grows Q3 Revs By 17 Percent

Apple out with earnings.  Stock up about 3 percent in after hours.

Revenues

We note:  1) the 17 percent overall revenue growth, still impressive given the size of the company;  2) looks like no blowback yet on trade with China, i.e., boycott of Apple products. Watch this space; 3) services growth comes in over 30 percent, and 4) all iPhone revenue growth all in the price increase, unit sales continue to flat line.

Upshot:  The company is trying hard, and to some extent succeeding, to reinvent itself away from just an iPhone company.   Nevertheless,  iPhones still make up almost 60 percent of total revenues.

Stock

Where is stock going?

We don’t know but the glory growth days are over unless they can kickstart innovation.  We are basically neutral on stock but don’t like the market in August.  If big tech moves lower in August probably the best FAANG performer, however.

Jul31_Apple_1


Jul31_Apple_4


Jul31_Apple_5

Jul31_Apple_2


Posted in Apple, Uncategorized | Tagged , | Leave a comment