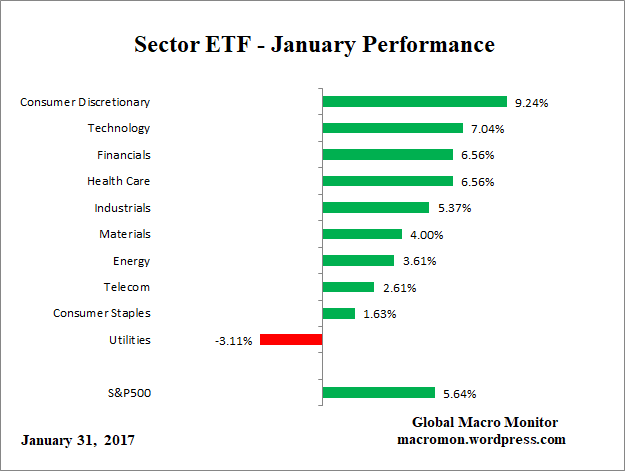
Asset valuations, including stock prices, eventually revert to their long-term mean (average) valuation or at least attempt to if not interrupted by outside intervention, such as central banks. It has been the major factor in the steep sell-off in stocks over the past few days, in our opinion.
Stock valuations are at extreme levels, are running way ahead of fundamentals, and sentiment and positioning were off the charts. Many investors even began to delude themselves that stocks can and never go down.
Moreover, it is the new Fed Chairman’s, Jerome Powell, first day on the job. It is less than certain that the new regime at the Fed will step in to prop up stock valuations. Don’t bet against it, however, as ever since the mid-1990’s, the stock and asset markets have become the economy.
Macro Triggers
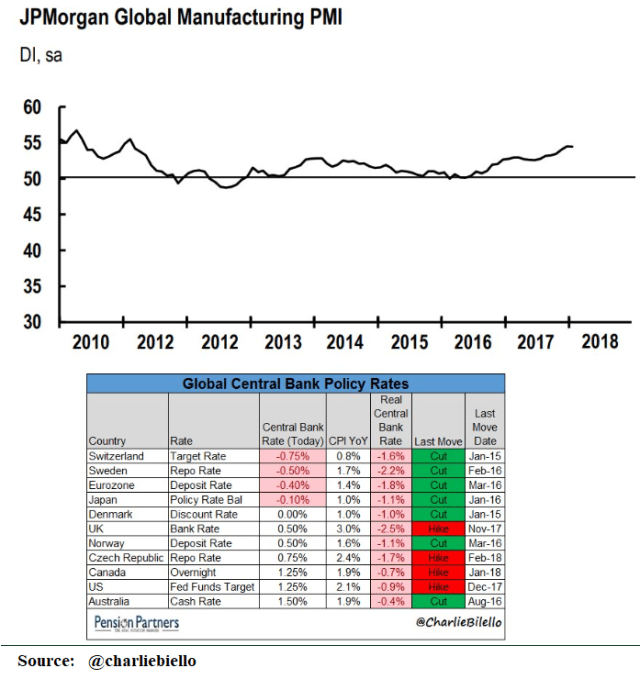
There are other short and medium-term macro factors at play that may have triggered the sell off: 1) the end of quantitative easing; 2) rising interest rates, inflation, and fears of bursting bond bubbles; 3) U.S. fiscal promiscuity and worries about how the government will finance itself, including $1 trillion in 2018 (stunning and gone unnoticed); 4) the botching of dollar policy by Secretary Mnuchin at Davos, which could spook off foreign buyers of U.S. Treasury debt; 5) fears central banks are way behind the curve as almost all still have negative real policy rates; 6) threat of increased political instability in the world’s oldest democracy; 7) the first day on the job for new Fed Chair and uncertainty about Fed independence from the White House; 8) machines gone wild; 9) money supply growing slower than the economy; 10) other; 11) we don’t know; 12) all of the above; and 13) none of the above.
Then there are the technical issues. Massive short volatility positioning by everyone and their Target manager which got drilled today as the new VIX had its highest one day increase in history. The old VIX, linked to the OEX or S&P100, which was in play in 1987, was up much higher. Take a look at the short volatility ETF, XIV, today, which disintegrated in after hours.
Asset Values And Nominal GDP
Interestingly, former Secretary of Treasury, Larry Summers, comments in today’s Washington Post on the prospect that: “Asset values and levels of borrowing cannot grow faster than gross domestic product.”
Asset values and levels of borrowing cannot indefinitely grow faster than gross domestic product, even though their ability to do so for a time has contributed to economic success over the past few years. If the Fed raises rates sufficiently to assure financial stability, there is the risk that the economy will slow too much. If it focuses on maintaining the growth necessary to meet its inflation target, there is the risk of further increases in leverage and asset prices setting the stage for trouble down the road. – Larry Summers, WashPost
Prescient and he did not even know it.
U.S. Household Net Worth and Nominal GDP
After all, it was under Mr. Summers’ watch in the 1990’s that U.S. asset values, as measured by household net worth, began to significantly diverge from the nominal gross domestic product.
.
.
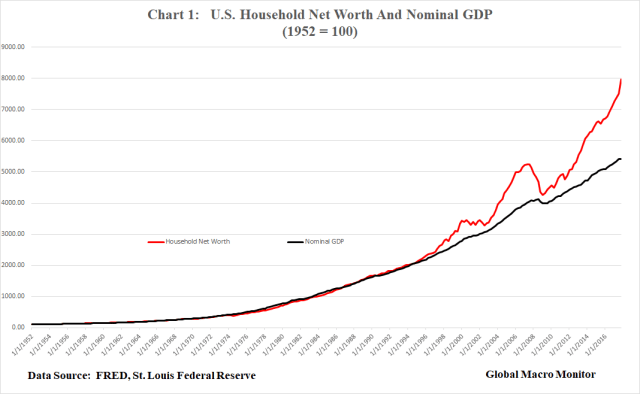
Chart 1 illustrates this point.
More than forty years before 1995, household net worth tracked nominal gross domestic product in a very tight relationship (note we estimated the last data point in both time series). The largest divergence of the two series prior to 1995 was at the beginning of 1979, when the net worth index, after a decade of inflation, was 12 percent below the GDP index.
Furthermore, it was during the 1970’s; the net worth index was below GDP in every quarter except one, Q4 1972, the Nixon reelection rally. The take away here is that net asset value growth lags nominal GDP growth in periods of relatively high inflation. In other words, inflation has been, historically, bad for assets.
The largest positive divergence of net worth to GDP was 8.41 percent, at the beginning of 1961.
During the 1952-1995 period, household net worth growth would thus mean revert to nominal GDP. Asset prices were closely linked and anchored to the fundamentals of the economy.
Net Worth To GDP Ratio
The above is also illustrated in Chart 2, which shows the ratio of household net worth to GDP. Similarly, during the 1952-1995 net worth remained in a range of 3.15 – 3.87 to nominal GDP and mean reverting to its average of 3.55 during the period.
.
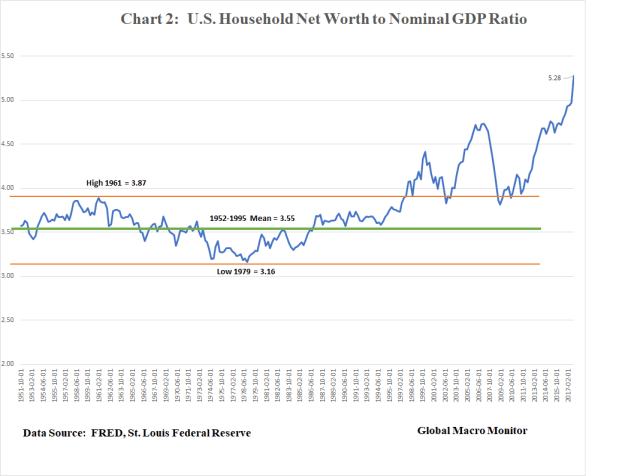
The chart also illustrates household net worth is now completely unhinged from nominal GDP as assets are currently at extreme valuations and this sell-off may be the start of a mean reverting process. Also see the Household Net Worth to Personal Income ratio.
Note how the ratio moved back into the range during the collapse of the NASDAQ in 2001 and the bursting of the credit/housing bubble in 2009. Policymakers deemed it too painful and potentially deflationary to allow assets to mean revert fully and intervened with extraordinary monetary policy, more so after the collapse of the credit bubble.
The result was to push asset values ever higher and away from their fundamental value, albeit, asset valuation is ambiguous and nobody knows their “true value.”
Stock prices are likely to be among the prices that are relatively vulnerable to purely social movements because there is no accepted theory by which to understand the worth of stocks….investors have no model or at best a very incomplete model of behavior of prices, dividend, or earnings, of speculative assets. – Professor Robert Shiller
.
What Happened In The Mid-1990’s?
So why did asset values begin their rapid divergence from the economy in the mid 1990’s?
Nobody knows for certain but we have our priors.
1) Moral Hazard
First, moral hazard was internalized by traders and investors. Though the “Greenspan put” was born almost a decade earlier after the 1987 stock market crash, the 1994-1995 monetary tightening culminated in the collapse of the Mexican peso and set off the Tequila Crisis in emerging markets. The U.S. government had to step in and bailout Mexico with $50 billion-plus in loans.
The Fed moves after the Russian debt crisis, the dot.com collapse, and the bursting of the credit bubble, ultimately led to quantitative easing (QE) with the goal of inflating asset prices.
Many of those bailed out during Mexico’s peso crisis were U.S. investors trapped in the country’s bonds and short-term debt securities. Though we think it was the right thing to do, as a collapse of the Mexican economy was not in the interest of anyone, it did set in motion significant inflationary expectations in financial assets and as consequence institutionalized moral hazard.
2) Money Velocity
Second, the rise of the internet and technological changes fundamentally changed the U.S. economy and its payments system. We do not have time to research the specifics, but we suspect it is reflected in the secular decline in money velocity which peaked in the 1990’s and has fallen ever since with the exception of a small bump just before the credit/bubble popped.
Chart 3 illustrates the coincidental timing of the fundamental divergence in asset values and decline in M2 money velocity. We inverted the velocity axis to show more clear its inverse tracking the net worth series. That is as the money velocity declined, assets values rose relative to nominal GDP.
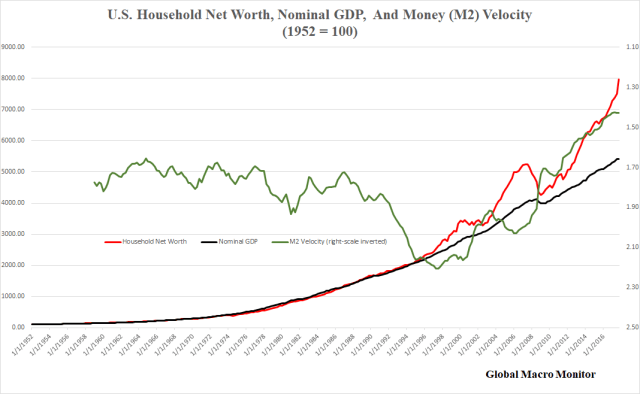
Monetary policy is a complicated beast, and nobody knows exactly why M2 velocity has been falling, just as it difficult to even define money and come up with its true measure. Nevertheless, by definition falling money velocity is a simple mathematical calculation that the money supply is growing faster than nominal GDP. The hypothesis is that the “excess money,” rather than being absorbed into the economy flows into the asset markets.
It is interesting to note the increase in velocity just before the housing/bubble collapse. That is the “excess liquidity” as we just defined was declining leading some to believe it contributed to the bursting the bubble.
Ironically, we awoke this morning to the following tweet. Same concept.

Hat Tip: @Schuldensuehner
This fits our “liquidity über alles” model as we think, above all else, excess liquidity fuels momentum markets and trumps even fundamental valuation in the short and medium-term.
3) Asset Markets Became The Economy
The labor shock caused by the entry of China and Eastern Europe into the global economy contributed to a significant hollowing out the U.S. middle class as policymakers failed to compensate the losers of free trade. They were effectively swept under the rug as globalization took off, corporate profits soared, and consumer prices were held in check with cheap imports. This effect culminated in the 2016 political Black Swan.
Fundamental Shift In Aggregate Demand
It is our contention the decline in the purchasing power of a relatively large swath of Americans, with a relatively high propensity to consume, were crippled and when coupled with the rapid rise in income and wealth inequality aggregate demand has become insufficient to drive economic growth at an adequate pace.
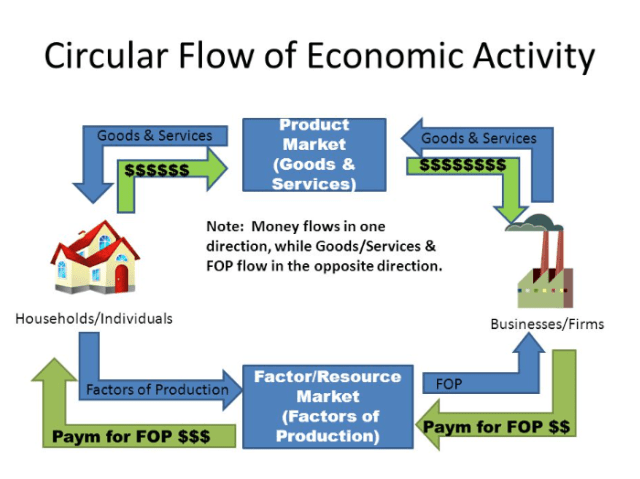
The simple circular flow of income, which we all learned in Econ 101, no longer applies to the new economy. Income needs thus needs a kicker in the form of inflated asset values and household net worth.
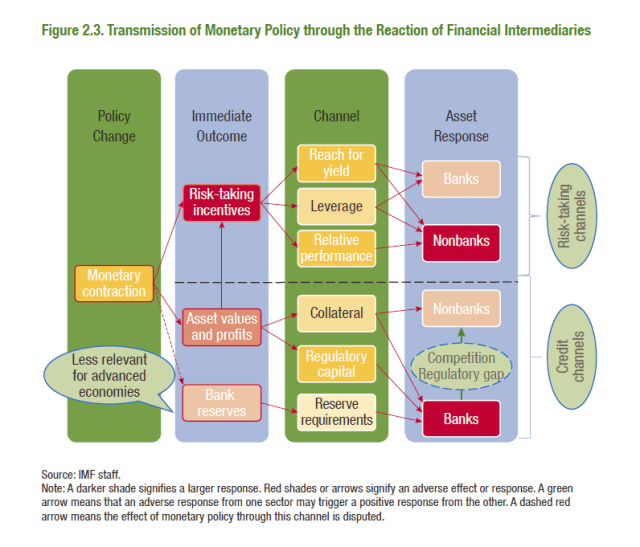
Policymakers therefore have little choice but to keep asset prices high and continue to generate asset inflation to induce consumption through an ever diminishing wealth effect and boost confidence in the business sector to positively influence CapX.
Go no further and look at the new channels of monetary policy in the following chart from the IMF.
Conclusion
Finally, we have no idea if this recent sell-off is the beginning of a major mean reversion to fundamental value for stock prices and asset values. Major, meaning net worth moving back into the 1952-1995 range. We seriously doubt policymakers will stand idly by and let that happen and if markets continue to deteriorate we could soon be back in QE mode.
What is clear from the above charts, however, is that the efficacy and efficiency of monetary policy are diminishing after the bursting of each bubble. As the size of each bubble increases a larger policy response is warranted. We suspect the next round of QE in the U.S. will be the direct buying of corporate equities ala the Bank of Japan.
We doubt this can continue, ad infinitum, however. Either inflation will take hold and/or dollar holders will lose confidence in the currency. Sorry, deflationistas.
Time For Gary Cohn To Step Up
One last thing. After Secretary Mnuchin’s currency debacle in Davos, it would behoove the Trump Administration to keep him in the closet and let Gary Cohn become the face of government during this period of market turbulence. Mr. Mnuchin does not exactly exude confidence, and the new Fed Chair is an untested unknown.
It was comical to watch the money channel today. The financial pundits are seeing only the tip of the iceberg or, it could be, we are seeing icebergs that are just ice cubes? Doubt that.
Good luck, folks.