“Tightening is Easing”
Since U.S. monetary policy began tightening in December 2015, the Fed has added liquidity to the financial system through interest payments to banks on excess reserves and has reduced its surplus to the Treasury adding to the fiscal deficit. Thus the financial system has had an effective injection of central bank liquidity and a fiscal expansion during a period of monetary tighenting.
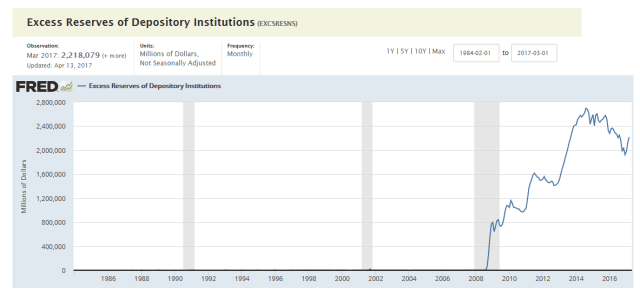
The massive increase in the Federal Reserve’s balance sheet after the 2007-08 financial crisis has significantly changed the nature of monetary policy. We’ve noted this in the chart below and several posts. See here and here.
Interest On Excess Reserves (IOER)
Because of the extremely large amount of excess reserves in the banking system – the liability side of balance sheet expansion — the Fed no longer uses traditional monetary policy. The long-standing monetary policy tool prior to the crisis was draining and adding bank reserves through open market operations to control liquidity, the Fed Funds interest rate, and bank credit.
Now, the Fed uses a new tool — interest on excess reserves (IOER) — to tighten monetary policy and raise interest rates. That is rather than draining it adds liquidity to the financial system in the form of interest payments to the banking system.
We are not certain on how the banks account for this liquidity but suspect they book it as income and either pay it out in dividends or retained earnings to increase their capital. We are also not certain if the Fed sterilizes the IOER.
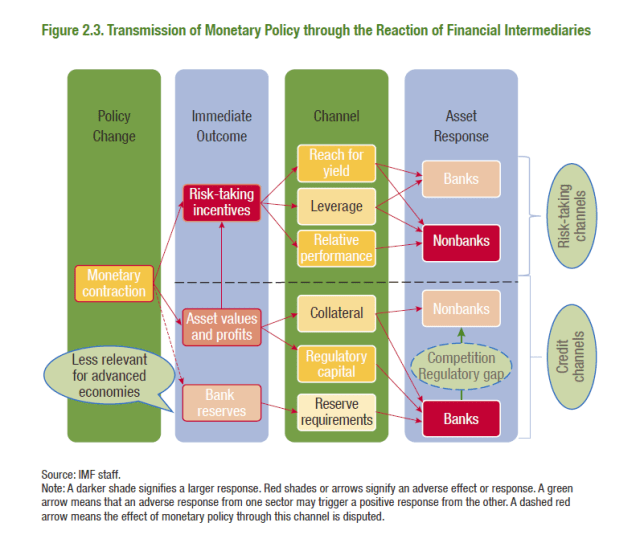
But the above charts show how irrelevant traditional monetary policy – changing bank reserves to tighten credit in the banking system – has become. The monetary transmission mechanism in most developed economies who have engaged in quantitative easing is now highly dependent on the risk-taking channel in the financial markets. There are many reasons for this, including the rise of non-bank banks.
Lower Surplus Returned to Treasury & Larger Fiscal Deficits
On the fiscal side, the expansionary effect of tighter monetary policy has thus far been di minimus as the IOER was only 0.25 percent up until December 2016. The Fed surplus should shrink further as the IOER has increased 50 bps since the last Fed income statements,
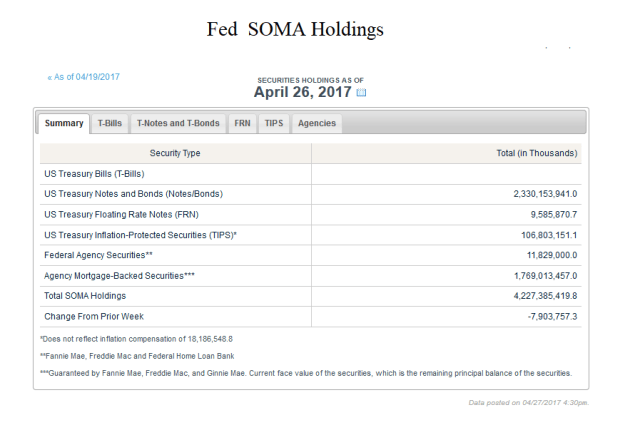
The Federal Reserve Banks’ 2016 estimated net income of $92.7 billion represents a decrease of $7.6 billion from 2015, primarily attributable to a decrease of $2.5 billion in interest income from changes as a result of the composition of securities held in the Federal Reserve System Open Market Account (SOMA) and an increase of $5.2 billion in interest expense associated with reserve balances held by depository institutions. Net income for 2016 was derived primarily from $111.1 billion in interest income from securities held in the SOMA (U.S. Treasury securities, federal agency and government-sponsored enterprise (GSE) mortgage-backed securities, and GSE debt securities). – Federal Reserve, January 2017
As the Fed reduces its balance sheet, its income will shrink more rapidly and add to the U.S. budget deficit. In totality, however, the Fed surplus is rather marginal in the overall federal budget, but we are trying to illustrate what we perceive as a largely unrecognized contradiction of current monetary policy.
Impact of Monetary Policy Tightening
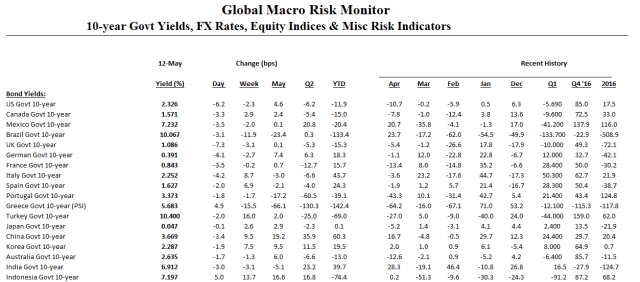
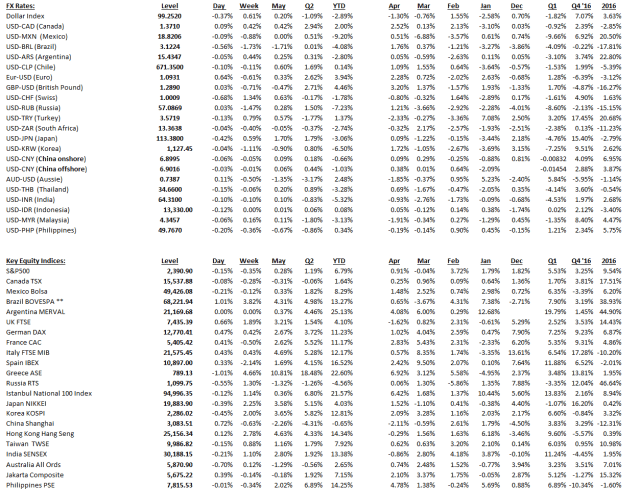
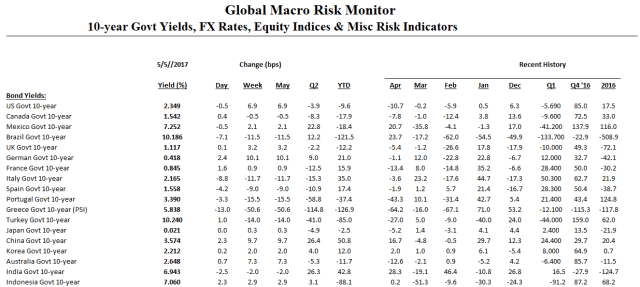
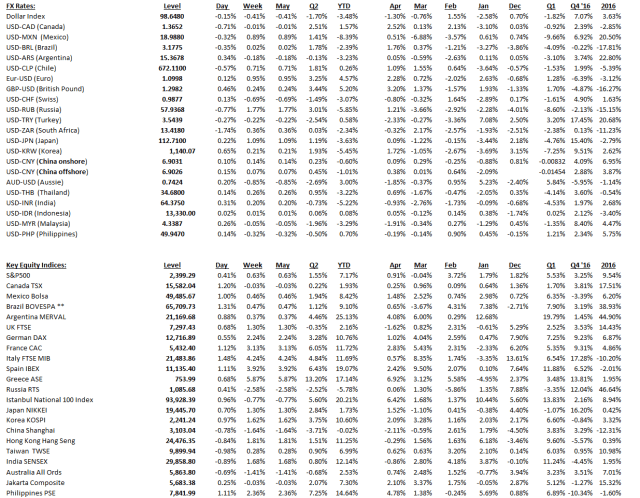
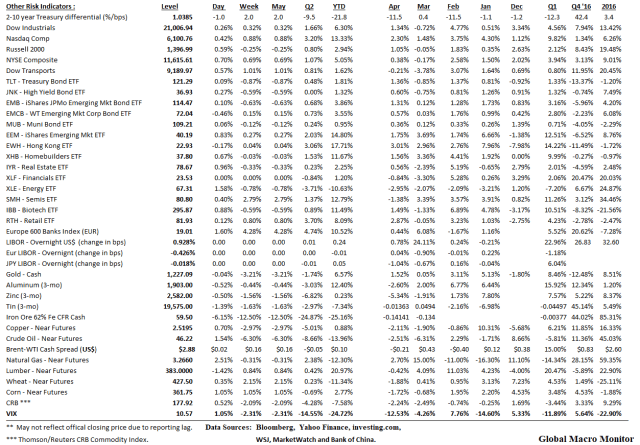
Note how monetary conditions have actually eased since the regime shift in December 2015. The S&P500 has increased 18.2 percent; the 10-year T-Note yield is up only 4.6 bps; the 10 minus 2-year Treasury spread has flattened 26.5 bps; the dollar index is relatively flat, up only 1.09 percent; and commodities (CRB) are up almost 4 1/4 percent.
More impressive, however, is that emerging bonds have rallied almost 8 ½ percent and EM equities are up 26.64 percent. Isn’t this the sector which is supposed to be hit the hardest with tighter money?

Could it be then that money is not tighter, just the price of money has risen marginally from an exceptionally, exceptionally low level to an exceptionally low level?
Reduction of Balance of Sheet
The above analysis leads us to conclude the Fed is kind of painted in a corner, or in a pickle, and would have to raise interest rates to a level too high for their comfort for them to really begin to bite; not to mention what it would do to the federal budget as interest payments on the national debt increase.
Afterall, it was Paul Volcker who said interest rates aren’t rising because they can’t,
Our current debt may be manageable at a time of unprecedentedly low interest rates. But if we let our debt grow, and interest rates normalize, the interest burden alone would choke our budget and squeeze out other essential spending. – Paul Volcker and Pete Peterson, Oct 2016
This may be why the Fed surprised markets by what was thought premature talk of shrinking their balance sheet.
A balance sheet reduction would actually drain liquidity from the financial system, market conditions would most likely tighten through risk aversion, and interest rates could stay lower than they would be with such a large balance sheet. Given asset valuations, the window of a successful soft landing is narrow, however, and this must be done, let us say, “gingerly.”
The downside scenario is if credit really begins to expand (it’s been rather punk lately), the economy accelerates with tight labor markets and inflation takes off. Much of this is up to Congress and fiscal policy dependent.
Conclusion
Monetary policy is a black box and former Fed chair, Alan Greenspan, acknowledged this more than 20 years ago,
There is, regrettably, no simple model of the American economy that can effectively explain the levels of output, employment, and inflation. In principle, there may be some unbelievably complex set of equations that does that. But we have not been able to find them, and do not believe anyone else has either.
Consequently, we are led, of necessity, to employ ad hoc partial models and intensive informative analysis to aid in evaluating economic developments and implementing policy. There is no alternative to this, though we continuously seek to enhance our knowledge to match the ever growing complexity of the world economy. – Alan Greenspan, Decemeber 1996
We concur with Mr. Greenspan and our above analysis is a combination of ad hoc models, imperfect information, which may include wrong information, and best, but calculated guesses.
And even if all our facts are correct, our conclusions may be completely wrong.
To illustrate this, we like to use the story that Abraham Lincoln used to tell to try and persuade juries when he was an Illinois circuit court lawyer.
The story goes that Lawyer Lincoln was worried he had not convinced the jury during the closing argument of a civil case against a railroad. The jurors had gone to lunch to deliberate. Lincoln followed them and interrupted their dessert with a story about a farmer’s son gripped by panic,
“Pa, Pa, the hired man and sis are in the hay mow and she’s lifting up her skirt and he’s letting down his pants and they’re afixin’ to pee on the hay.” “Son, you got your facts absolutely right, but you’re drawing the wrong conclusion.”
The jury ruled in Lincoln’s favor.
The upshot? Monetary policy seems to have become less of a calculation of what is the right amount of reserves in the banking system to maintain a certain Fed Funds interest rate target to more of a guessing game — of how effective the Fed is at gaming the markets and, more important, what is the “tipping point” interest rate where monetary tightening really begins to reduce aggregate demand and slow the economy.
No judgment here on Fed policymakers, however. We recognize they have one tough job.
Finally, thanks to our good friend in Darien for sparking our thinking and originally pointing out the Orwellian nature of current U.S. monetary policy.
Don’t bet the farmer’s ranch on our analysis.