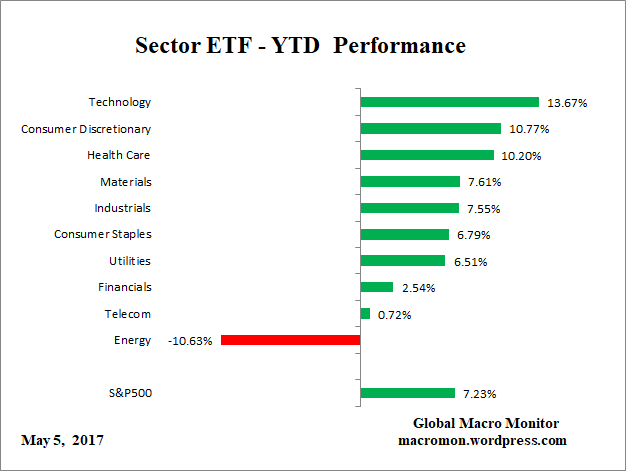
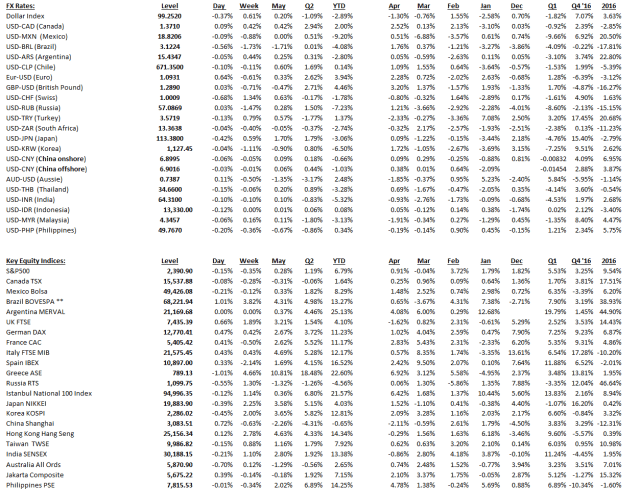
Click on table to enlarge and for better resolution
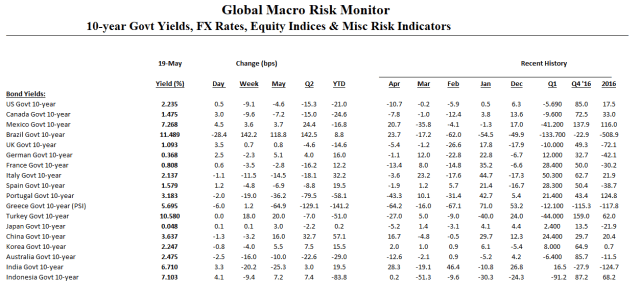
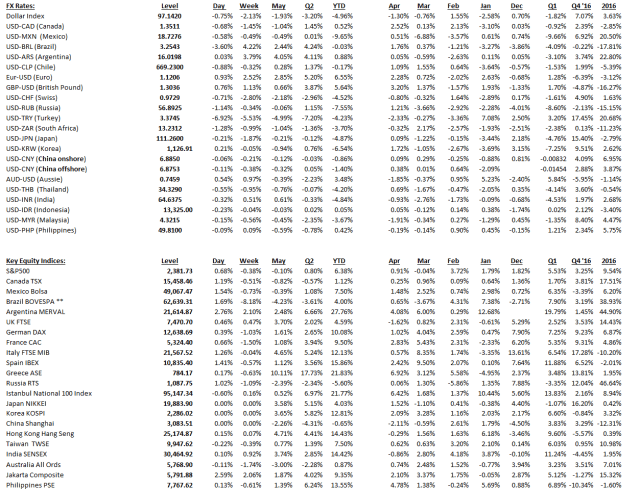
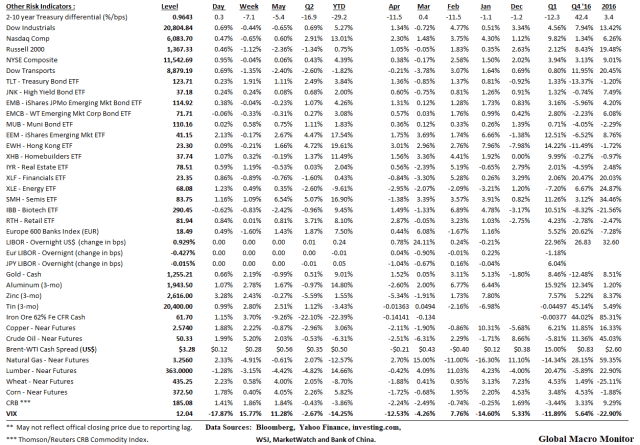
Click on table to enlarge and for better resolution
In our latest post, Beware Shorting Impeachments, we noted:
Bad things tend to happen in the world when the U.S. administration is distracted and looks weakened by political scandal. And, believe us, there is a legion of bad things out there just waiting to happen, all of which are stock market negative. – Global Macro Monitor
We just found this tidbit of history from Politico of how during the Watergate scandal the Nixon administration was melting down and the President retreated to self-medication,
The Nixon administration began disintegrating—the president unable to play his role as the leader of the nation and the free world—at 7:55 p.m. on October 11, 1973.
The newly appointed secretary of state, Henry Kissinger, picked up his telephone. His trusted aide at the National Security Council, Brent Scowcroft, was on the line from the White House. The Arab-Israeli war of 1973 was in its fifth day, escalating toward a global crisis and a potential nuclear conflict.
SCOWCROFT: The switchboard just got a call from 10 Downing Street to inquire whether the president would be available for a call within 30 minutes from the prime minister. The subject would be the Middle East.
KISSINGER: Can we tell them no? When I talked to the president he was loaded.
President Richard Nixon—ravaged by more than four years of war in Vietnam, 15 months of Watergate investigations and countless nights of intense insomnia—was incapacitated. – Politico
Wow! POTUS was hammered as the world spiraled toward nuclear conflict and incapable of taking “the call.”
This further confirms our suspicions that domestic political scandals, such as Watergate, distorts and weakens the global perception — and maybe not just perception — of U.S. leadership in the world. And contributed, at least, partially, to the 1973 Yom Kippur War and subsequent economic crisis caused by the related OPEC embargo.
It was only nine days later after the above account by Politico the Saturday Night Massacre took place.
If past is prologue, as Trumpgate thickens we suspect the world may become more unstable. As an example, the behavior of, say, North Korea may become more nefarious as they perceive the U.S. administration weakened and distracted. This already seems to be the case, no?
This only adds to the “wall of worry” and checks over bullishness and probably why the market refuses to correct.
Thank goodness President Trump doesn’t drink, but he does seem to find release — i.e., self-medicate — through his Twitter account. And recent history shows that one “bad” tweet can do more damage and be more self-destructive to a Presidency than, say, five martinis. Gulp!
We’ve analyzed the behavior of the S&P500 during the Watergate impeachment hearings and the Clinton impeachment. If you’re shorting risk markets solely based on speculation that President Trump may be impeached, maybe you should think again.
Let’s first look at the Clinton impeachment S&P500. The market never seemed to take the Clinton impeachment seriously and was never a threat to the stock market.
Then we’ll analyze the more complicated Watergate scandal, which many consider the main culprit of the 1973/74 bear market, a 50 percent decline in S&P500 from January 11, 1973 to October 3, 1974.
Finally, we will take a look at Trumpgate and introduce you to our newest political Six Sigma political thriller.
Clinton Impeachment
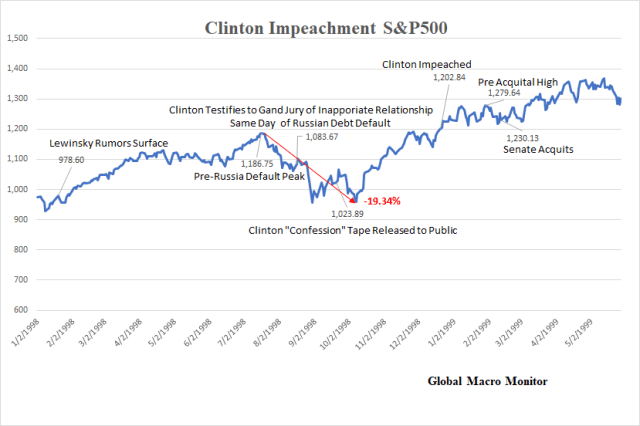
The rumors of the Clinton-Lewinsky affair broke January 19, 1998, on the Drudge Report, which was a market holiday. Recall U.S. stocks were in a rip-roaring bull market and massive bubble that saw the Dow rise 253 percent during the Clinton administration, second only to Calvin Coolidge’s roaring twenties bull market (see here for Presidential Stock Returns). The NASDAQ, home of the infamous dot.coms, rose a multiple of the Dow.
The table below shows the timeline of various key events and the S&P500 returns.

Even after the news broke and the “blood was in the water” — recall the media frenzy, probably crazier than now because it involved sex — U.S. stocks continued to march higher. The S&P500 rose another 21.27 percent until its peak pre-Russia debt default high of 1,186.75 on July 17th.
Summer of 1998 – Russian Debt Default
Ironically, Russia announced its debt default the same day President Clinton testified to the grand jury he had an “inappropriate relationship” with Ms. Lewinsky on August 17th. The global markets fell apart and what was a garden variety correction in the S&P500 sharply accelerated.
The Brazian stock market fell 16 percent on September 10th. The Fed was forced to cut interest rates several times in just 7 weeks. Systemic risk was rising rapidly as Long-Term Capital Management (LTCM) ultimately failed and was bailed out by a consortium of financial institutions in late September.
The total decline in S&P500 during this period was 19.34 percent finally bottoming on August 31, many months before the global economic crisis ended.
Was the financial crisis of 1998 the result of the fear of Clinton being impeached? Hardly, or should we be blunter – NFW!
Remember, the U.S. had the “Committee to Save the World.”
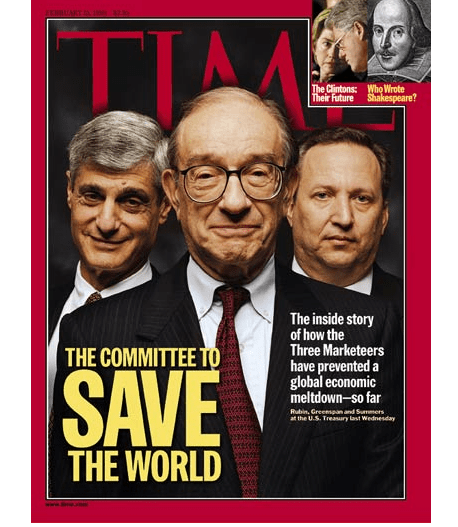
The 1998 financial crisis was mainly the result of Russia’s debt default and the subsequent huge global margin call. Hedge funds were big in Russian debt that had defaulted forcing them to sell many of their assets, say, even their Safeway bonds. As credit spreads significantly widened in almost every credit instrument, the extremely levered LTCM with all its Nobel laureates tanked.
Even if you believe the march toward impeachment was a contributing factor in the ’98 financial crisis, it wasn’t, or it needed a sufficient condition, and was not even a necessary condition, in our opinion. We will admit there is a possibility the Clinton administration was distracted by the scandal and may not have allowed or wanted Russia to default.
We lost a lot of money betting Russia was “too nuclear to fail” even as we were in the euro bonds the Russians continued to pay. At one point, these bonds with 9 plus percent coupons fell into the teens with current yields of over 60 percent. There were no buyers in sight. If only we held on, but couldn’t as we were too levered.
Later, we will make the argument that Watergate may have been the necessary condition of the 1973/74 bear market, but the OPEC embargo was the sufficient condition.
Impeachment and Acquittal
By the time President Clinton was impeached in the House of Representatives on December 19th, the S&P500 was up 23 percent since the Lewinsky rumors first surfaced. The Senate acquitted President Clinton on February 12, 1999, and with S&P500 up 26 percent since the start of the scandal, “the long national nightmare” of the bankrupt impeachment short sellers was over.
The S&P500 continued higher for another year, finally bursting on March 24, 2000, up 56 percent from the day of discovery of the Clinton-Lewinsky affair.
What we did learn in 1998 was that stock market bubbles don’t pop easily. That is until they do.
Watergate Scandal
The analysis of Watergate on the stock market is a little more difficult to unpack as it involved the conflation of three major “rock your world” events:
1) A nasty bear market that took the S&P500 down almost 50 percent from January 1973 to October 1974;
2) A potential constitutional crisis (never the case during the Clinton impeachment) as it was uncertain if the White House would turn over “the tapes“. President Nixon fired the Special Prosecutor who was charged to oversee the federal criminal investigation in Watergate;
3) And we think, most important, was the first OPEC oil embargo that shook the global economy on October 16, 1973

The break-in of the Democratic National Committee headquarters in the Watergate apartment complex took place in the summer of 1972. It took several months before it hit the front pages as national news and became a Presidential scandal. Bob Woodward and Carl Bernstein, now household names, were urban beat reporters rendered to the back pages of the Washington Post when they were assigned to the Watergate story.
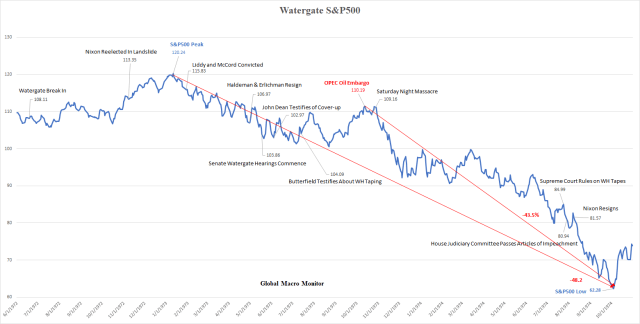
The S&P500 was in rally mode going into the 1972 landslide reelection of Richard Nixon. The index peaked on January 11, 1973, at 120.24 and would not regain that level until more than 7 years later. From the day of the Watergate break-in until the January peak, the S&P500 rose 11.22 percent.
Liddy and McCord Convictions
On January 30, 1973, two members of President Nixon’s re-election committee were convicted for the Watergate break-in.
“…two former officials of President Nixon’s re-election committee, G. Gordon Liddy and James W. McCord, Jr. were convicted yesterday of conspiracy, burglary and bugging the Democratic Party’s Watergate headquarters.”
– Washington Post, January 31, 1973
Game on, Watergate.
Short-term Bottom
The S&P500 continued to decline through the summer until making a short-term low on August 22nd at 100.53, down 16 percent from the January high. It then rallied 11 percent for two months peaking on October 26th.
At this point, the S&P500 was only down 7.4 percent even after the John Dean testimony to Congress and the Saturday Night Massacre and the OPEC oil embargo, of which both occurred just a week before. Similarly ironic, the OPEC oil embargo and the Saturday Night Massacre occurred in the same week as did the Clinton confession to the grand jury and Russian debt default happened on the same day.
.
The double shock of OPEC, raising the price of oil by 70 percent with further cuts in production to follow, coupled with the Saturday Night Massacre, raising the specter of a constitutional crisis in the U.S., sent the global economy and markets into a tailspin.
As the chart illustrates, these two events marked the end of the short-term rally. The S&P500 proceeded to fall another 43.5 percent through the resignation of President Nixon on August 8, 1974, until it bottomed on October 3, 1974.
From its January 1973 high until the resignation of President Nixon in August 1974, the S&P500 fell 32 percent.
OPEC or Watergate?
So we ask you, folks, what was the main cause of the 1973/74 bear market and 50 percent decline of S&P500? Watergate or OPEC?
Structural Economic Damage of OPEC
Nobody knows for certain, but we maintain speculate that if the global economy had not suffered the structural damage from the OPEC shock, the Watergate scandal would have been just noise and the S&P500 would’ve probably not even entered a bear market and suffered only a normal correction. That is unless Nixon sent tanks out onto Pennsylvania Avenue.
Though the S&P500 bottomed less than two months after President Nixon resigned, it didn’t regain its January 1973 high until July 17, 1980. The stagnation of the 1970’s brought on by the structural damage to and the massive realignment of the global economy of the OPEC shocks definitely took a major long-term toll on the financial markets.
Yom Kippur War
An argument can be made that Watergate distracted and weakened the Nixon administration, which emboldened the Arab nations that attacked Israel during the Yom Kippur War in early October 1973. The Nixon Administration responded with Operation Nickel Grass, a strategic airlift to deliver weapons and supplies to Israel.
This was after the Soviet Union began sending arms to Syria and Egypt. The Arab nations of OPEC, in retaliation to Operation Nickel Grass, raised the posted price of oil on October 16. The actions of the Soviets and OPEC may have been the result that they and the world perceived the U.S. weak due to a domestic political scandal. Pure supposition on our part.
So, Watergate, a necessary condition to the 1973/74 bear market? Maybe.
What About Trumpgate?
So far no hard facts and no smoking gun, at least that is publicly known, no John Dean testimony, no tapes.
But potentially more complicated. The underlying allegations are much more serious than covering up of a third rate political burglary and lying about, well, you know. Also, a much wider net that could consist of many things, including improper business transactions that took place prior to taking office.
Lots of incompetence, strange and suspicious behavior from the administration, combined with speculation, rumors, coincidences, and what appears to be circumstantial evidence of some sort of a coverup, and the punditry in a feeding frenzy desperately trying to connect the dots. Once again, a total media circus.
Oh yes, and the appointment of the highly and widely respected Special Counsel, Robert Mueller, to “oversee the previously-confirmed FBI investigation of Russian government efforts to influence the 2016 presidential election and related matters.”
Though the appointment of Mueller illustrates just how serious the matter is, and is becoming, it should be seen as a positive by both those who suspect President Trump is guilty of something as it takes the specter of a constitutional crisis off the table. And for those who believe the President has done nothing wrong, the appointment of the Special Counsel should vindicate him. All other things being equal, the Mueller appointment should be a positive for the markets.
Unless President Trump fires the Special Counsel.
Furthermore, doesn’t it seem like President Trump is making a special effort to go out of his way just to troll his political opponents?
Conclusion
Granted the initial conditions of these three cases differ greatly. Valuations, liquidity conditions, and the structure of the global economy all have changed dramatically. But as illustrated in our analysis, it is usually not a great idea to short stocks based solely on an impeachment trade. In fact, we tend to agree with what Professor Jeremy Siegal of the Wharton School said yesterday on CNBC,
“If Donald Trump resigned tomorrow I think the Dow would go up 1,000 points,” – Jeremy Siegel, May 17, 2017
The corollary is that the Republican pro-economic growth agenda is then accelerated as the political distraction, incompetence and protectionist bias of the current administration are removed. And that the policies are passed before the 2018 election, which the Republicans are becoming increasingly vulnerable to losing both houses of Congress.
The downside scenario is that the investigation lingers, the bad news keeps dripping out, nothing gets done, the Democrats take the House in 2018 and introduce impeachment hearings. That may be the most likely scenario and stocks won’t like it, especially given their high valuations.
Our sense, the Republicans may believe this scenario and double up their efforts to unify and get something done quickly — that is going to the “two-minute offense” — as the clock runs out. Stock positive.
One Big Caveat
Noted in our analysis are the two big “coincidences” of bad things concurrently occurring at tipping points during the two impeachment proceedings. The Russian default on the same day President Clinton confessed to the grand jury and the OPEC oil embargo during the same week of Watergate’s Saturday Night Massacre. Coincidences?
Bad things tend to happen in the world when the U.S. administration is distracted and looks weakened by political scandal. And, believe us, there is a legion of bad things out there just waiting to happen, all of which are stock market negative.
And then there is “wag the dog“.
The 6 Sigma Event: President Pelosi in 2019
Finally, you know we like to think outside the box here at the Global Macro Monitor and live in the fat tails.
Contemplate this 6 sigma scenario:
Bad news for Trump continues to leak out and staffers and acquaintances are indicted all through the rest of 2017 and 2018. The Democrats take the House and Senate in a landslide in November 2018.
Impeachment charges are brought both against President Trump and Vice President Pence, say, as a co-conspirator on obstruction of justice charges in the firing of James Comey.
It’s 2019 and the Dems control the House and the Senate with comfortable majorities.
The House impeaches the President and Vice President. The Senate convicts both.
Who is next in line to assume the Presidency? The Speaker of the House, Nancy Pelosi?
The probability? Six sigma or about 2 * 10^-9 or two in a billion. Most likely, even much, much lower.
Hey, but good stuff for a political thriller or fodder for the House of Cards, no?
“Tightening is Easing”
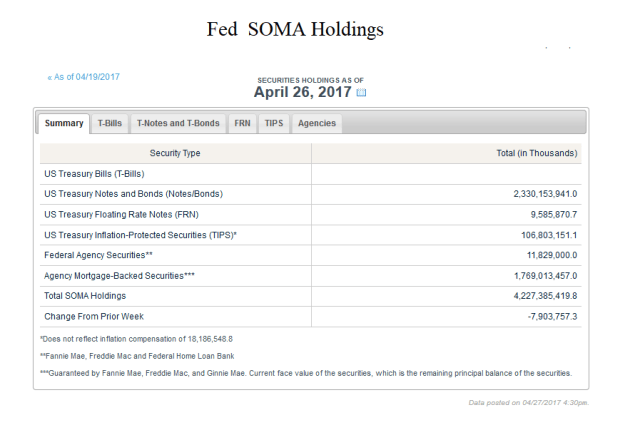
Since U.S. monetary policy began tightening in December 2015, the Fed has added liquidity to the financial system through interest payments to banks on excess reserves and has reduced its surplus to the Treasury adding to the fiscal deficit. Thus the financial system has had an effective injection of central bank liquidity and a fiscal expansion during a period of monetary tighenting.
The massive increase in the Federal Reserve’s balance sheet after the 2007-08 financial crisis has significantly changed the nature of monetary policy. We’ve noted this in the chart below and several posts. See here and here.
Interest On Excess Reserves (IOER)
Because of the extremely large amount of excess reserves in the banking system – the liability side of balance sheet expansion — the Fed no longer uses traditional monetary policy. The long-standing monetary policy tool prior to the crisis was draining and adding bank reserves through open market operations to control liquidity, the Fed Funds interest rate, and bank credit.
Now, the Fed uses a new tool — interest on excess reserves (IOER) — to tighten monetary policy and raise interest rates. That is rather than draining it adds liquidity to the financial system in the form of interest payments to the banking system.
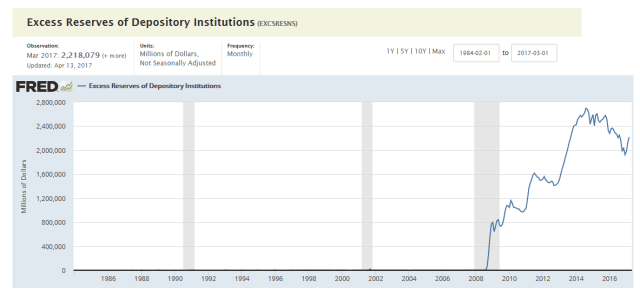
We are not certain on how the banks account for this liquidity but suspect they book it as income and either pay it out in dividends or retained earnings to increase their capital. We are also not certain if the Fed sterilizes the IOER.
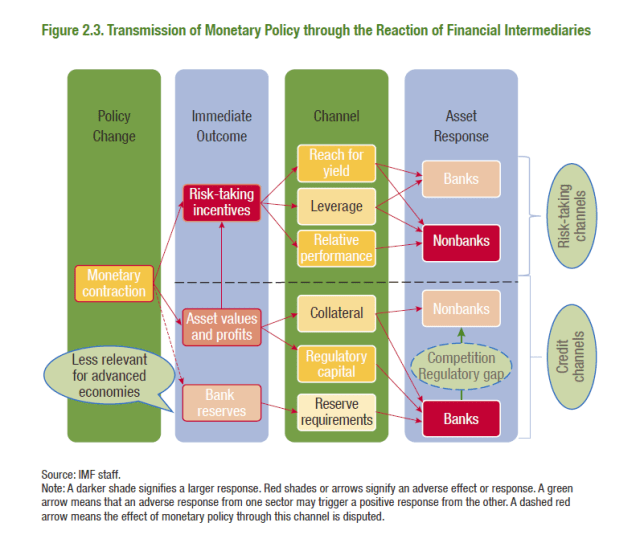
But the above charts show how irrelevant traditional monetary policy – changing bank reserves to tighten credit in the banking system – has become. The monetary transmission mechanism in most developed economies who have engaged in quantitative easing is now highly dependent on the risk-taking channel in the financial markets. There are many reasons for this, including the rise of non-bank banks.
Lower Surplus Returned to Treasury & Larger Fiscal Deficits
On the fiscal side, the expansionary effect of tighter monetary policy has thus far been di minimus as the IOER was only 0.25 percent up until December 2016. The Fed surplus should shrink further as the IOER has increased 50 bps since the last Fed income statements,
The Federal Reserve Banks’ 2016 estimated net income of $92.7 billion represents a decrease of $7.6 billion from 2015, primarily attributable to a decrease of $2.5 billion in interest income from changes as a result of the composition of securities held in the Federal Reserve System Open Market Account (SOMA) and an increase of $5.2 billion in interest expense associated with reserve balances held by depository institutions. Net income for 2016 was derived primarily from $111.1 billion in interest income from securities held in the SOMA (U.S. Treasury securities, federal agency and government-sponsored enterprise (GSE) mortgage-backed securities, and GSE debt securities). – Federal Reserve, January 2017
As the Fed reduces its balance sheet, its income will shrink more rapidly and add to the U.S. budget deficit. In totality, however, the Fed surplus is rather marginal in the overall federal budget, but we are trying to illustrate what we perceive as a largely unrecognized contradiction of current monetary policy.
Impact of Monetary Policy Tightening
Note how monetary conditions have actually eased since the regime shift in December 2015. The S&P500 has increased 18.2 percent; the 10-year T-Note yield is up only 4.6 bps; the 10 minus 2-year Treasury spread has flattened 26.5 bps; the dollar index is relatively flat, up only 1.09 percent; and commodities (CRB) are up almost 4 1/4 percent.
More impressive, however, is that emerging bonds have rallied almost 8 ½ percent and EM equities are up 26.64 percent. Isn’t this the sector which is supposed to be hit the hardest with tighter money?

Could it be then that money is not tighter, just the price of money has risen marginally from an exceptionally, exceptionally low level to an exceptionally low level?
Reduction of Balance of Sheet
The above analysis leads us to conclude the Fed is kind of painted in a corner, or in a pickle, and would have to raise interest rates to a level too high for their comfort for them to really begin to bite; not to mention what it would do to the federal budget as interest payments on the national debt increase.
Afterall, it was Paul Volcker who said interest rates aren’t rising because they can’t,
Our current debt may be manageable at a time of unprecedentedly low interest rates. But if we let our debt grow, and interest rates normalize, the interest burden alone would choke our budget and squeeze out other essential spending. – Paul Volcker and Pete Peterson, Oct 2016
This may be why the Fed surprised markets by what was thought premature talk of shrinking their balance sheet.
A balance sheet reduction would actually drain liquidity from the financial system, market conditions would most likely tighten through risk aversion, and interest rates could stay lower than they would be with such a large balance sheet. Given asset valuations, the window of a successful soft landing is narrow, however, and this must be done, let us say, “gingerly.”
The downside scenario is if credit really begins to expand (it’s been rather punk lately), the economy accelerates with tight labor markets and inflation takes off. Much of this is up to Congress and fiscal policy dependent.
Conclusion
Monetary policy is a black box and former Fed chair, Alan Greenspan, acknowledged this more than 20 years ago,
There is, regrettably, no simple model of the American economy that can effectively explain the levels of output, employment, and inflation. In principle, there may be some unbelievably complex set of equations that does that. But we have not been able to find them, and do not believe anyone else has either.
Consequently, we are led, of necessity, to employ ad hoc partial models and intensive informative analysis to aid in evaluating economic developments and implementing policy. There is no alternative to this, though we continuously seek to enhance our knowledge to match the ever growing complexity of the world economy. – Alan Greenspan, Decemeber 1996
We concur with Mr. Greenspan and our above analysis is a combination of ad hoc models, imperfect information, which may include wrong information, and best, but calculated guesses.
And even if all our facts are correct, our conclusions may be completely wrong.
To illustrate this, we like to use the story that Abraham Lincoln used to tell to try and persuade juries when he was an Illinois circuit court lawyer.
The story goes that Lawyer Lincoln was worried he had not convinced the jury during the closing argument of a civil case against a railroad. The jurors had gone to lunch to deliberate. Lincoln followed them and interrupted their dessert with a story about a farmer’s son gripped by panic,
“Pa, Pa, the hired man and sis are in the hay mow and she’s lifting up her skirt and he’s letting down his pants and they’re afixin’ to pee on the hay.” “Son, you got your facts absolutely right, but you’re drawing the wrong conclusion.”
The jury ruled in Lincoln’s favor.
The upshot? Monetary policy seems to have become less of a calculation of what is the right amount of reserves in the banking system to maintain a certain Fed Funds interest rate target to more of a guessing game — of how effective the Fed is at gaming the markets and, more important, what is the “tipping point” interest rate where monetary tightening really begins to reduce aggregate demand and slow the economy.
No judgment here on Fed policymakers, however. We recognize they have one tough job.
Finally, thanks to our good friend in Darien for sparking our thinking and originally pointing out the Orwellian nature of current U.S. monetary policy.
Don’t bet the farmer’s ranch on our analysis.
Wow! More than half of the U.S. population lives in only 144 counties or just about 4.5 percent of the total number of counties throughout the United States.
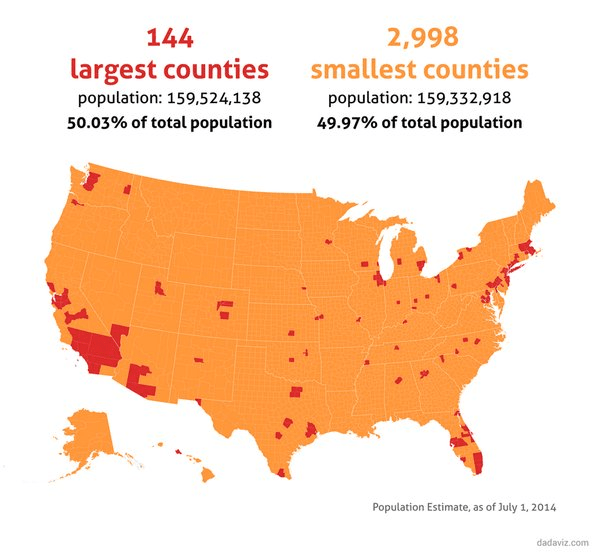
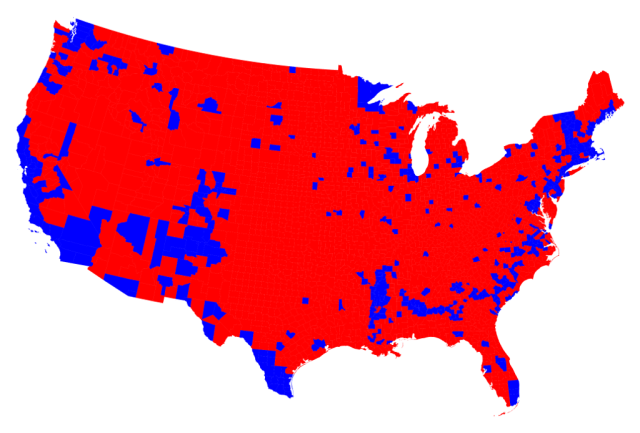
Keep that context when you see one of these political maps.
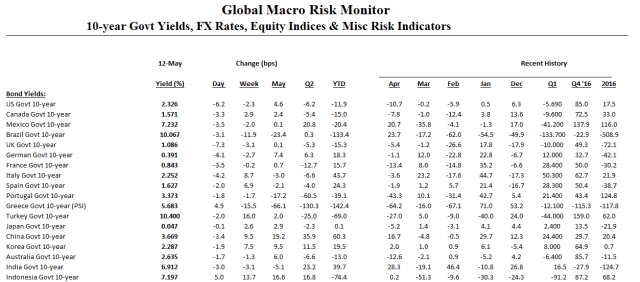
Click on table to enlarge and for better resolution

The way, the why, the timing of the firing of FBI Director, James Comey, baffles us. No partisanship here, however.
But now we worry. We wrote in February,
When we held positions overnight on Wall Street, we used to go home worried about global instability and what was going on in the “Arab Street.” Now we worry about the American Street. – Circus Trumps Politic
We often worry about the growing fragility of the stability of American society, especially given the rapidly widening wealth gap.
Who would have imagined the actions of a Tunisian street vendor would lead to the destabilizing effects of the Arab Spring? Let us not allow the failure of our imagination to catch us off guard, folks.
Could the firing of Comey be the tipping point that sparks political instability in the most stable democracy in the world? We don’t know and we sure hope not.
But the social fabric of our society sure seems fragile to us. Keep it on your radar.
Here you have it, folks, a one stop chart.
The chart below shows the total outstandings of Treasury bonds and notes, the Fed ownership of the total maturities and percentage of outstandings in each year of maturity (note, the data in chart is from January, but the maturities coming due are updated for May 1)
Almost 73 percent, $1.635 trillion, of the Fed’s holdings of Treasury securities comes due in the next 6 years. We expect an announcement of a smoothing of the balance sheet run-off. Unless credit begins to expand at a decent clip, such a large reduction in the monetary base over such a short time could be onerous for the economy, for example.
Also, note the limited maturities in the early 2030’s. This is the result of the budget surpluses and lack of issuance in the late Clinton years and President Bush’s decision to suspend the 30-year early on in his administrations, which contributed to the housing/credit bubble.
Stay tuned.