Fed Ownership of Yield Curve and Balance Sheet Reduction

Here you have it, folks, a one stop chart.

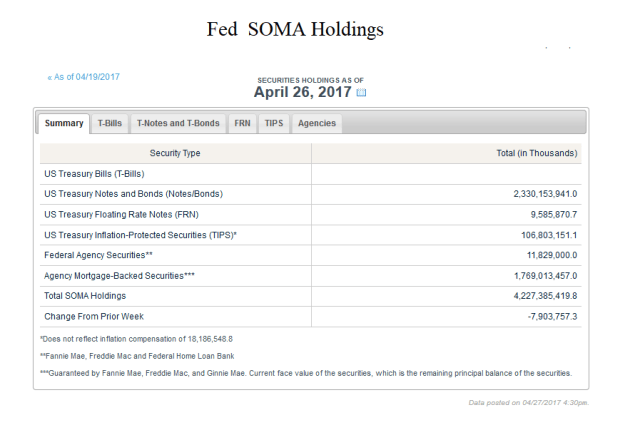
The chart below shows the total outstandings of Treasury bonds and notes,  the Fed ownership of the total maturities and percentage of outstandings in each year of maturity (note, the data in chart is from January, but the maturities coming due are updated for May 1)

Almost 73 percent, $1.635 trillion,  of the Fed’s holdings of Treasury securities comes due in the next 6 years.    We expect an announcement of a smoothing of the balance sheet run-off.   Unless credit begins to expand at a decent clip,  such a large reduction in the monetary base over such a short time could be onerous for the economy, for example.

Also, note the limited maturities in the early 2030’s.   This is the result of the budget surpluses and lack of issuance in the late Clinton years and President Bush’s decision to suspend the 30-year early on in his administrations, which contributed to the housing/credit bubble.

Stay tuned.

Fed Treasury Curve_FoFSoma Holdings_FED

Posted in Bonds, Monetary Policy, Uncategorized | Tagged , , , , | Leave a comment

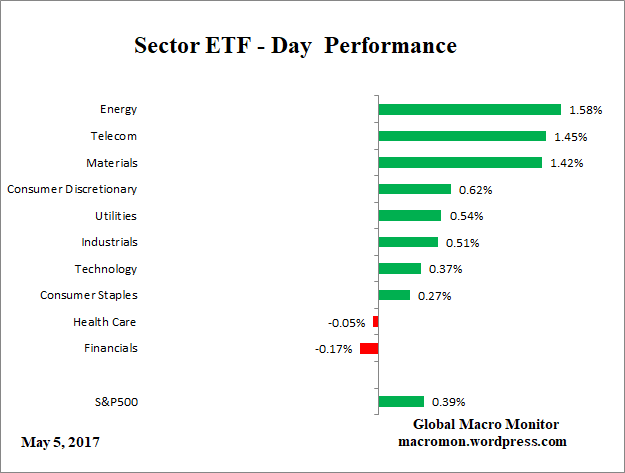
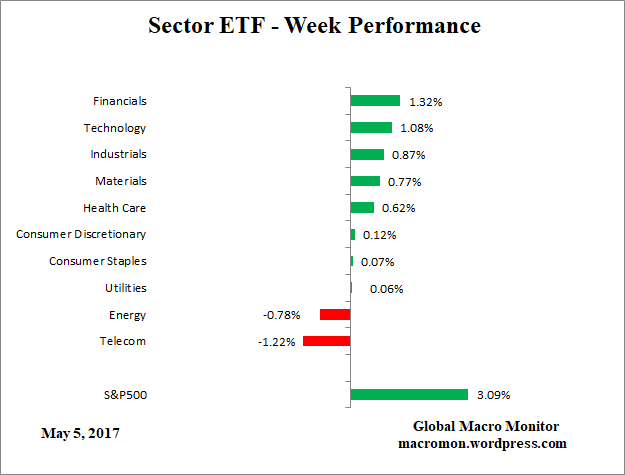
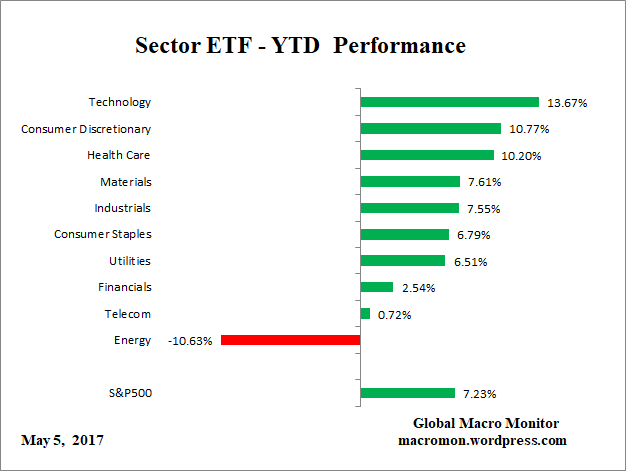
US Sector ETF Performance – May 5

ETF_DayETF_WeekETF_YTD

Posted in Sector ETF Peformance, Uncategorized | Tagged , | Leave a comment

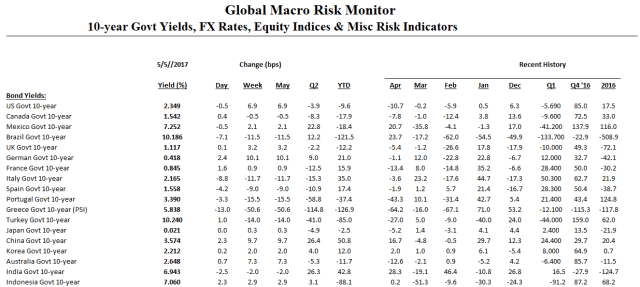
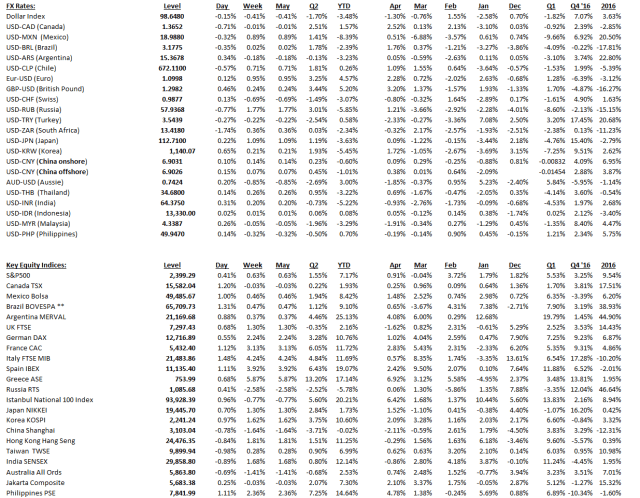
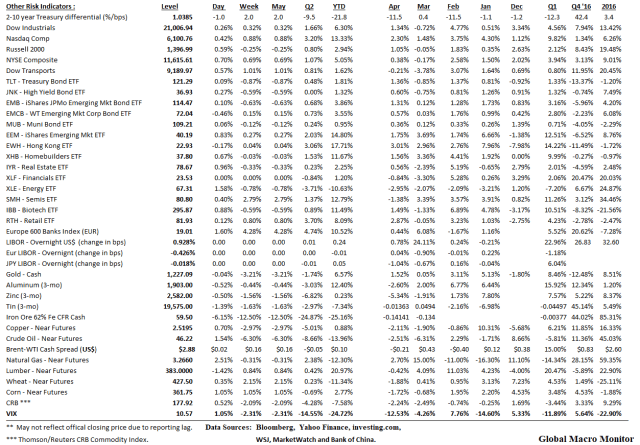
Global Risk Monitor – May 5

Click on table to enlarge and for better resolution

RiskMon_1RiskMon_2RiskMon_3

Posted in Daily Risk Monitor, Uncategorized | Tagged , , , , , | Leave a comment

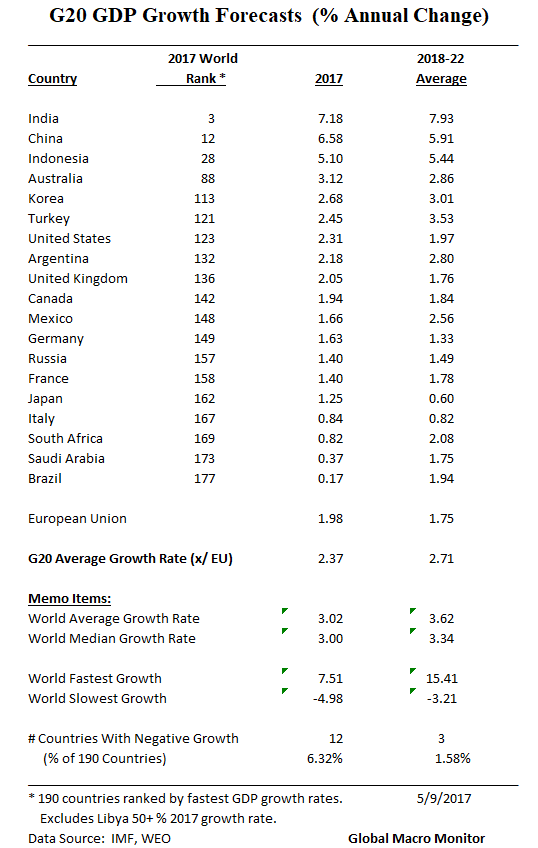
The World’s Fastest Growing Economies

We have updated with the latest 2017 estimates and 2018-22 average annual forecasts and ranked the world’s country 2017 GDP forecasts in the ginormous table below.  The data are from the April  2017 IMF’s World Economic Outlook.   A little bump up in world growth from our last tables, which incorporates the post-Trump world.

But, first, check out the G20.

G20 Gwoth_WEO

.

World Gwoth_WEO

.


Posted in Economics, Uncategorized | Tagged , | Leave a comment

French Oat-German Bund 10-year Spread

The Oat-Bund 10-year spread came in almost 20 bps after last Sunday’s first round of the French presidential election.   The Euro strengthened v. the dollar about 1 1/2 percent and was up about 2.3 percent for the month of April.

We expect Macron to win easily next week — unless some Black Swan event/revelation this week, which, of course, is unpredictable — and European markets to take off into the rest of the year.   This should also help overall risk markets to rally.  Irrespective of overvaluation.

The latest OpinionWay/PresiTrack poll predicts Mr Macron will win 60 per cent of the vote on Sunday May 7 after a slight dip in his numbers over the past few days.

His rival whose figures have consistently sat in the 34 to 40 per cent range, is predicted to come in second place.

Mr Macron saw a sharp rise in his poll figures at the start of this week on Monday when he jumped from 46 per cent to 81 per cent in the number of people who believe he will win. 

However in stark contrast, only 56 per cent of the questioned voters would like to see him win the election.  –  Sunday Express

Oat-Bund Yield Spread

Posted in Eurozone Sovereign Spreads, France, Uncategorized | Tagged , | Leave a comment

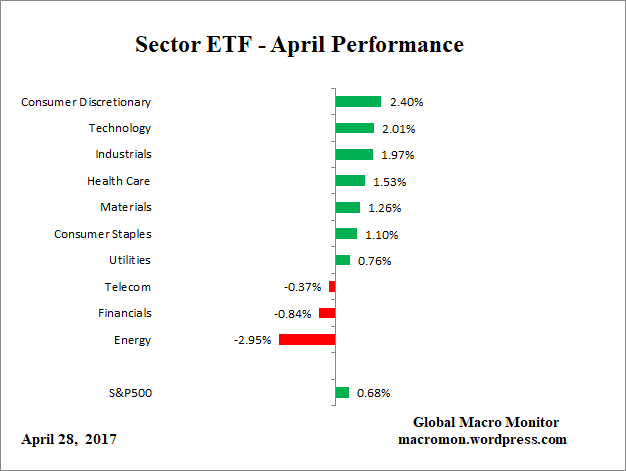
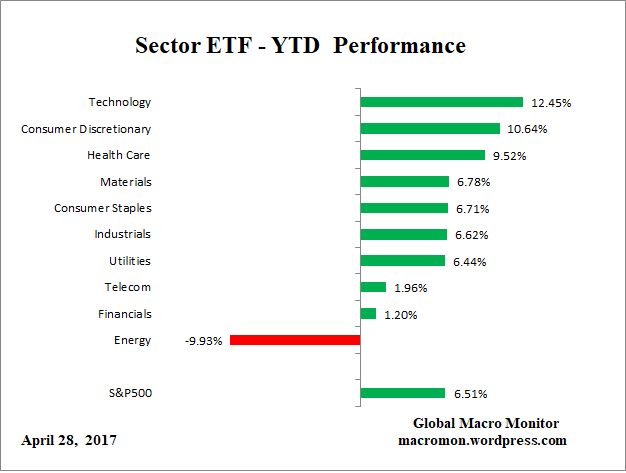
US Sector ETF Performance – April 28

ETF_DayETF_WeekETF_MonthETF_YTD

Posted in Sector ETF Peformance, Uncategorized | Tagged , | Leave a comment

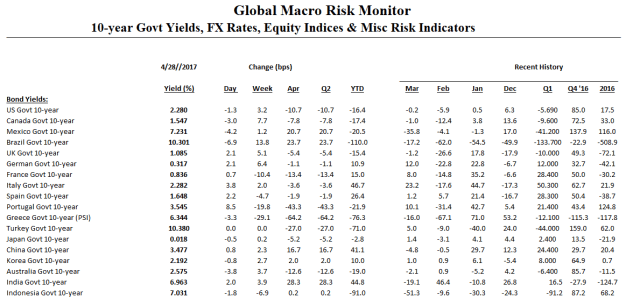
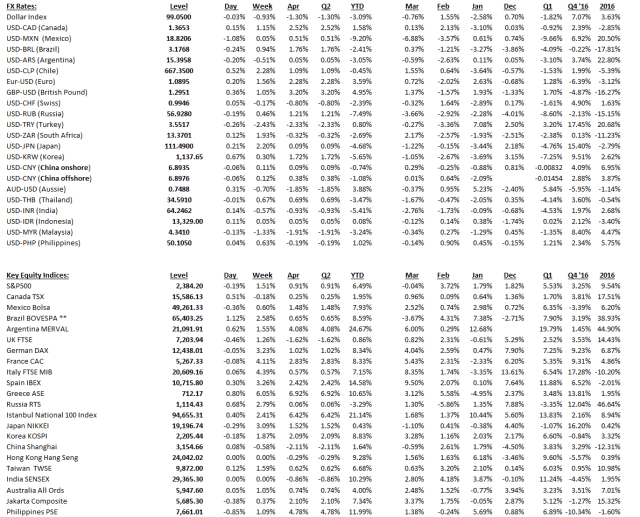
Global Risk Monitor – April 28

Click on table to enlarge and for better resolution

RiskMon_1RiskMon_2RiskMon_3

Posted in Daily Risk Monitor, Uncategorized | Tagged , , , , , | Leave a comment

COTD: Where Your Tax Dollars Go

 More than half of every dollar went to health care, military last year – MarketWatch
.
Tax Dollars
Posted in Fiscal Policy, Uncategorized | Tagged , | Leave a comment

QOTD 2.0: More Inflation Cometh

The question is:  Has the aircraft carrier of rising global inflation finally left port?

Big fiscal stimulus planned in U.S. with labor shortages.  Hmm….  And tariffs on imports increasing.

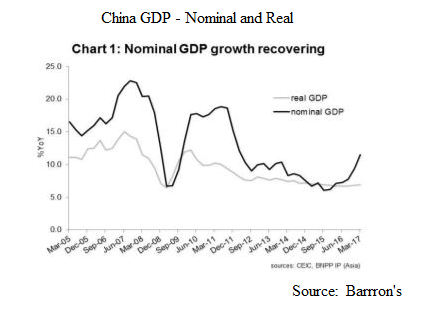
Even China has reversed its deflationary forces.

China_GDP

You know when aircraft carriers build up a head of steam,  they are difficult to turn and slow down.  I once read that “it took  4 nautical miles at full reverse to stop the carrier”, USS Forrestal.

But, we have no doubt, central banks are going to allow inflation to run hot for awhile.   Beats and easier to contain than deflation.   That is until they panic.

The return of inflation a new market theme?  Stay tuned.

Euro zone inflation jumped to 1.9 percent in April from 1.5 percent in March driven by energy prices, flash data showed Friday. Inflation is now at its highest level since 2013.

The biggest increase among the main components was seen in services, which rose to 1.8 percent from 1 percent in March. – CNBC

Posted in Euro, Fiscal Cliff Monitor, Inflation/Deflation, Uncategorized, US Releases | Tagged , | 2 Comments

QOTD: Inflation Cometh

The key takeaway from this morning’s punk GDP report:

Meanwhile, Inflation advanced at a 2.4% annual pace in the first quarter, according to the personal-consumption expenditures, or PCE index. The PCE index–the preferred inflation gauge of the Federal Reserve–easily topped the central’s bank’s 2% target for the first time in several years.  – MarketWatch

Posted in Economics, Inflation/Deflation, Uncategorized | Tagged , , | Leave a comment