The butterfly effect is the concept that small causes can have large effects. Initially, it was used with weather prediction but later the term became a metaphor used in and out of science.
In chaos theory, the butterfly effect is the sensitive dependence on initial conditions in which a small change in one state of a deterministic nonlinear system can result in large differences in a later state. The name, coined by Edward Lorenz for the effect which had been known long before, is derived from the metaphorical example of the details of a tornado (exact time of formation, exact path taken) being influenced by minor perturbations such as the flapping of the wings of a distant butterfly several weeks earlier. Lorenz discovered the effect when he observed that runs of his weather model with initial condition data that was rounded in a seemingly inconsequential manner would fail to reproduce the results of runs with the unrounded initial condition data. A very small change in initial conditions had created a significantly different outcome. — Wikipedia
On this day in history, June 28, 1914, the driver for Archduke Franz Ferdinand, nephew of Emperor Franz Josef and heir to the Austro-Hungarian Empire, made a wrong turn onto Franz Josefstrasse in Sarajevo.
Just hours earlier, Franz Ferdinand narrowly escaped assassination as a bomb bounced off his car as he and his wife, Sophie, traveled from the local train station to the city’s civic city. Rather than making the wrong turn onto Franz Josef Street, the car was supposed to travel on the river expressway allowing for a higher speed ensuring the Archduke’s safety.
Yet, somehow, the driver made a fatal mistake and tuned onto Franz Josef Street.
The 19-year-old anarchist and Serbian nationalist, Gavrilo Princip, who was part of a small group who had traveled to Sarajevo to kill the Archduke, and a cohort of the earlier bomb thrower, was on his way home thinking the plot had failed. He stopped for a sandwich on Franz Josef Street.
Seeing the driver of the Archduke’s car trying to back up onto the river expressway, Princi seized the opportunity and fired into the car, shooting Franz Ferdinand and Sophie at point-blank range, killing both.
That small wrong turn, a minor perturbation to the initial conditions, or deviation from the original plan, set off the chain events that led to World War I.

Stumbling Into The Great War
Fearing Russian support of Serbia, Franz Josef would not retaliate by invading Serbia unless he was assured he had the backing of Germany. It is uncertain as to whether the Kaiser gave Franz Josef Germany’s unequivocal support. Russia, fearing Germany would intervene, mobilized its troops forcing Germany’s hand.
The great European powers thus stumbled into a war they didn’t want through complicated entanglements and alliances, and miscalculation. Russia backing Serbia; France aligned with Russia, Germany backing the Austro-Hungarian Empire; and Britian, who really didn’t have a dog in the fight except her economic interests, aligned with France and Russia.
Later the U.S. would enter the war due to Germany’s unrestricted submarine warfare threatening American merchant ships and the Kaiser floating the idea of an alliance with Mexico in the famous Zimmerman Telegram, which was intercepted by the British.
Of course, some will argue that Great War in Europe was inevitable
The great Prussian statesman Otto von Bismarck, the man most responsible for the unification of Germany in 1871, was quoted as saying at the end of his life that “One day the great European War will come out of some damned foolish thing in the Balkans.” It went as he predicted. – History.com
Nevertheless, maybe the course of history would have been different if not for that wrong turn on June 28, 1914, which created the humongous butterfly effect, which we still experience the consequences this very day.
The botched Treaty of Versailles sowed the seeds the for World II. The War contributed to the Russian revolution and Cold War. The redrawing of borders in the Middle East after the War created the conditions for the instability and breakdown to tribalism the region experiences today.
A map marked with crude chinagraph-pencil in the second decade of the 20th Century shows the ambition – and folly – of the 100-year old British-French plan that helped create the modern-day Middle East.
Straight lines make uncomplicated borders. Most probably that was the reason why most of the lines that Mark Sykes, representing the British government, and Francois Georges-Picot, from the French government, agreed upon in 1916 were straight ones. — BBC News
If Franz Ferdinand had not been murdered on this day in history, that conflict between the Serbs and the Austro-Hungarian Empire may have been contained to just the Balkans. Maybe.
The butterfly effect. Think how many small events, decisions, mistakes, one small turn, or “minor perturbations” in plans have had enormous consequences in your own personal life.

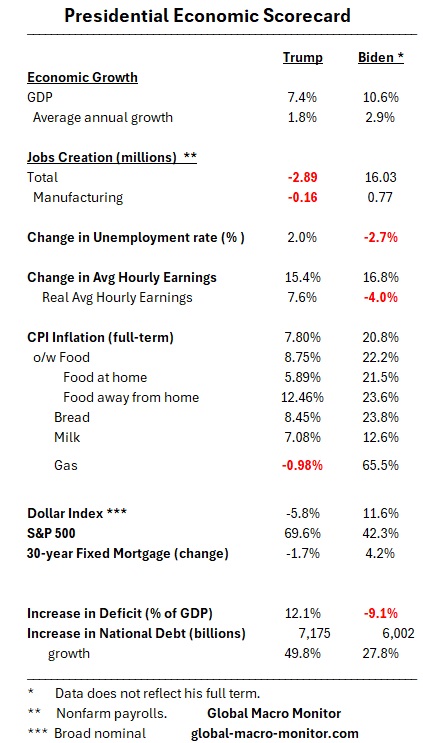
As we prepare for tonight’s debate, let’s take a closer look at the economic scorecard. President Biden has overseen a stronger economy compared to former President Trump, but his tenure has also been marked by significantly higher inflation. Biden inherited a budget deficit of approximately 15% of GDP and increased stimulus spending, which was supported by the Federal Reserve’s monetary policies. This combination has contributed to the current inflation, for which Biden is accountable.
In contrast, Trump’s presidency was significantly impacted by the COVID-19 pandemic and the resulting economic shutdowns, leading to the largest quarterly GDP drop on record. Additionally, for the first time in history, core CPI inflation saw three consecutive months of negative readings.
While the data is skewed by the pandemic, the sitting president, for good or for bad owns the economic conditions during their tenure. Think Jimmy Carter, who was faced with the OPEC II oil crisis and the Iran hostage situation, both largely outside his administration’s control yet it cost him his reelection.
The Japanese yen’s dramatic decline underscores the powerful influence of the Federal Reserve on global markets. Japanese authorities find their intervention efforts ineffective as the yen touched a 38-year low against the dollar. The persistent strength of the US dollar, driven by the Fed’s “higher for longer” interest rate policy, highlights the relevance of the Interest Rate Parity (IRP) model in current FX market dynamics. This model, which ties exchange rate movements to interest rate differentials, is particularly pertinent as high US borrowing costs draw money into the dollar, strengthening it further.

Despite Tokyo’s interventions, the yen’s decline illustrates Japan’s limited control over its currency amid US monetary dominance. Investors and analysts point to the need for the Fed to ease its policies to alleviate the yen’s slide. The current scenario exemplifies how global financial markets are deeply interconnected, with US policy decisions exerting widespread influence. More than $7 trillion in foreign currency trades occur daily, dwarfing the $140 billion average daily trade in global goods and services.

The yen’s depreciation also illustrates the challenges central banks face in stabilizing their currencies against a backdrop of divergent monetary policies and robust economic conditions in the US.
Key Points

Exchange Rate Determination Models
Exchange rates are a crucial component that facilitates the over $30 trillion in annual trade of global goods and services. On any given day, FX traders utilize various models of exchange rate determination, either explicitly or act as if they do, in their trading strategies. The following are a concise overview exchange rate modes:
Current FX Market Trends:
These models are a sample of several that provide a comprehensive framework for understanding the complex factors that influence exchange rates in the global economy. Each model highlights different aspects of the economic environment, including price levels, interest rates, financial markets, and international trade flows.
* Although not a traditional economic model, traders widely use technical analysis to predict short-term exchange rate movements. This approach relies on historical price data, chart patterns, and statistical indicators to forecast future price movements.
The above was based on and motivated by a recent Bloomberg article.
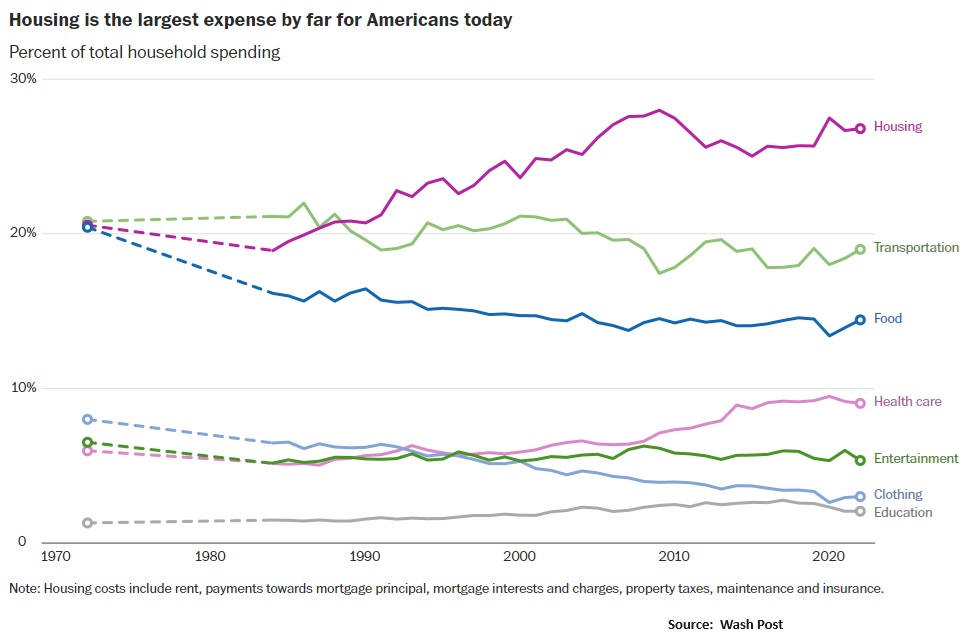
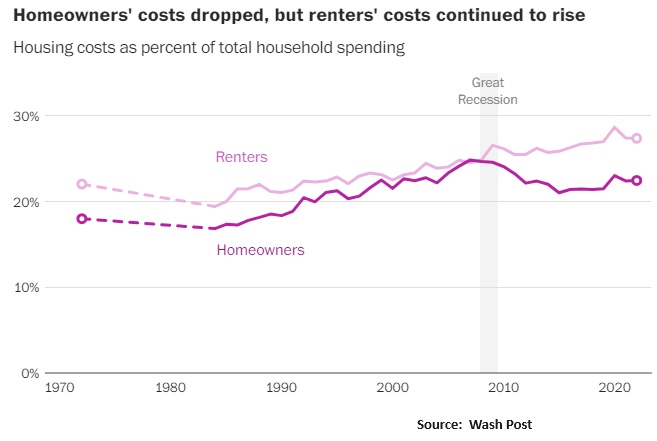
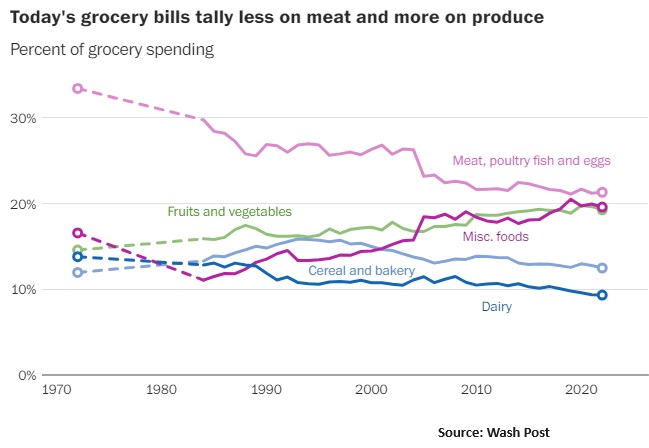
Over the past fifty years, American household spending has significantly changed due to technological advancements, globalization, and evolving socio-economic factors. Housing costs have dramatically increased, consuming 27% of household budgets today compared to 19% in 1984, fueled by the chronic housing shortage and escalating construction costs. Conversely, food expenditures have decreased from 20% to 14% of household budgets, thanks to efficiency gains in agriculture that have halved food costs since 1972. Healthcare spending has surged, driven by industry consolidation and increased demand for medical services, despite technological advances that have generally curbed costs in other sectors. Healthcare spending per capita in the U.S. is nearly double that of other wealthy nations.
Clothing expenses have plummeted due to globalization and the outsourcing of production, which has reduced prices but drastically lowered the proportion of garments made in the U.S. In 1972, most, if not all, clothing was made in the United States. Today, the share is around 3 percent.
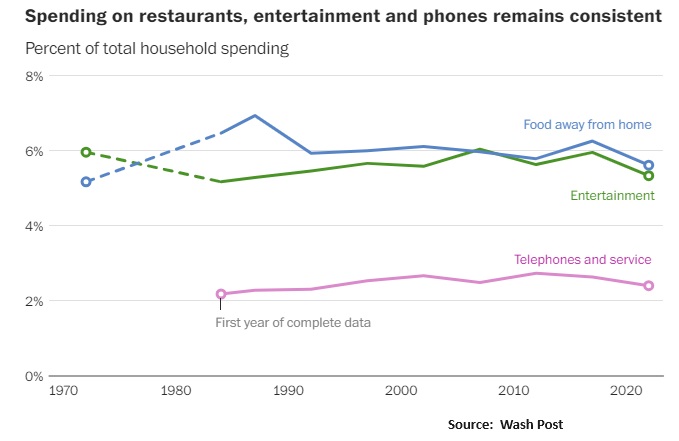
Meanwhile, spending on entertainment and dining out has remained stable, reflecting enduring consumer value in these categories. The shift towards mobile communications from landlines illustrates the impact of technology on consumer habits. Healthcare is expected to claim an increasing share of consumer budgets, particularly as the population ages, signaling continuous growth in healthcare demand. These shifts offer a clear view into the evolving priorities and economic pressures shaping American life.
The above analysis summarizes a recent article in the Washington Post. The data are from the Bureau of Labor Statistics’ Consumer Expenditure Survey
Great piece in the Washington Post today about trendy baby names.
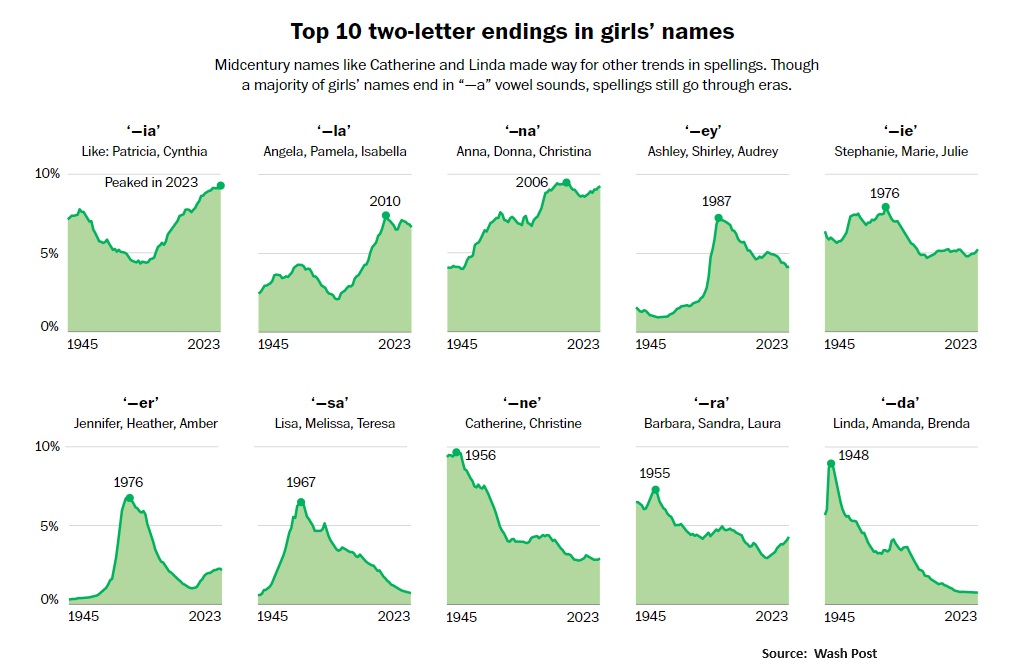
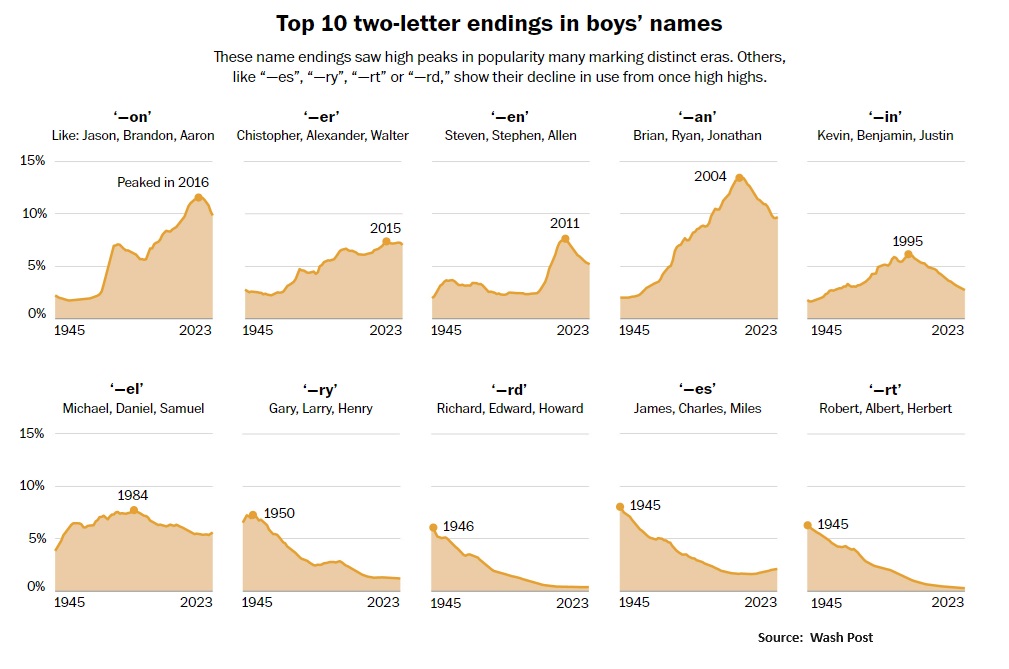
Wattenberg has a theory…she calls her “grand theory” of baby names… In the olden days, Americans shared a monoculture dominated by three broadcast TV networks, no internet and no annual SSA name rankings. Hence the frequent reliance on family tradition when a bouncing baby arrived.
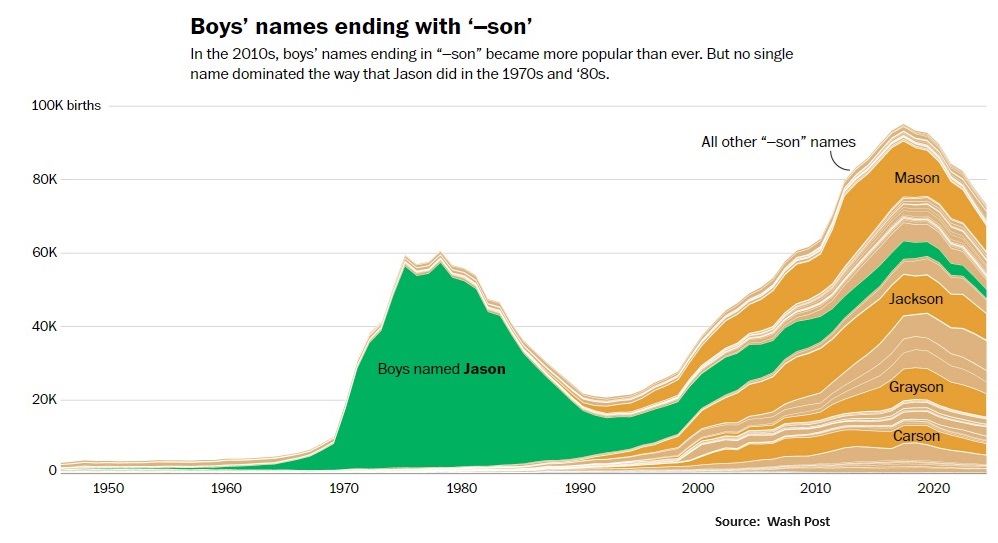
Nowadays, she said, people not only have access to unlimited cable channels and the internet, but those innovations have helped usher in a “username creation” mentality — meaning that if someone else has the same name, it’s viewed as taken. So parents tend to tweak their baby’s name just a bit — keeping the “-son,” for example, while swapping the “Ja-” for “Car-.”
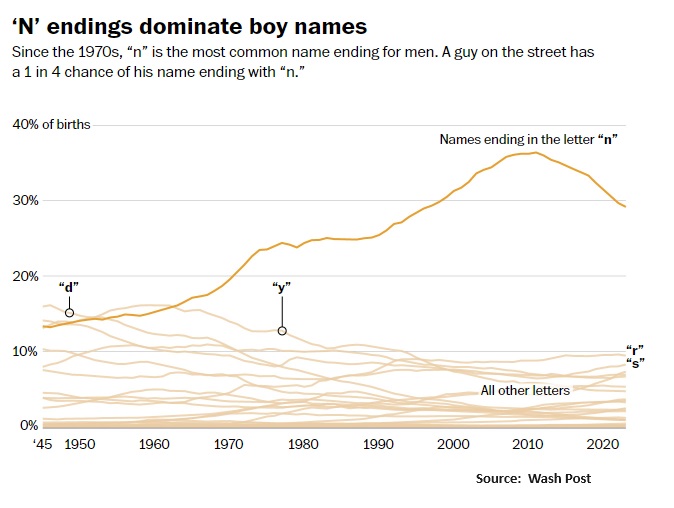
Wattenberg finds “an incredible irony” in this. People think they’re choosing something totally unique, but they do it in a way that winds up moving with the zeitgeist. As a result, names have a , with nearly half of all baby names now following identifiable suffix trends — a phenomenon Wattenberg calls “lockstep individualism.” – Washington Post
Baby names often encapsulate the trends and cultural shifts of their times, with different spellings and endings marking distinct generational identities. A detailed analysis of American baby names from 1945 to 2023 highlights these shifts, showcasing how names evolve from traditional to unique and trendy variations.
Key Points:
This analysis not only shows how names can reflect broader cultural trends but also illustrates the personal and societal factors that influence these choices over decades.


In the spirit of yesterday’s post, AI’s Impact On Energy Demand, a whimsy repost.
Upshot? One gallon of gasoline = the energy equivalent of 54.7K Big Macs.
IBFTP = Blast From The Past
 OK, time for a little fun. You can try this and let us know if it works.
Almost everything today comes down to energy, right?
The rise in food prices is really nothing more than an energy problem. After all, food consumption is about the digestion of calories — one metric of energy measurement – to fuel the human machine.
Scientists have learned to “crack” the energy of foodstuffs, mainly corn and sugar, and convert these into transportation fuel. It gives new meaning to “cracking corn.”
If we could do the reverse and crack highly efficient refined fuels into foodstuffs, for example, we believe we have found the greatest arbitrage of all time.
The Energy Conversion Table below shows that one British Thermal Unit (BTU) is equivalent to 252 calories and one gallon of gasoline is equivalent to 125K BTUs. Therefore, one gallon of gasoline is the energy equivalent of 31.5M calories.
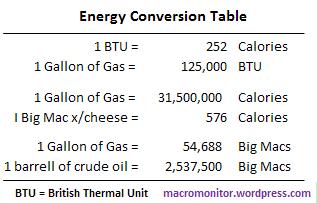
The energy component of a Big Mac without cheese, for example, is 576 calories, so one gallon of gasoline is the energy equivalent of 54,688 Big Macs. Still with us?
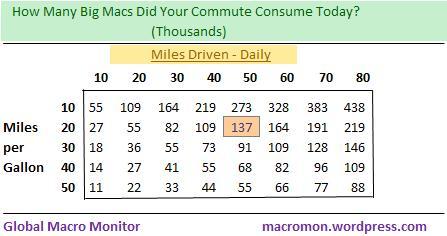
We’ve included the following table/matrix to show that if you drove 50 miles today in a car that gets 20 miles per gallon, you consumed the energy equivalent of 137K Big Macs. Yuck!
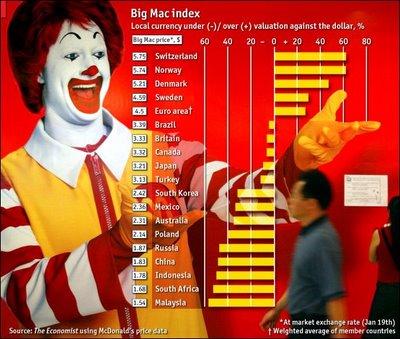
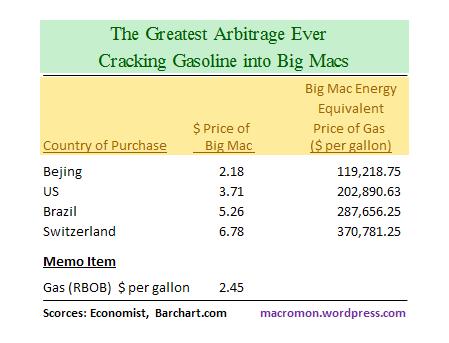
The last table, The Greatest Arbitrage Ever, shows the dollar price of a Big Mac in various countries (no wonder the Brazilians are now aligning with U.S. against China ‘s FX policy) and the Big Mac energy equivalent price of a gallon of gas. That is, one gallon of gas is the energy equivalent to 54,688 Big Macs and with the price of a Big Mac in Brazil at $5.26, the Big Mac energy equivalent price of a gallon of gas in, say Sao Paulo, is $287,656.25.
What an arb, no? Buying a gallon of wholesale gasoline in Rio for $2.45, “cracking” it into 54,688 Big Macs, and selling them at $5.26 for $287,656.25 sounds like a “splendid arbitrage” to us!
Fun exercise and we can’t wait for the e-mails from the economists on this one. Before you waste your time, remember, we’re not serious!
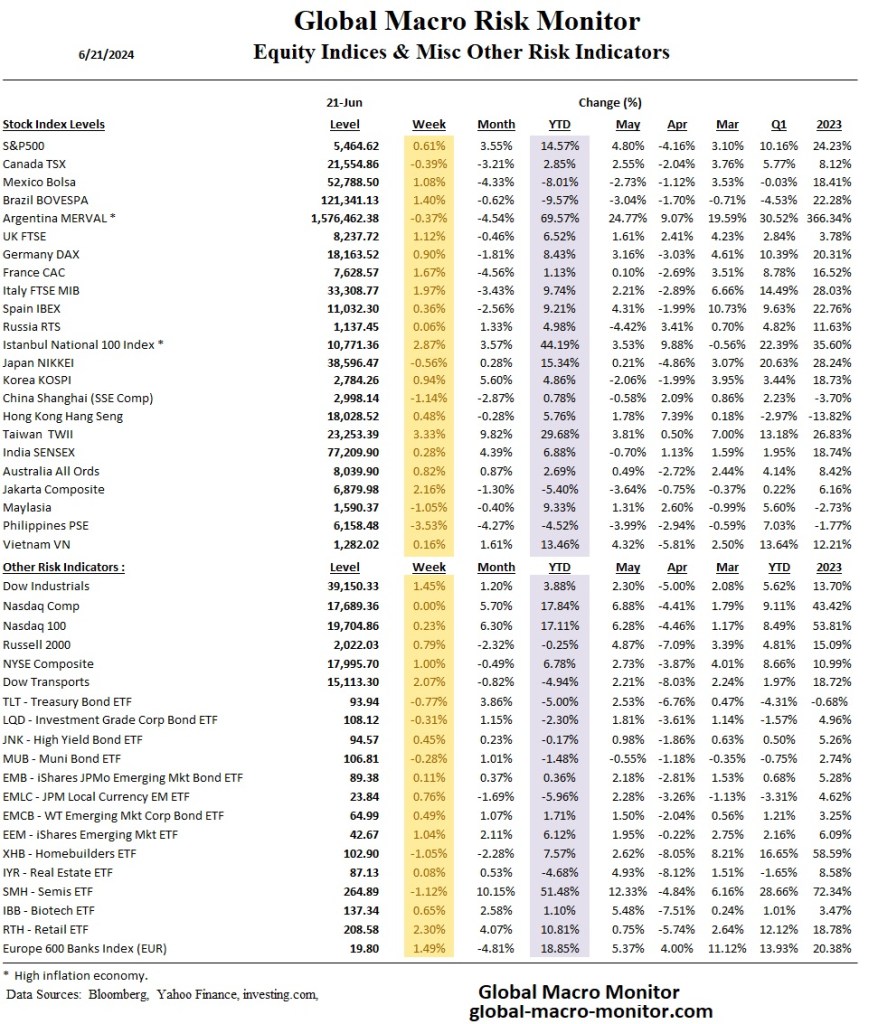
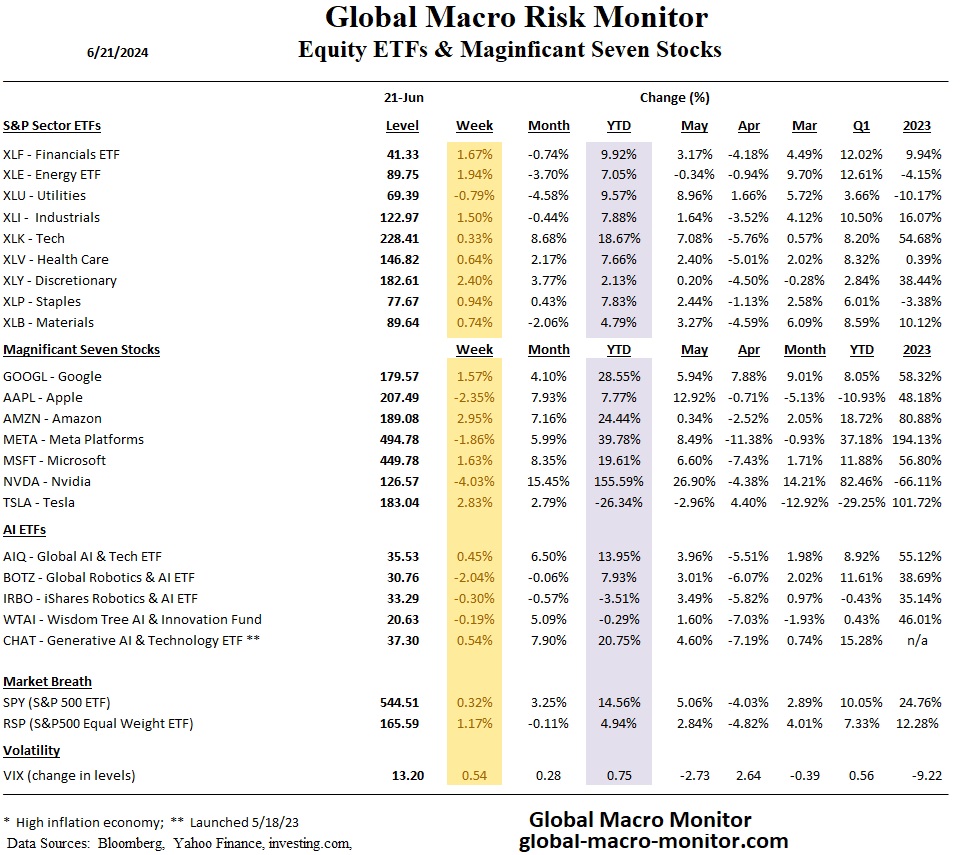
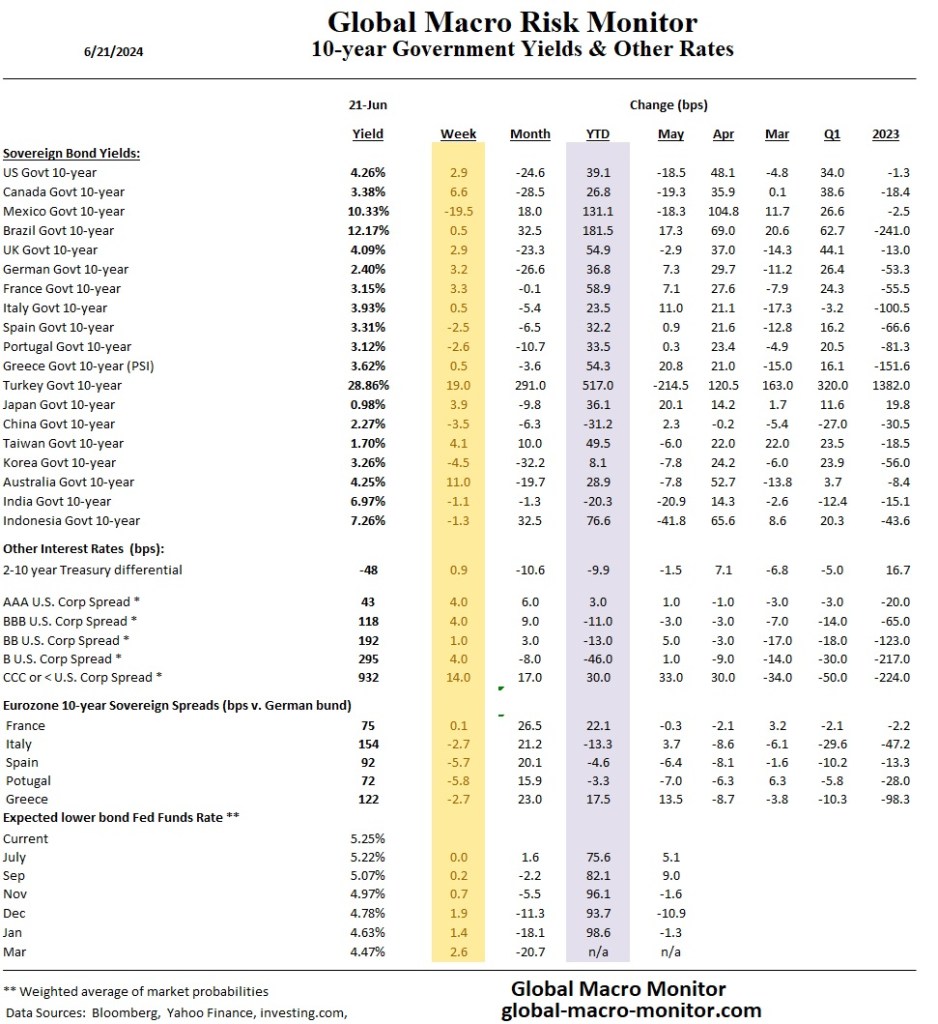
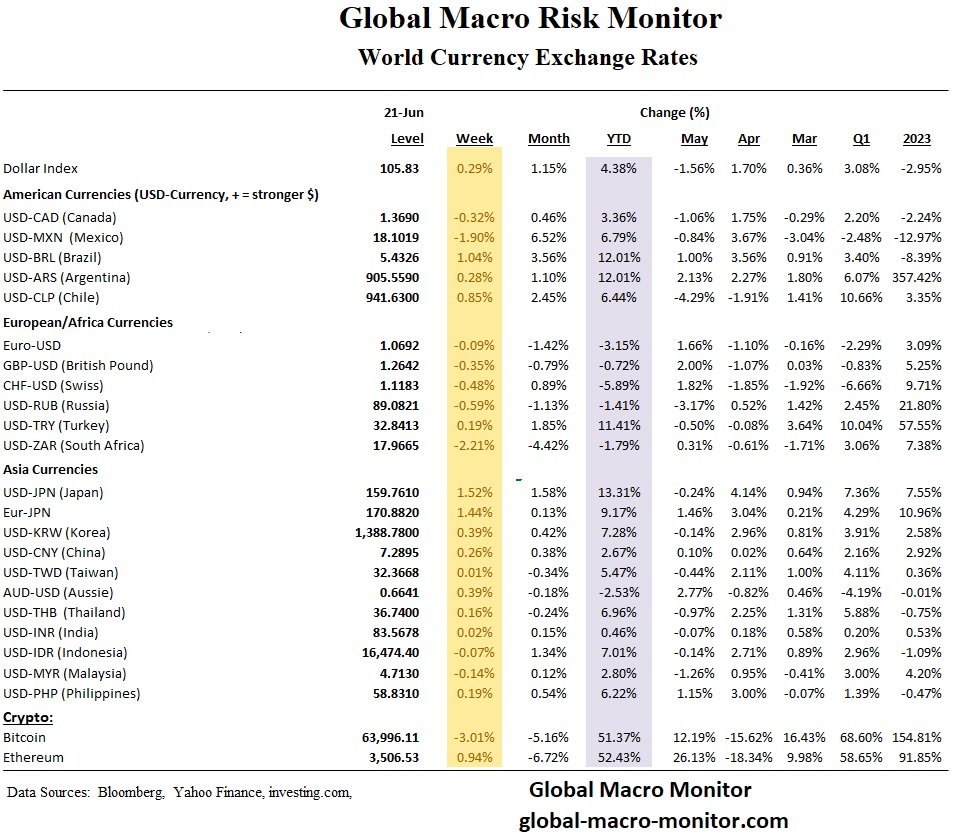
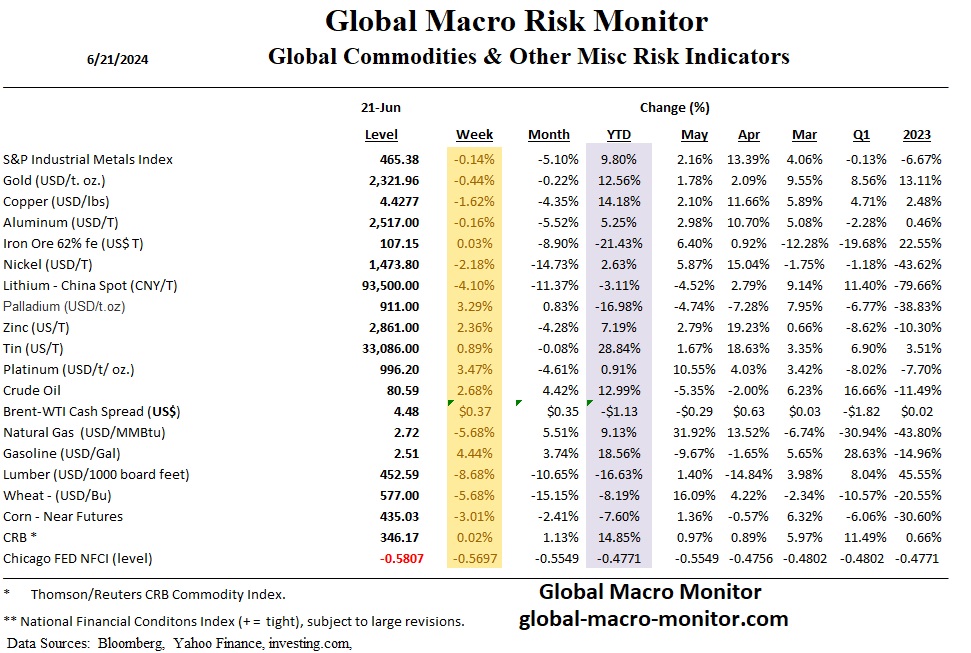
The global markets experienced mixed results for the week. Equity markets mostly rose, led by a rebound in European shares and Brazil, while bond yields exhibited slight increases. Currencies saw the dollar index strengthening slightly, with mixed movements among major currencies. Commodities showed varied performance, with notable gains in crude oil and platinum and losses in metals like nickel and zinc. Lumber was down 8.68 percent. Financial conditions continue to ease.
“Energy is the golden thread that connects economic growth, social equity, and environmental sustainability.” – Ban Ki-moon
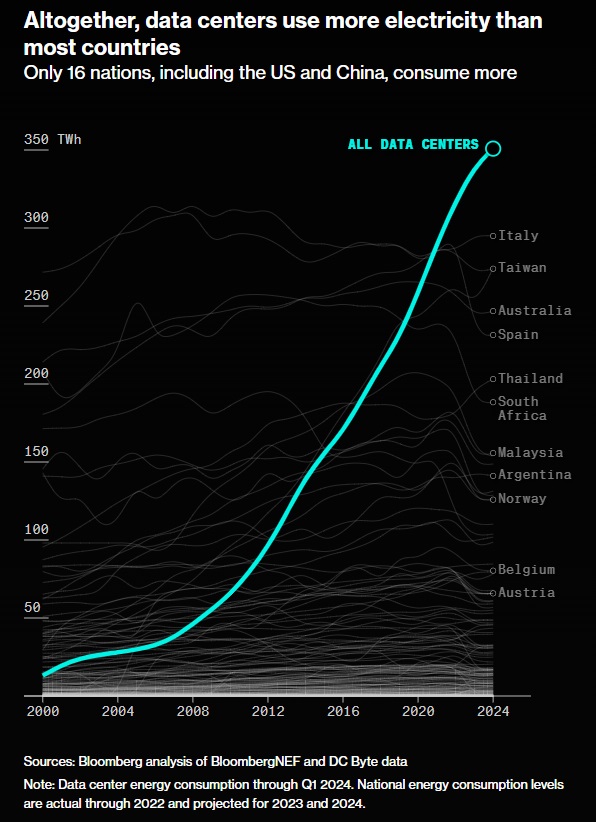
The rise of artificial intelligence is now turbocharging demand for bigger data centers……The almost overnight surge in electricity demand from data centers is now outstripping the available power supply in many parts of the world, according to interviews with data center operators, energy providers and tech executives. That dynamic is leading to years-long waits for businesses to access the grid as well as growing concerns of outages and price increases for those living in the densest data center markets….By one official estimate, Sweden could see power demand from data centers roughly double over the course of this decade — and then double again by 2040. In the UK, AI is expected to suck up 500% more energy over the next decade. And in the US, data centers are projected to use 8% of total power by 2030, up from 3% in 2022, according to Goldman Sachs, which described it as “the kind of electricity growth that hasn’t been seen in a generation.”
…Globally, there are more than 7,000 data centers built or in various stages of development, up from 3,600 in 2015…These data centers have the capacity to consume a combined 508 terawatt hours (THh) of electricity per year if they were to run constantly. That’s greater than the total annual electricity production for Italy or Australia. – Bloomberg
The average American home uses 30 kilowatt-hours (kWh) of electricity per day, totaling about 900 kWh per month and approximately 10,800 kWh per year. However, the power demand can increase significantly when multiple appliances are used simultaneously.
One terawatt-hour (TWh) of electricity can fully power 70,000 homes for a year, light over one million homes, or cool 500,000 homes for a year. A TWh is a unit of energy equal to one trillion watt-hours, or one billion kilowatt-hours. It is often used to measure large amounts of electricity or heat.
Watt  : A small unit of power. For instance, a small LED light bulb might use about 5 watts of power.
Kilowatt (kW): 1,000 watts. Household appliances are usually rated in kilowatts. For example, a typical microwave oven might use around 1 kW of power.
Megawatt (MW): 1,000 kilowatts or 1 million watts. Power plants are often rated in megawatts. A large wind turbine might have a capacity of around 2 to 3 MW.
Gigawatt (GW): 1,000 megawatts or 1 billion watts. Entire electrical grids or major power plants are sometimes rated in gigawatts. For example, the Hoover Dam has a capacity of about 2 GW.
Terawatt (TW): 1,000 gigawatts or 1 trillion watts. Terawatts are used to measure total energy consumption or production on a national or global scale. For instance, the total electricity consumption of the entire United States in 2021 was about 4 terawatt-hours (TWh) per day, which averages out to a continuous power consumption of about 167 TW.
Terawatt-hour (TWh): A unit of energy equal to one trillion watt-hours, or one billion kilowatt-hours. One TWh can power 70,000 homes fully for a year, light over one million homes, or cool 500,000 homes for a year.
A terawatt (TW) and a terawatt-hour (TWh) measure different aspects of energy. A terawatt is a unit of power, representing the rate at which energy is used or produced at a specific moment; for instance, a power plant operating at a capacity of 1 TW is producing one trillion watts of power continuously. On the other hand, a terawatt-hour is a unit of energy, representing the total amount of power consumed or produced over time; for example, if that power plant operates at 1 TW for one hour, it will generate 1 TWh of energy. In essence, terawatts measure power (instantaneous rate), while terawatt-hours measure energy (accumulated usage over time).