Overbought and Oversold Markets – January 25

The Relative Strength Index (RSI) is a momentum oscillator that measures the speed and change of price moves. The RSI moves between zero and 100 and is considered overbought with a reading above 70 and oversold when below 30.  Note the RSI can sustain an overbought (oversold) reading in a strong up (down) trend.

WIR_Overbought(click here if chart is not observable)

Posted in Overbought Markets | Tagged , , , , , , , | 3 Comments

Global Trend Indicators

WIR_Global TrendWIR_Equity_MA

(click here if tables are not observable)

Posted in Global Trend Indicators | Tagged , , , , , , | Leave a comment

Week in Review

WIR_Key LevelsWIR_Equity_WeekWIR_Bond_WeekWIR_Equity_YTDWIR_Bond_YTD

(click here if charts are not observable)

Posted in Week in Review | Tagged , , , , , , , | 2 Comments

Weekend Lecture: Google’s Eric Schmidt

Eric Schmidt, executive chairman of Google, is interviewed by Daniel Franklin, executive editor of The Economist and editor-in-chief of “The World In…” publication, at The Economist’s World in 2013 Gala dinner on December 6th 2012.

– EconomistMagazine

(click here if video is not observable)

Posted in Lectures, Technology | Tagged , , | Leave a comment

U.S. Equity Sector ETF Weekly Performance – January 25

ETF_WeekETF_YTDETF_Technicals(click here if charts and table are not observable)

Posted in Sector ETF Peformance | Tagged , , , | 1 Comment

Daily Interest Rate Monitor – January 25

Interest Rate Monitor

(click here if table is not observable)

Posted in Interest Rates | Tagged , , , , , , | Leave a comment

Weekly Eurozone Watch

Key Data Points
German 10-year Bund 8 bps higher;
France 9 bps wider to the Bund;
Belgium 11 bps wider;
Ireland 1 bp tighter;
Italy 4 bps tighter;
Spain 9 bps wider;
Portugal 1 bp wider;
Greece 72 bps tighter;
Large Eurozone banks weekly change, -2.0 to  6.0 percent;
Euro$ up  1.02 percent.

Comments
-Belgium’s sovereign spread widened 11 bps on the week and is now the only major Eurozone country wider on the year;
– EU’s  Olli Rehn said a Cyprus rescue would require a substantial reduction in government and bank debt;
– Portugal issued €2.5-billion of 5-year bonds at 4.891 percent putting the government on track to return to full market access. Demand was  €12-billion;
– The ECB said 278 banks would repay €137bn of the €489bn first tranche of 3-year funding they borrowed from the European Central Bank as part of the Long-Term Refinancing Operartions (LTRO);
– Flash Eurozone PMI Composite Output Index increased to 48.2 (47.2 in December). Though still contracting the PMI moved to a ten-month high;
– Angela Merkel reaffirmed that austerity must continue in order to increase the Eurozone’s international competitiveness.

French jobless claims stabilise at 15-year high

    ***************************************************

WEZ_Spread_WeekWEZ_Bank_WeekWEZ_Spread_YTDWEZ_Bank_YTDWEZ_YieldsWEZ_Stock IndicesWEZ_EuroFX(click here if charts are not observable)

Posted in Weekly Eurozone Watch | Tagged , , , , , , | 1 Comment

Federal Reserve Assets Top $3 Trillion

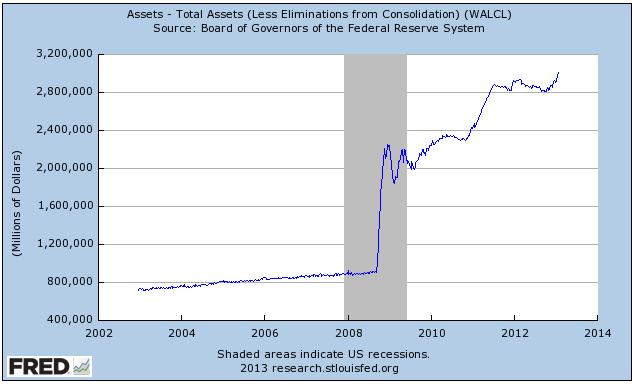
The Fed’s balance sheet just topped $3 trillion for the first time ever according to the Wall Street Journal,

The U.S. Federal Reserve‘s balance sheet topped $3 trillion for the first time as the central bank continued with its easy-money policy.

The Fed’s asset holdings in the week ended Jan. 23 increased to $3.013 trillion from $2.965 trillion a week earlier, the central bank said in a weekly report released Thursday.

The Fed’s holdings of U.S. Treasury securities rose to $1.697 trillion Wednesday from $1.689 trillion a week earlier. The central bank’s holdings of mortgage-backed securities rose to $983.17 billion, from $947.61 billion a week ago.

Jan24_Fed Balance Sheets

How much QE is leaking into the economy?

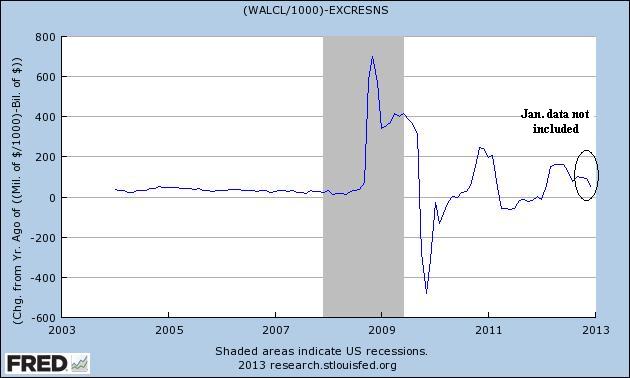
We have posted several pieces (see here and here) on how the expansion of the Fed’s balance sheet is financed by reserve creation, which are held by depository institutions in the form of excess reserves and not circulating in the economy.   In the chart below we try and get a sense of how much of the quantitative easing has leaked out of the banking system into the economy.

The monthly data in the chart below is the year on year change ($ billions) of total Federal Reserve assets less excess reserves of depository institutions.   Because the last observation of excess reserve data is from December the chart doesn’t capture the latest effects of quantitative easing.

Though the calculation is a bit noisy, the chart does illustrate why the massive expansion of the central bank’s balance sheet has yet to translate into a significant increase in inflation.  When credit begins to expand as the economy picks up the Fed will have to execute what George Soros calls the “delicate two-phase maneuver” and remove the excess liquidity from the financial system.

Jan24_Liquitidity Into the System

(click here if charts are not observable)

Posted in Monetary Policy | Tagged , , , | 4 Comments

Spain’s Unemployment Rate Increases to 26%

(click here if video is not observable)

Posted in Employment, Spain | Tagged , | 1 Comment

Daily Interest Rate Monitor – January 24

Interest Rate Monitor

(click here if table is not observable)

Posted in Interest Rates | Tagged , , , , , | Leave a comment