Spain’s fight to save regions

(click here if video is not observable)

Posted in Black Swan Watch, Euro, PIIGS, Spain | Tagged , , | Leave a comment

New Greek Prime Minister Pleads For National Unity

(click here if video is not observable)

Posted in Black Swan Watch, Euro, Eurozone Sovereign Spreads, PIIGS, Sovereign Debt, Sovereign Risk | Tagged , , | Leave a comment

Squirrelly Summer Market

Squirrelly trading after the FOMC announcement.   Looks like real money is on vacation and traders just flipping with each other.   No big sellers and shorts forced to cover

Headlines out of Europe show a little more flexibility from Germany on sovereign bond buying, but no doubt will come with strings attached — i.e,  structural reform and fiscal consolidation.   Probably enough though to keep the market bid until the EU summit.

(click here if chart is not observable)

Posted in Black Swan Watch, Equities, Euro | Tagged , , | Leave a comment

More Pain in Spain

Though yields dropped about 20 bps today,  the pain continues.   Big move in the German 10-year bund since June 1st –  1.17 to 1.51 percent!

(click here if video is not observable)

Posted in Black Swan Watch, Euro, German Bund, PIIGS, Sovereign Debt, Sovereign Risk | Tagged , , | Leave a comment

Relative Unemployment Rates – State vs National

More interesting data from the BLS,

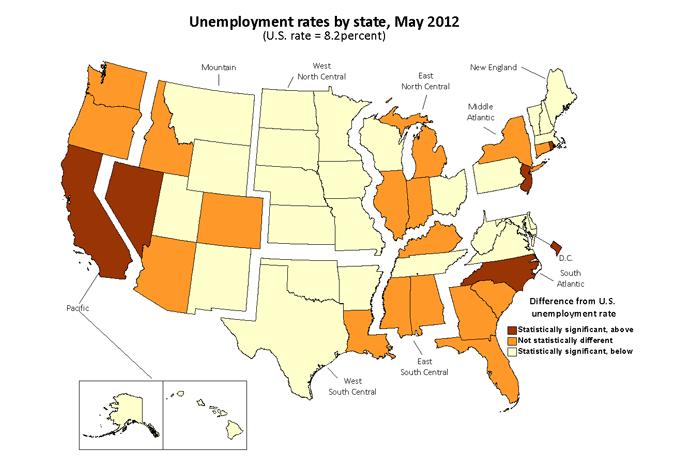
In May 2012, 27 states had unemployment rates that were significantly lower than the U.S. rate of 8.2 percent, while five states and the District of Columbia recorded rates significantly above it. The remaining 18 states had unemployment rates that were not statistically different from the U.S. rate.

Nevada continued to record the highest unemployment rate among the states, 11.6 percent in May. Rhode Island and California posted the next highest rates, 11.0 and 10.8 percent, respectively. North Dakota again registered the lowest jobless rate, 3.0 percent, followed by Nebraska, 3.9 percent.

No state experienced a statistically significant unemployment rate change over the month. However, 28 states reported statistically significant rate changes from a year earlier, all of which were decreases. The largest of these occurred in Michigan and Nevada (−2.1 percentage points each) and Florida and Mississippi (−2.0 points each).

(click here if chart is not observable)

Posted in Employment | Tagged , | Leave a comment

Charlie Rose: James Fallows on China’s Economy

Interesting interview with the Atlantic correspondent, James Fallows, on China’s economic future.  He views China in the framework of his new book,  China Airborne, and talks about how the country is trying to transform itself by supporting certain industries.    An insightful perspective on China’s industrial policy.

Click here for interview.

(click here if picture is not observable)

Posted in China | Tagged , , , | 1 Comment

U.S. Economic Releases – June 19

Econoday reports,

Housing on “slow mend” despite -4.8% headline number

No one number explains the housing starts report today. The headline was down but there were upward revisions and permits were up in May. And starts weakness was in the volatile multifamily component. Housing starts declined in May by 4.8 percent after rebounding 5.4 percent in April. The May pace of 0.708 million units fell short of market expectations for 0.720 million and is up 28.5 percent on a year-ago basis. April was revised up to 0.744 million from 0.717 million. For the latest month the single-family component gained 3.2 percent after a 4.0 percent rise in April. The multifamily component-which is volatile-fell 21.3 percent, following an 8.4 percent boost in April.

By region, the fall in starts reflected a 20.3 percent decrease in the Northeast with the Midwest declining 13.3 percent and the South falling 6.1 percent. The West rose 2.6 percent.

Housing permits showed notable improvement in May, suggesting growth in construction in coming months. Permits rebounded 7.9 percent, following a decline of 6.0 percent in April. The May rate of 0.780 million units posted higher than analysts’ estimate of 0.736 million units. Both single-family and multifamily components rose in May.

Despite the dip in the May headline number for starts, housing appears to be muddling upward but hardly at a robust pace. But until demand is notably stronger, modest growth in construction is good so as to prevent unwanted inventory.

There was little reaction in equity futures on release. However, today’s report could have some impact on the Fed’s decision tomorrow. The economy has been described by many as sluggish but taking into account all of the details today, housing may be considered to be on a slow mend and could help limit the size of any Fed action. For policy discussion, permits may stand out more than starts.

ICSC-Goldman Store Sales remains “soft”

Growth in chain-store sales remains soft, according to ICSC-Goldman’s same-store sales index which is unchanged in the June 16 week. The year-on-year rate of plus 3.6 percent is the highest since mid-May but the four-week average is unchanged at 3.1 percent which is a 3-month low. The report blames economic uncertainty both here and also globally for the softness. But it also notes that moderating gas prices should, in the coming weeks, begin to boost discretionary spending. Redbook, whose rates have been slightly below those of ICSC-Goldman, will be posted later this morning at 8:55 a.m. ET.

Redbook same store sales “soft,” up 0.4% on week

Sales at chain stores improved in the June 16 week but not as much as expected by Redbook whose same-store index shows a plus 2.4 percent rate, very soft but up 4 tenths from the prior week. The report notes activity tied in the week to Father’s Day and that warmer weather across much of the country helped move seasonal goods. June is still in progress and there’s hope that sales will pick up, reflected in Redbook’s monthly forecast which, at plus 0.5 percent, still calls for a sizable gain.

(click here if chart and tables are not available)

Posted in Economics, US Releases | Tagged , , | Leave a comment

Where The Inflating Things Are

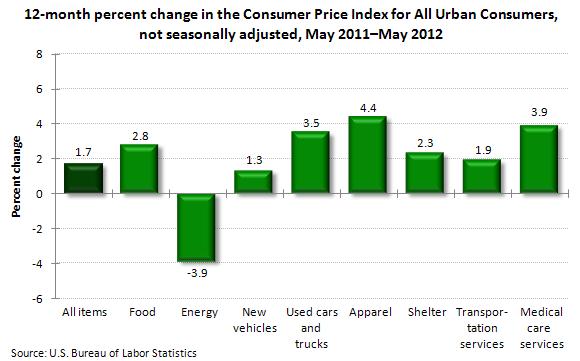
On the eve of the Fed’s FOMC two-day meeting we thought this chart illustrating what is inflating in the U.S. consumer basket very relevant.   Don’t see much deflation x/ energy and the core CPI (x/ food and energy) remains stuck at 0.2 percent month-on-month.

Here’s the BLS commentary,

Over the last 12 months, the Consumer Price Index for All Urban Consumers (CPI-U) increased 1.7 percent before seasonal adjustment.

The rate of increase in the all items index has slowed steadily since its recent peak of 3.9 percent in September 2011, driven mostly by the energy index, which decreased 3.9 percent from May 2011 to May 2012. May marked the first 12-month decline in the energy index since October 2009.

The 12-month increase in the food index, which was 4.7 percent as recently as December, was 2.8 percent in May. The 12-month change in the index for all items less food and energy was an increase of 2.3 percent in May, the same figure as in April and March. The shelter component also rose 2.3 percent over the past 12 months.

Indexes rising at a slower rate than the index for all items less food and energy include household furnishings and operations (0.6 percent), recreation (0.9 percent), and new vehicles (1.3 percent). Indexes rising more rapidly include apparel (4.4 percent), medical care services (3.9 percent), and used cars and trucks (3.5 percent).

(click here if charts are not observable)

Posted in Economics, Inflation/Deflation | Tagged , , , | Leave a comment

G20 Puts Squeeze on EU Policymakers

(click here if video is not observable)

Posted in Black Swan Watch, Euro, Eurozone Sovereign Spreads, Italian Yields | Tagged , , , | Leave a comment

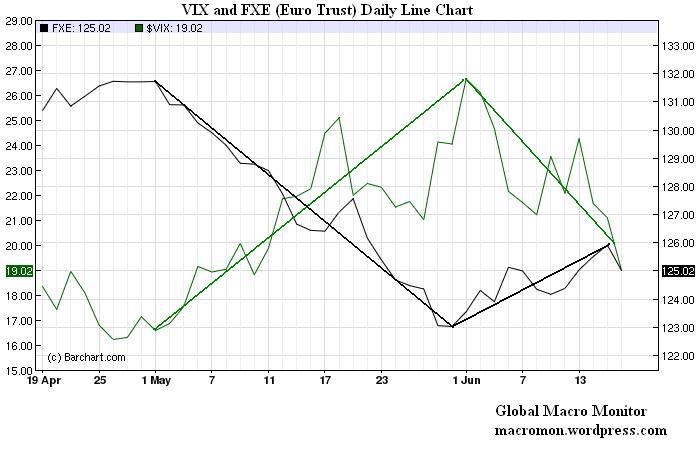
VIX and Euro Divergence

Lot’s of interesting divergences today.

Check out the VIX and Euro both moving down today, which diverges from recent history.   The VIX is down over 11 percent today, which could be position squaring before options expiration.  We suspect that many got long volatility around the Greek elections.

Nevertheless,  interesting action in the U.S. equity market.   Apple, our proxy for hedge fund risk appetite is soaring, and with the VIX flopping,  makes us think a blast to the upside in the S&P could be in the works.    Could be wrong and always with a stop.

(click here if charts are not observable)

Posted in Apple, Equities, Euro | Tagged , , | Leave a comment