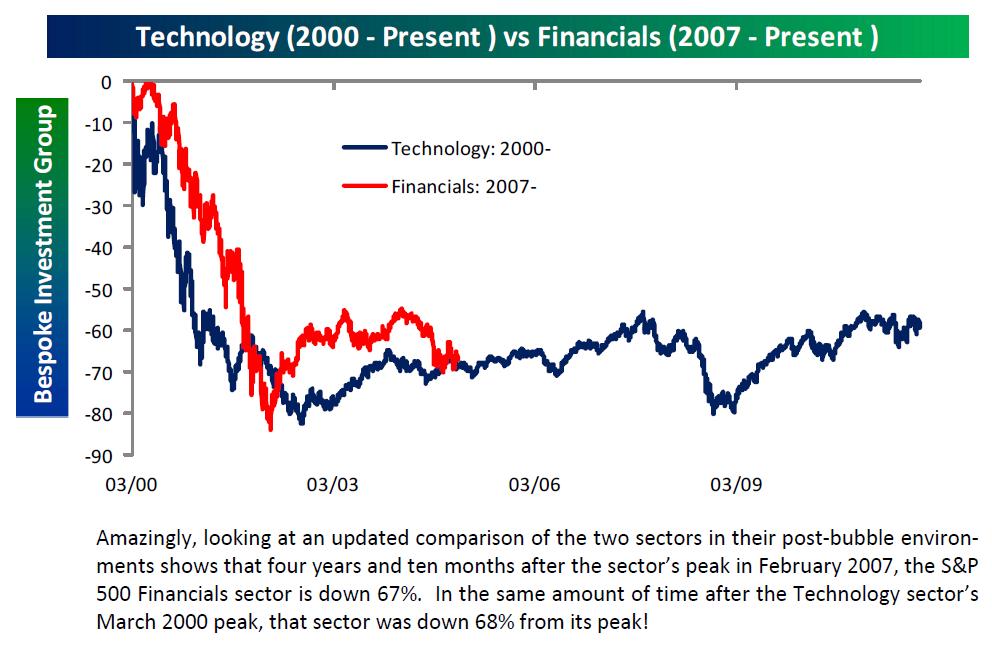
Post-Bubble Performance Comps of U.S. Financials and Techs

The guys over at Bespoke put out a great piece today comparing the post-bubble performance of U.S. financials after the February 2007 top and the technology sector after the dot.com peak in March 2000.    They are tracking within one percent, down 67 and 68 percent, respectively, 58 months after their peaks.

Bespoke provides interesting and unique insight into the data and markets and are one of the few research services we subscribe to.    Here’s the chart and snapshot of today’s piece.

(click here if chart is not observable)

Posted in Equities | Tagged , , | 3 Comments

Now for Some Good News…

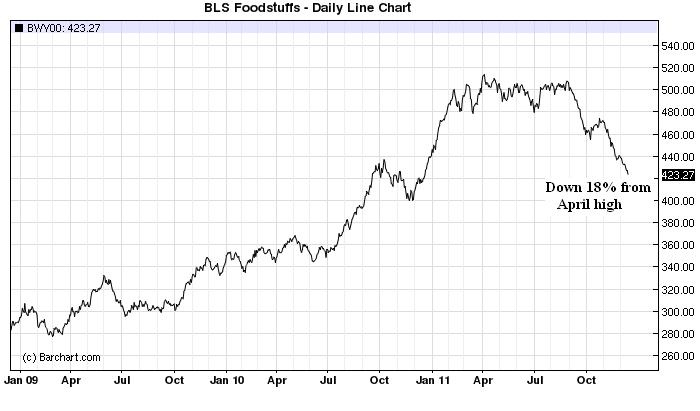
Here’s a little piece of good macro news.  The CRB Foodstuffs sub-index — hogs, steers, lard, butter, soybean oil, cocoa, corn, Kansas City wheat, Minneapolis wheat, and sugar — is down 18 percent from its April high.  Good news for consumers, not so if you’re long,  a farmer,  or a speculator in farmland.

(click here if chart is not observable)

Posted in Commodities | Tagged , , | 2 Comments

HSBC China Flash PMI Contracts At Slower Rate

(click here if chart is not observable)

Posted in China | Tagged , | Leave a comment

Gold and Commodities Slammed

Gold and other commodities got hammered.  It hasn’t been two weeks since we thought gold could move to new highs on the back of the announcement of coordinated global central bank support for Europe, which we believed would be followed by the unleashing of the big liquidity bazooka at the EU Summit.

We were so wrong and now it appears the markets believe a full blown liquidity/credit contraction is on the way and are fleeing risk assets.   Money is flying out of the emerging markets and as their central banks try and ease the currency pressure they sell their international reserves, which is a big factor in the directional move of gold, in our opinion.

Furthermore, unsterilized currency intervention is a monetary contraction,  just the opposite problem of earlier in the year.  How the currency wars have reversed.

Today’s move puts gold below its 200-day for the first time since early 2009.  That makes 1534.74 the next must hold level of support, which is the three year trend line and September low.  We’re in no rush to buy anything here.

The macro swans are back in a big way and 2012 is looking pretty gloomy unless, of course,  the EU policymakers can somehow reign in their debt crisis and China embarks on another massive stimulus.   That hopium, however, has made trading an expensive December.

We have a short bias, in full preservation of capital mode, and basically done for the year.

(click here if charts are not observable)

Posted in Black Swan Watch, Commodities, Gold | Tagged , , | Leave a comment

I Wish I Was In Dixie

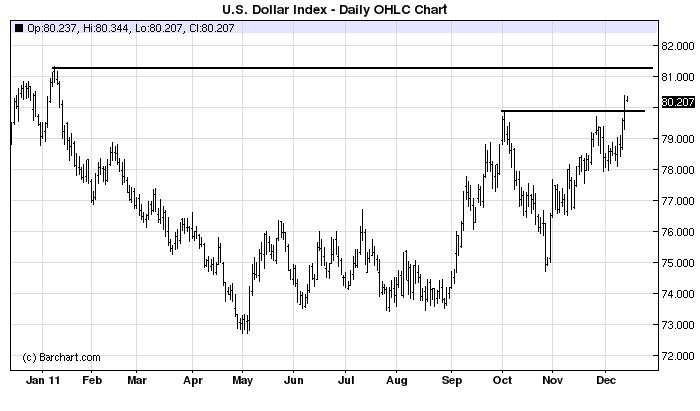
The Dollar Index,  the “Dixie,” is breaking out and looks like it will slice through the next resistance level “like a hot knife through butter.”   For those interested,  click here for the song Dixie and here for its historic significance.

(click here if chart is not observable)

Posted in Dollar | Tagged | 2 Comments

China’s Deflating and ‘Eerily Similar’ Housing Bubble

Wow!  Check out this.

In January we compared the U.S. and China stimulus,

In the U.S., the central bank printed and created money through the expansion of its balance sheet.  In China, the government pressured the  banks to create money through expanding and directing credit to specific sectors.

The chart illustrates as nominal GDP growth was collapsing in 2009, the broad money supply in China was growing close to 30 percent by the end of 2009.    This helped the Shanghai Composite recover a bit, but inflated other bubbles, including and mainly in the real estate markets.   We hear rumors of,  and see pictures of empty Chinese shopping malls and cities pinging around the internet, which is the result of the easy and nonmarket credit included in the latest round of China’s monetary expansion.

Doesn’t this sound a little familiar?  First a stock bubble, then a monetary driven real estate and construction bubble to stimulate  growth?

Now listen to David Pierson of the Los Angeles Times reporting from Beijing,

Home prices nationwide declined in November for the third straight month, according to an index of values in 100 major cities compiled by the China Index Academy, an independent real estate firm. Average prices in the Shanghai area are down about 40% from their peak in mid-2009, to about $176,000 for a 1,000-square-foot home.

Sales have plummeted. In Beijing, nearly two years’ worth of inventory is clogging the market, and more than 1,000 real estate agencies have closed this year. Developers who once pre-sold housing projects within hours are growing desperate. A real estate company in the eastern city of Wenzhou is offering to throw in a new BMW with a home purchase.

The swift turnaround has stunned buyers such as Shanghai resident Mark Li, who thought prices had nowhere to go but up. The software engineer closed on a $250,000, three-bedroom apartment in August, only to watch weeks later as the developer slashed prices 25% on identical units to attract buyers in a slowing market.

Outraged, Li and hundreds of others who paid full price trashed the sales office, scuffled with employees and protested for three days before police broke up the demonstration. Walking away now would mean losing the $75,000 down payment that he borrowed from his working-class parents.

“I still haven’t told them,” Li, 29, said of his home’s plummeting value. “It will just make them worry, and it’s already too late.”

It’s all eerily similar to the early stages of the U.S. housing crash. The big difference is that the Chinese government intentionally slammed on the brakes.

Stunningly familiar.  It now looks like China was a few years and one bubble behind the United States.

The problem is that this sort of credit driven/fake wealth consumption led demand has created so much leverage and excess capacity in certain sectors it’s going to take time to work off.   Policymakers can try and cushion the blow with more fake or replacement demand through expansionary fiscal policy, but even they are running out of cushion as markets revolt against large budget deficits.

Not enough demand and too much capacity.

Posted in Black Swan Watch, China, Commodities, Credit, Sovereign Debt, Sovereign Risk | Tagged | 2 Comments

China’s Faces Manufacturing Downturn

China’s manufacturing sector slowing down affecting thousands of factories already on the brink.   Export growth will slow to a two-year low of just 11 percent in November, well off the year’s peak of 38 percent.   Exports to the European Union, China’s biggest market, fell 18 percent in October.   Click here to view video.

                                           (click here if picture is not observable)

Posted in China, Sovereign Debt, Sovereign Risk | Tagged , , , | Leave a comment

Flight to Quality Funding of the U.S. Budget Deficit

As we suspected in our last update in September, the flight to quality funding of the U.S. budget deficit would replace the end of QE2 and almost 100 percent indirect financing of the deficit by the Federal Reserve.  Looking at the chart one can only imagine where interest rates would be if the deterioration of Europe hadn’t coincided with the end of QE2.

As they continue to fiddle in Washington and fail to address the long-term fiscal issues we know that trade is coming and is just a matter of when, not if.   Sovereign risk is all about confidence and it appears all roads lead to deflation in 2012,  so U.S. Treasuries are the chic place where the beautiful people currently hang.  Kind of like Rome, Madrid, and Paris used to be for European models banks.

Click charts to enlarge and here if charts are not observable)

Posted in Black Swan Watch, Bonds, Budget Deficit, Fiscal Policy | Tagged , | 1 Comment

BBC: Top economists reveal their graphs of 2011

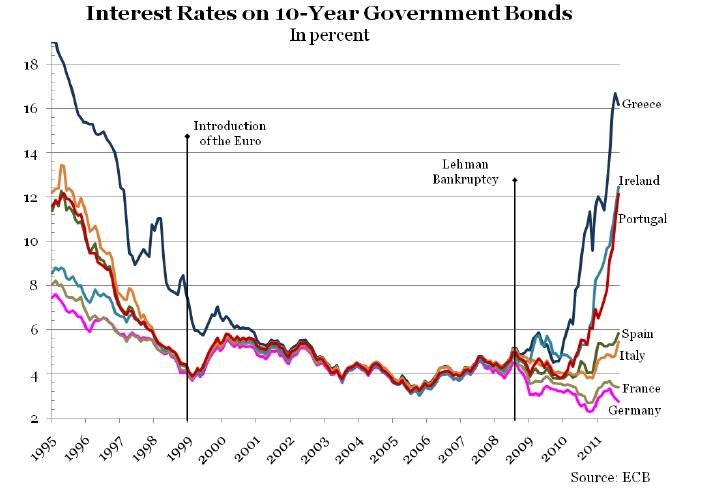
The BBC contacted us earlier in the week about our September post, La Grande Divergence, which included the following chart.   Vicky Pryce, the influential U.K. economist, liked enough to choose it as her favorite of the year.  BBC journalists will review the charts on tonight’s Newsnight show.

All credit to Desmond Lachman at the AEI.   Check out the BBC’s collection of top charts here, which includes Ken Rogoff’s fave of a long times series, back to the 19th century, of global debt, inflation, and defaults.

“For a long time the perception was that the creation of the euro meant sovereign risk was effectively the same across all countries. That of course proved to be wrong. The Lehman’s crisis and financial meltdown that followed affected the deficits and debt levels of different countries in different ways. Interestingly it is much the same countries now with very high yields as it was pre-euro, suggesting little has changed fundamentally in a decade.” VICKY PRYCE, SENIOR MANAGING DIRECTOR FTI CONSULTING

(click here if chart is not observable)
Posted in Black Swan Watch, Euro, Sovereign Risk, State and Local Government | Tagged , , , | 2 Comments

Charle Rose: Robert Rubin on the European Debt Crisis

Good interview with Gillian Tett of the Financial Times and Robert Rubin, former United States Secretary of the Treasury on the European Debt Crisis.  Rubin does make a good point 19:45 minutes into the discussion about Mario Draghi’s debt monetization dilemma,

“If he floods the markets with Euros…and loses his credibility on inflation, you could see holders of Euro denominated securities dump them, which would undermine exactly what you’re trying to accomplish….”

In other words, domestic money demand collapses.   It’s a great discussion and well worth your time.    Click here for interview.

(click here if picture is not observable)

Posted in Black Swan Watch, Euro, Sovereign Debt, Sovereign Risk | Tagged , , , | 1 Comment