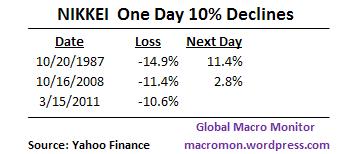
NIKKEI One Day 10% Declines

(click here if charts are not observable)
Posted in Black Swan Watch, Equities, Japan | Tagged , | Leave a comment

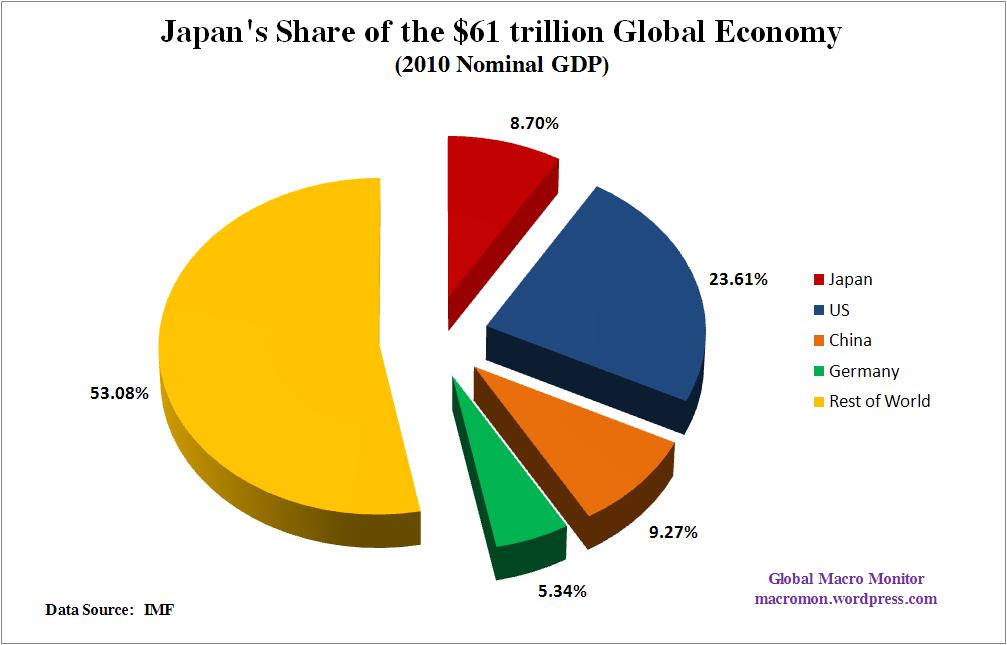
Chart of the Day: Japan’s Share of the Global Economy

(click here if chart is not observable)

Posted in Economics, Japan | Tagged , , , , , | 2 Comments

France’s Nuclear Dependence

This is quite a revealing chart of France’s dependence on nuclear energy for electricity generation.   Especially compared to the Japan and U.S. charts we posted yesterday.

(click here if chart is not observable)

Posted in Energy | Tagged , , | Leave a comment

Japan’s International Investment Position

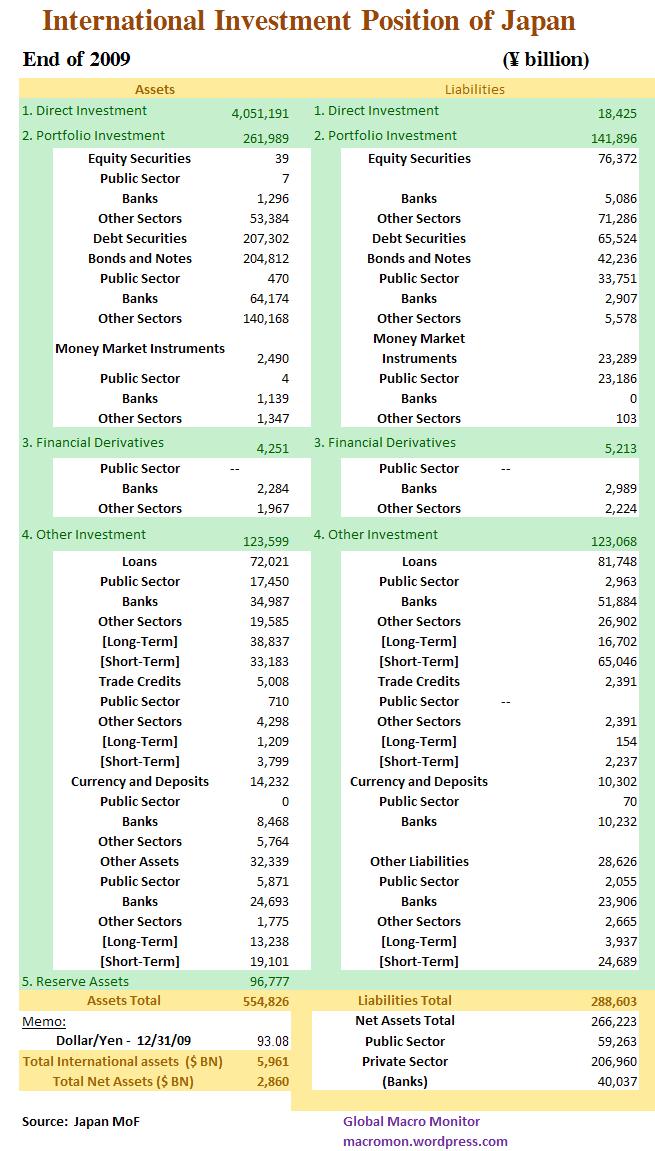
The following table is a detailed analysis of Japan’s international investment position from the Ministry of Finance.   Using the latest data is from 2009 and the year-end exchange rate the country held $5.96 trillion of international assets with a net position of  $2.8 trillion.   In a sharp contrast with its public sector finances,  Japan has the strongest net international investment position of any country.

This also compares to the negative U.S. net international investment position of $2.7 trillion at year-end 2009 and a major reason why a U.S.  Japanese-type deflation scenario is totally flawed, in our opinion.   It’s highly unlikely the Dollar will experience an 80 percent secular appreciation in the aftermath of the bursting of the U.S. real estate bubble as the Yen has, in our opinion.

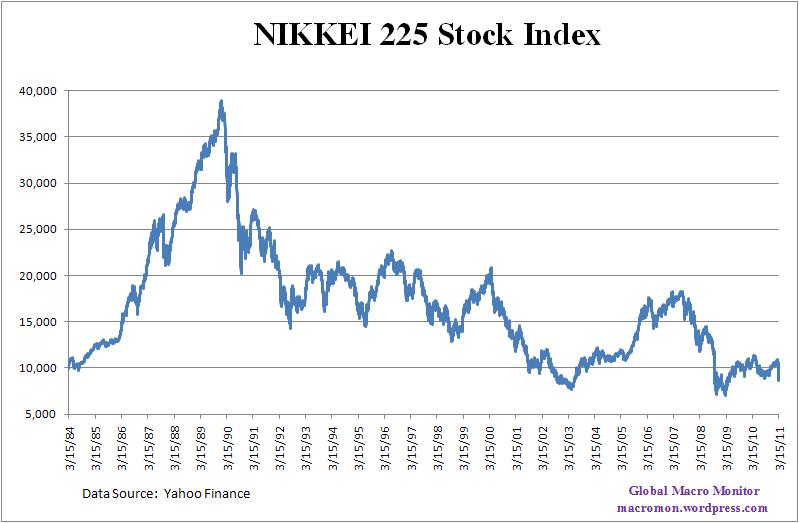
On December 31, 1989, the peak of the Japanese real estate and stock bubble, the Yen closed at 143.80 and is now at 82.   This has hurt the export-oriented  economy and one reason why the NIKKEI is still down over 70 percent from its December 1989 peak.

Japan’s strong international investment position is why some believe the country could sell and repatriate some of the assets to finance reconstruction, which would put upward pressure on the Yen.  It appears the policymakers have drawn a line in the sand at the 80 level,  however, and will do whatever it takes to protect their exporters.

(click here if chart is not observable)

Posted in Bonds, Equities, Japan | Tagged , , | 3 Comments

How Dependent is Japan on Nuclear Energy?

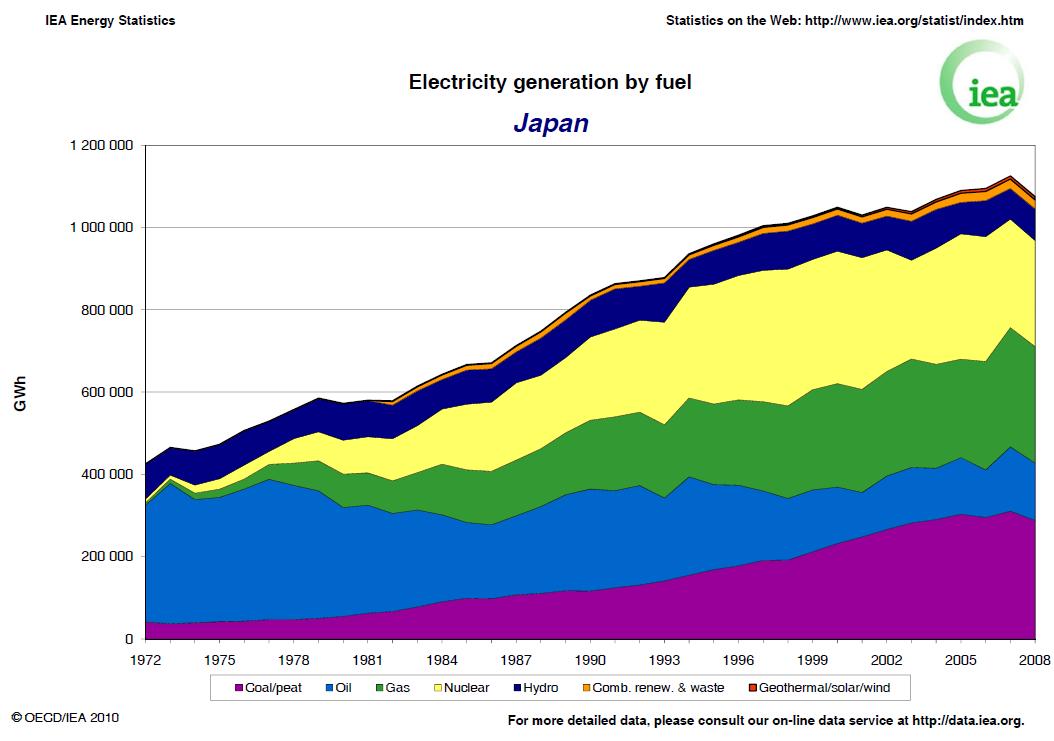
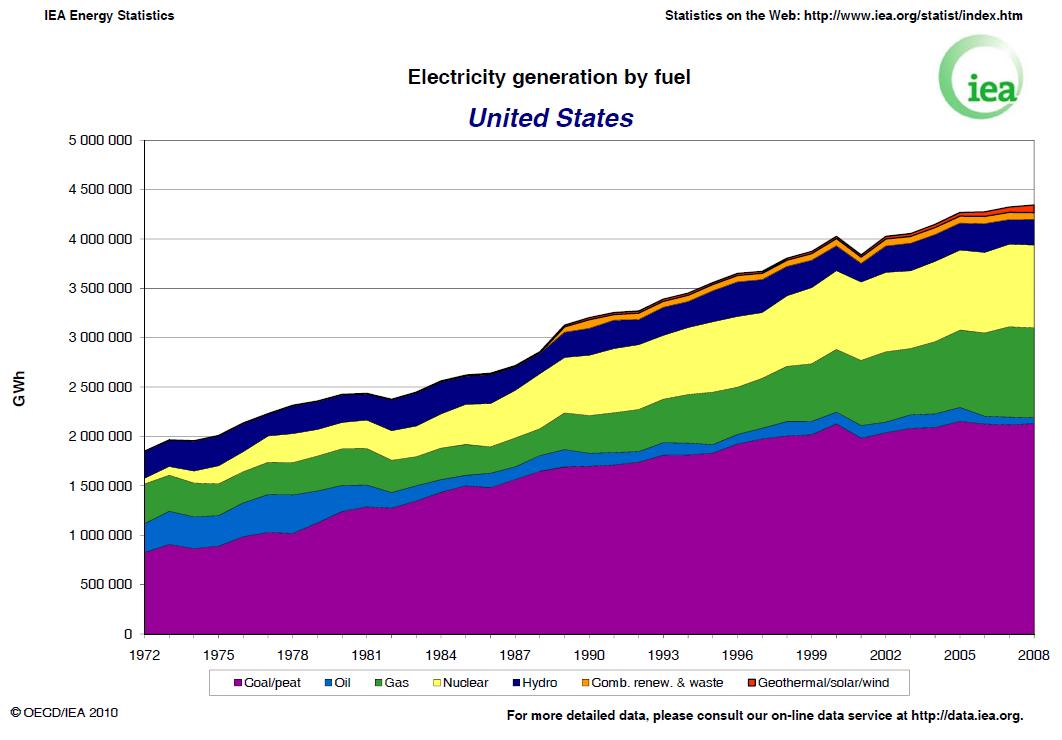
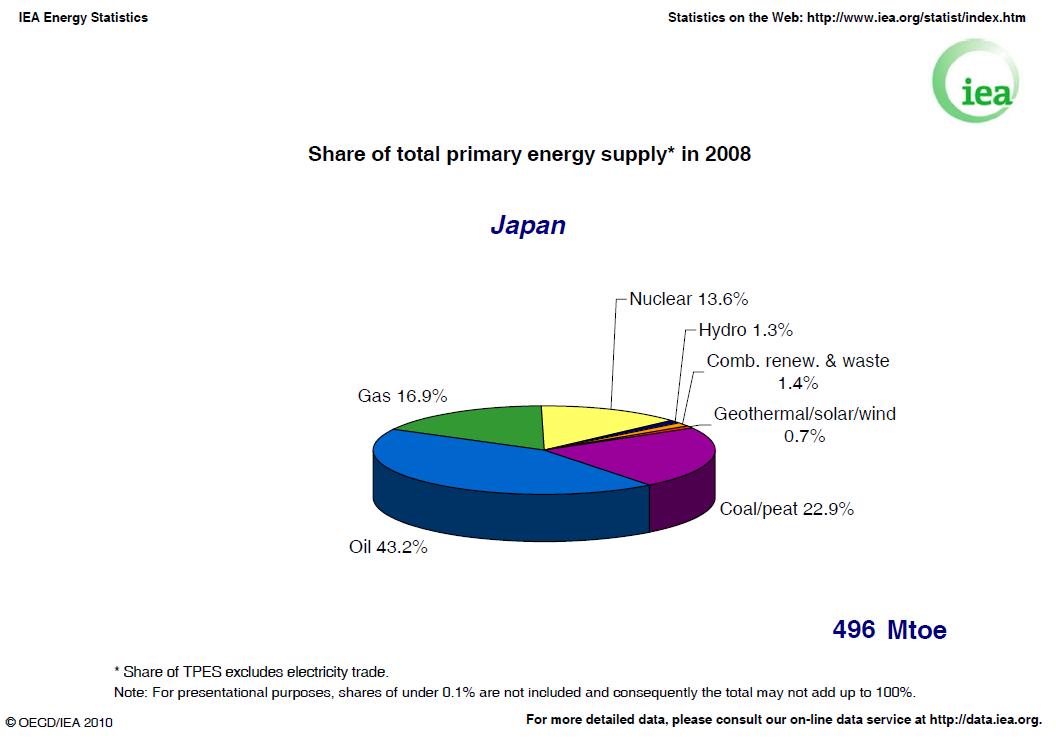
The following charts show nuclear makes up 13.6 percent of Japan total energy supply and a large portion of the the country’s electricity production.  Note how it has replaced oil as major source of electricity since the early 1970’s.  We have included a similar U.S. chart as a point reference. (click here if charts are not observable)

Posted in Charts, Crude Oil, Energy, Japan | Tagged , , | 3 Comments

Week in Review

We don’t have much to say in a week that ended with the terrible tragedy in Japan.   Every major equity market we track was down with the Nikkei not surprisingly performing the worst and will no doubt open down big Monday morning.  The European indices broke their 50-day moving averages and the Dow and S&P500 are the only two we track still above their 50-days after their impressive ability to rally into Friday’s close.

Commodities got clocked on growing fears of a China not-so-soft landing and the Saudi “day of rage” that never happened.  The Aggies collapsed and wheat was down an astounding 15 percent.  Crude fell over 3 percent and copper was off 6 percent, which is now down for the year.  Who was that institution which reportedly owns 50 percent of the world’s copper stock?

We charted the performance of the Nikkei and $/Yen after the 1995 Kobe Earthquake, which killed over 6,000 people.  Japanese stocks fell 25 percent and didn’t bottom until 5 months after the January 17 quake.  The Yen strengthened 18 percent and only reversed after the dollar’s famous “Rubin bottom” in April.

As the market obsesses on Japan’s high level of public debt, don’t forget Japan has the best international investment position of any country in the world.  Japan holds over $3 trillion of net assets abroad, some of which will surely be repatriated to finance the cost of rebuilding and could cause the Yen to strengthen even further.

Apple is the key stock to watch here, in our opinion.  It bounced nicely off its 50-day on Thursday and finished strong into Friday’s close.  If Apple stays strong, it may limit the downside to the overall U.S. market.   We will become more aggressive sellers if the S&P500 breaks the 1294-1300 range, however.

Nevertheless, this is no time to be a hero and the small correction has not made the buy case compelling just yet.  We do respect the market and are impressed that the S&P500 is only 3 percent off its high given what is going on in the world.  Stay tuned and please make an effort to do whatever is in your power to help out our Japanese friends in their time of need. (click here if charts are not observable)
Posted in Week in Review | Tagged , , , , , | Leave a comment

Chart Update: Kobe Earthquake Impact on NIKKEI and Yen

We’ve made a slight adjustment and updated our chart of the NIKKEI and $/Yen trajectory after the 1995 Kobe Earthquake.   A slight scale adjustment to the currency axis makes the Yen move much clearer.   It also shows how tight the NIKKEI and Yen move together.  Click on the chart for larger and even better resolution.

(click here if chart is not observable)

Posted in Black Swan Watch, Currency, Japan | Tagged , , | 2 Comments

The Weekend Read: Godspeed, Japan!

As cars swayed, and trees lurched overhead, you could feel the power of the beast writhing underneath Japan.  – Economist

China
Demographic Trends Cloud China’s Long-Term Economic Outlook – AEI
Don’t Dismiss a Jasmine Moment in China – The Atlantic

Commodities
Goldman warns of ‘downside risk’ to crop prices – agrimoney
New Push to Recycle Rare Earth Minerals – Reuters

Credit
Move to ‘Synthetic’ US Junk Bonds – FT

Economics
Icahn warns another downturn may lie ahead – FT
Macro and Growth Policies in the Wake of the Crisis – IMF
The Burden of Pensions on States – NY Times

Emerging Markets
Generations in India pay off debts through slavery – CNN

Flows
Pimco cuts US Treasuries holdings to zero – FT
Sovereign wealth fund assets rise to $4,000bn – FT

Europe
Europe: Northern exposure – FT
How the euro-zone outs are fighting to retain influence in the European Union – Economist
The Euro’s Debatable Future – WSJ

Geopolitical
Arab League prepares to back no-fly zone – FT
Democracy’s hard spring – Economist
Why Middle East Monarchies Might Hold On – The Atlantic

Japan
Did ‘Supermoon’ Have Anything to Do With Quake? – CNBC
Earthquake Will Increase Japan’s Debt Burden: Rating Exec – CNBC
Japan trying to prevent meltdown at nuclear plant in Fukushima – LAT
The Myth of Japan’s ‘Lost Decades’ – The Atlantic

(click here if video and chart are not observable)

Posted in The Weekend Read, Uncategorized | Tagged , , , | Leave a comment

U.S. Macro in Two Simple Charts

To understand the U.S. economy go no further than the following two charts.  In 2009 and 2010, public sector borrowing was more than 100 percent of total net domestic credit flows.  Federal government borrowing was 93 percent of these flows.   The chart also shows the incredible collapse of U.S. credit bubble.

Private sector deleveraging peaked in Q1 2010 and net consumer credit in Q4 was positive for the first time since Q2 2008.  Net mortgage flows remain negative and corporate credit flows are picking up stream.

The first chart illustrates why the U.S. money supply has not exploded even though the Federal Reserve has almost tripled the monetary base.  The second chart shows why inflation concerns are increasing, however, as domestic credit markets heal and are primed with a massive arsenal high powered money.

(click here if charts are not observable)
Posted in Credit, Economics, Fiscal Policy, Monetary Policy, Policy, Sovereign Debt, State and Local Government | 4 Comments

Kobe Earthquake’s Impact on the Nikkei and $/Yen

First, our thoughts and prayers are with the Japanese.   They are a great nation and a good people.  Watching this happen unfold in  real time is stunning and we are hoping for a miracle that the loss of life is limited.  We were living in and lost a house in a powerful L.A. quake and understand the fear when the earth shakes.

Though it is too early to assess the full damage of this quake, the following chart illustrates how the January 17, 1995 Kobe Earthquake, which measured 7.3 and killed 6,434 people, impacted the Nikkei and $/Yen.   The Nikkei fell 24.6 percent before bottoming at the end of June.

The Yen actually strengthened 18 percent before the dollar hit the famous “Rubin bottom” in April 1995.   The dollar was already in downtrend and further weakened by the U.S. bailout of the Mexico when the Kobe quake hit, so it is difficult to fully extract its true impact on the exchange rate.  (click here if chart is not observable)

Posted in Currency, Dollar, Japan | Tagged , , , | 9 Comments