Does Anne Hathaway Drive Berkshire Stock?

We posted last October our suspicions that algo/robo traders were driving the almost tick-for-tick correlation between the Australian dollar and the S&P500.  Remember those days of great fun?

Now, the Atlantic suspects that algorithms may, and we stress may,  have been written and programmed to buy Berkshire Hathaway (BRK-A) stock when Anne Hathaway is mentioned in the news!   Alexis Madrigal of The Atlantic writes,

A couple weeks ago, Huffington Post blogger Dan Mervish noted a funny trend: when Anne Hathaway was in the news, Warren Buffett’s Berkshire Hathaway’s shares went up. He pointed to six dates going back to 2008 to show the correlation. Mervish then suggested a mechanism to explain the trend: “automated, robotic trading programming are picking up the same chatter on the Internet about ‘Hathaway’ as the IMDb’s StarMeter, and they’re applying it to the stock market.”

The idea seems ridiculous. But the more I thought about the strange behavior of algorithmic trading systems and the news that Twitter sentiment analysis could be used by stock market analysts and the fact that many computer programs are simply looking for tradeable correlations, I really started to wonder if Mervish’s theory was plausible.

Madrigal checked in with John Bates, former Cambridge computer whiz whose company Progress Software writes algo strategies for hedge funds to ask, “Is this at all possible?  Bates, to his surprise, answered “Maybe.”

We come across all sorts of strange things in our line of business, strange correlations,” Bates told me. “And I’ve had a lot of interest in this for a long time because it’s really often the secret source for certain hedge funds.”

Companies are trying to “correlate everything against everything,” he explained, and if they find something that they think will work time and again, they’ll try it out. The interesting, thing, though, is that it’s all statistics, removed from the real world. It’s not as if a hedge fund’s computers would spit the trading strategy as a sentence: “When Hathway news increases, buy Berkshire Hathaway.” In fact, traders won’t always know why their algorithms are doing what they’re doing. They just see that it’s found some correlation and it’s betting on Buffett’s company.

Algo/robo trading appears to becoming not only more bizarre, desperate and reaching the level of the absurd.   Imagine a program, for example,  written to sell 10K S&P500 futures contracts in illiquid market on the news of a report of a butterfly flapping its wings at home plate at Wrigley Field momentarily interrupting  a Cubs game.  The selling drives the index down 2 percent.  Another program written to sell several thousand  contracts when the index moves down 2 percent in, say,  a 45 second time period then kicks in, driving the index down another 3 percent.  Several thousand other programs are written to sell  several thousand more contracts when the market is down 5 percent.   A tornado on Wall Street set off by the flapping of a butterfly’s wings in Chicago?  Hey, don’t entirely discount such a scenario.  This is probably not far from what happened during last year’s “Robots Gone Wild” flash crash which was kicked off by the bank burning Greek riots.

At least we have some theories behind our correlations, such as the Hang Seng as an indicator species for global risk appetite.   And we did make some money once buying Callaway (ELY), the proud sponsor of Phil Mickelson, the Friday before he won his first Masters.

But  good luck trying to trade against this type of nonsense.   We also wonder if the robot has been reprogrammed to sell rather than buy Nike (NKE) after Tiger’s downfall when he is now mentioned in the news.   As they say on the newly paved Street, just go with the flow algo!

(click here if table and picture is not observable)
Posted in Equities | Tagged , , , | 8 Comments

Happy Super Moon!

By the way, a rare tornado touched down in Northern California today.  You think?

(click here if video is not observable)

Posted in General Interest, Video | Tagged , | 1 Comment

The Weekend Read

New York Fed President William Dudley on Friday cited the new improved tablet as an example of the economy’s dearth of upward inflation pressures. But for a Queens, N.Y., audience more worried about the price of food, that didn’t go down so well.

The central banker hit the iceberg when he was trying to defend his belief–one shared by many private-sector economists–that underlying inflation in the U.S. economy is low despite a worrisome surge in commodity prices which Dudley said the Fed would be “unwise” to overreact to. The grief Dudley got indicates the Fed is facing a growing gulf between how it and the public at large perceives inflation. If this disconnect widens, it could risk undoing the public’s confidence that the Fed will be able to keep price pressures at bay.

Dudley’s day went south when he was pressed by several audience members about how he can view inflation as low when things such as grocery prices are marching higher. One participant asked “when was the last time, sir, you went grocery shopping?” – WSJ

China
Chinese Bank Lending Slows – WSJ
China’s government may at last be getting a grip on its banks – Economist
China’s Fiscal Legerdemain – WSJ

Commodities
The World’s Next Great Bust: China and Commodities – The Atlantic

Demographics
The Countries Where Old Age Costs The Most – 24/7 Wall St.

Economics
California combines most of the shortcomings of the modern Western state – Economist
Irish inflation is lowest in EU at 0.9pc, says Eurostat – Independent.ie
Manufacturing Boosts U.S. Expansion as Fuel Dent Consumer Sentiment – Bloomberg
UK consumer confidence crashes to record low – Telegraph
U.S. Consumer prices climb 0.5% in February – MarketWatch

Energy
Wind, solar, biofuels to double by 2020, report says – CNET
World energy crunch as nuclear and oil both go wrong – Telegraph

Equities
Apple’s component deals should help it weather Japan crisis – CNET
Does Anne Hathaway News Drive Berkshire Hathaway’s Stock? – The Atlantic
SEC Sues IBM Alleging China, Korea Bribes – WSJ

European Debt Crisis
Euro-Zone Ministers Stall on Bailout Details – WSJ

General
Hedge funds hit by quake-fueled market selloff – MarketWatch

Geopolitical
Coalition prepares for air strikes on Libya – FT
Saudi king disappoints reformists – FT
Washington’s stark choice: Democracy or Riyadh – FT

Japan
Japan in ‘battle against time’ says IAEA – FT
Just Imagine Big Tokyo Quake, 23 Years Later: Michael Lewis – Bloomberg
Some natural disasters change history. Japan’s tsunami could be one – Economist

Monetary Policy
A Look Inside the Fed’s Balance Sheet – WSJ
NY Fed Chief’s iPad 2 Comment Irks Queens Audience – WSJ
Trichet Says His Message on ECB’s Rate Stance Hasn’t Changed – Bloomberg

Sovereign Debt
IMF Chief: Wider Definition Of Sovereign Risks Warranted – WSJ
Paradoxes that stalk the realm of sovereign debt  – FT

Video
UN Security Council Resolution  SC/10200 – Security Council Approves ‘No-Fly Zone’ over Libya, Authorizing ‘All Necessary Measures’ to Protect Civilians, by Vote of 10 in Favour with 5 Abstentions

(click here if video is not observable)

Posted in The Weekend Read | Tagged , , , | Leave a comment

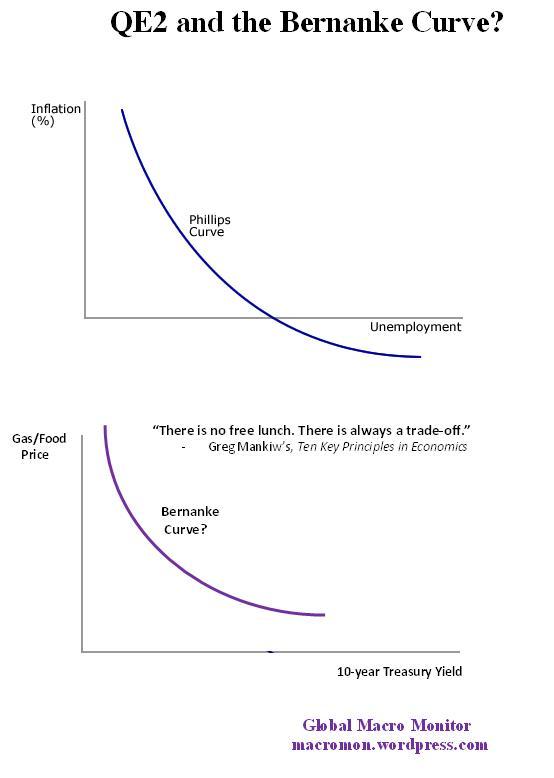
Chart of the Day: QE2 and the Bernanke Curve?

Sure there are fundamental reasons or a story for why commodity prices are moving higher, but let’s see what happens, especially to food and energy,  when if the Fed concludes quantitative easing and long-term yields spike.    Negative real interest rates and  excess liquidity are the “mother’s milk” of speculation.  We bet the “Bernanke Curve” is for real.  (click here if not chart is not observable)

Posted in Chart of the Day, Commodities, Crude Oil, Currency, Fiscal Policy, Monetary Policy, Policy | Tagged , , | 1 Comment

Is This Why Bill Gross Dumped Treasuries?

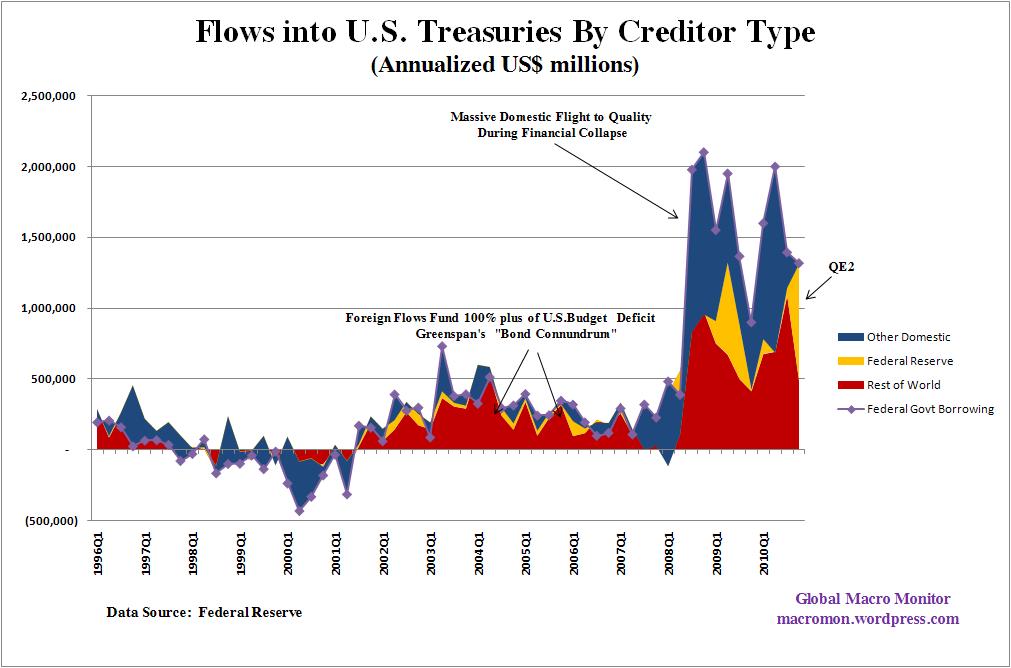
A couple of revealing charts from the Fed’s Flow of Funds data.   Both show net flows into Treasuries by creditor type and the Federal Government’s borrowing during each quarter.   Note, the quarterly data is annualized.

The first chart illustrates how QE2 flushed domestics out of Treasuries and effectively funded 63 percent of the budget deficit in Q4.  The Treasury is prohibited from directly selling bonds to the central bank, but effectively finances the government through POMO.

Given that a large portion of the Rest of World category are central banks recycling BOP surpluses,  it’s likely that 90 percent of the U.S. budget deficit in Q4 was funded by central banks.    You think this may have anything to do with what’s happening in the commodity markets?   That is, the central banks’ printing presses providing the fuel for speculators?

Furthermore, we ask: who is going to finance the U.S. budget deficit when QE2 ends, especially at a sub 3.50 percent 10-year Treasury rate?    Bill Gross knows!

(click here if charts are not observable)

Posted in Bonds, Budget Deficit, Charts, Fiscal Policy, Monetary Policy | Tagged , , | 14 Comments

Natural Gas Stocks Pop in Down Market

Some natural gas stocks did well in today’s terrible tape.  Two that we are watching and are long are Ultra Petroleum (UPL) and Southwestern Energy (SWN).  Both have been consolidating and have recently cleared their 50-day moving averages. Southwestern pierced 5-month resistance today.   The Japanese nuclear disaster has generated market talk of “paradigm shift” in global energy policy, which should benefit natural gas.

(click here if charts are not observable)

Posted in Charts, Commodities, Crude Oil, Equities | Tagged , | Leave a comment

Chart of the Day: Stockmarkets After Disasters

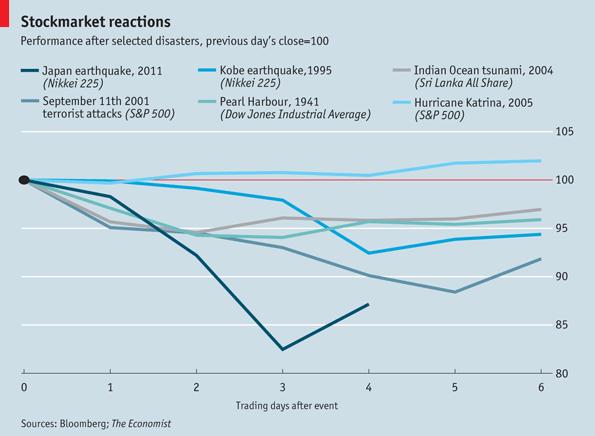
Great chart from the Economist, which even shows how the Dow fared after Pearl Harbor. The chart shows the Nikkei’s  reaction in the first three trading days after the current disaster is worse than all the others.   The question is does the market know something or is it an overreaction.  This uncertainty is wreaking havoc in the global markets.

(click here if chart is not observable)

Posted in Chart of the Day, Equities, Japan | Tagged , , , , | Leave a comment

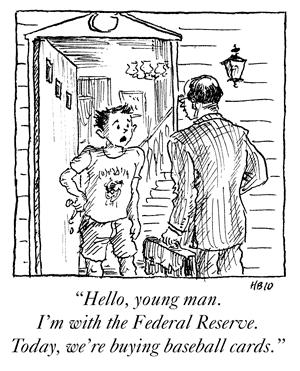
Cartoon of the Day: Fed Prepares QE3

Hat tip to Craig “Crack Spread” B.!   (click here if cartoon is not observable)

Posted in Cartoon of the Day, Monetary Policy | Tagged , | 1 Comment

Apple Closes Below 50-day Moving Average

After an impressive rally off its day low at 340.10,  Apple failed to close above ts 50-day moving average for the first time since September 2, 2010.  The stock was up 50 percent from August 24 to its March 4 closing high.  Japan was 5.4 percent of Apple’s revenues last quarter and there are now fears its supply chain may be disrupted due to the Japanese disaster.

Apple is the key stock to watch, in our opinion, and its failure to hold the 50-day makes us believe there is more downside in the global risk markets.   The Nikkei is bouncing as we write, but we doubt it will be sustained, however.   (click here if chart is not observable)

Posted in Apple, Equities, Japan | Tagged , , | 1 Comment

Nattie’s Day Has Come

The ugly bear market in natural gas may be about to end, in our opinion.  The nuclear crisis in Japan will force policymakers to look for alternative energy sources for electricity generation and natural gas is set up perfectly.

Natural gas is cheap relative to crude oil and trades for about $3.90 per 1 MM British Thermal Units (BTUs).   A barrel of crude oil, for example,  consists of 5.6 M BTUs and at $115 per bbl trades at $20.50 per 1 M BTUs.

The BTU equivalent price for a barrel of crude should therefore be $20.50  per bbl, excluding the issues of transportation and other factors.   The fact gas is difficult to transport excludes it from  the “China is buying everything” story making it an anathema to speculators and hedge funds.

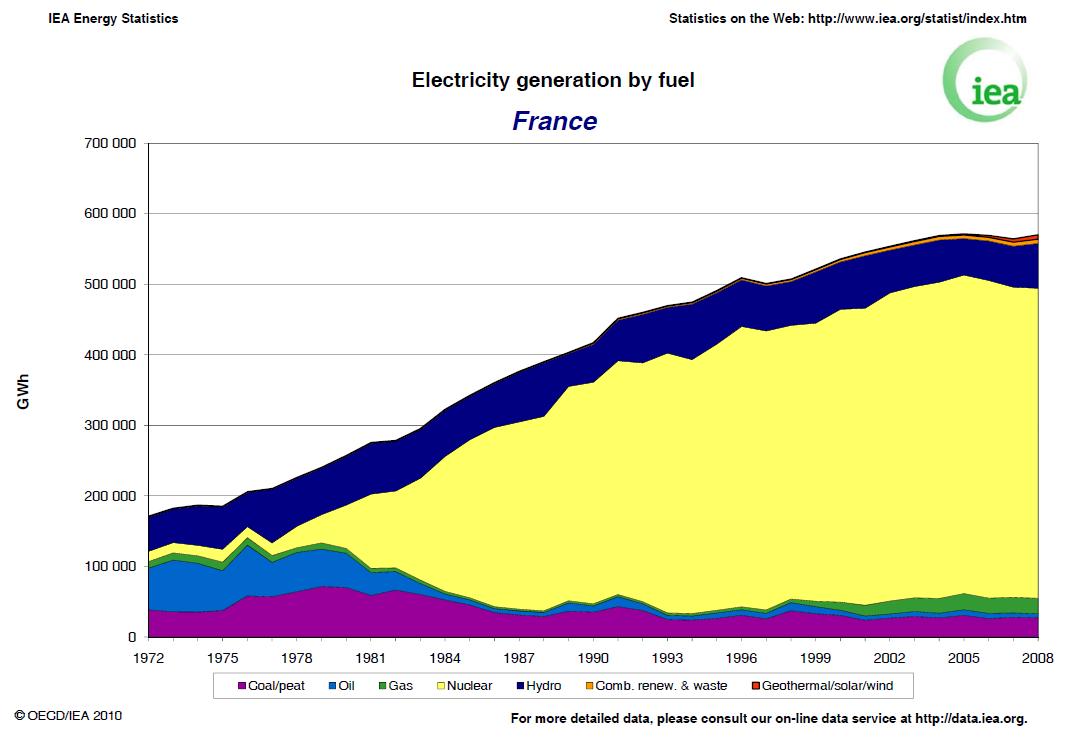
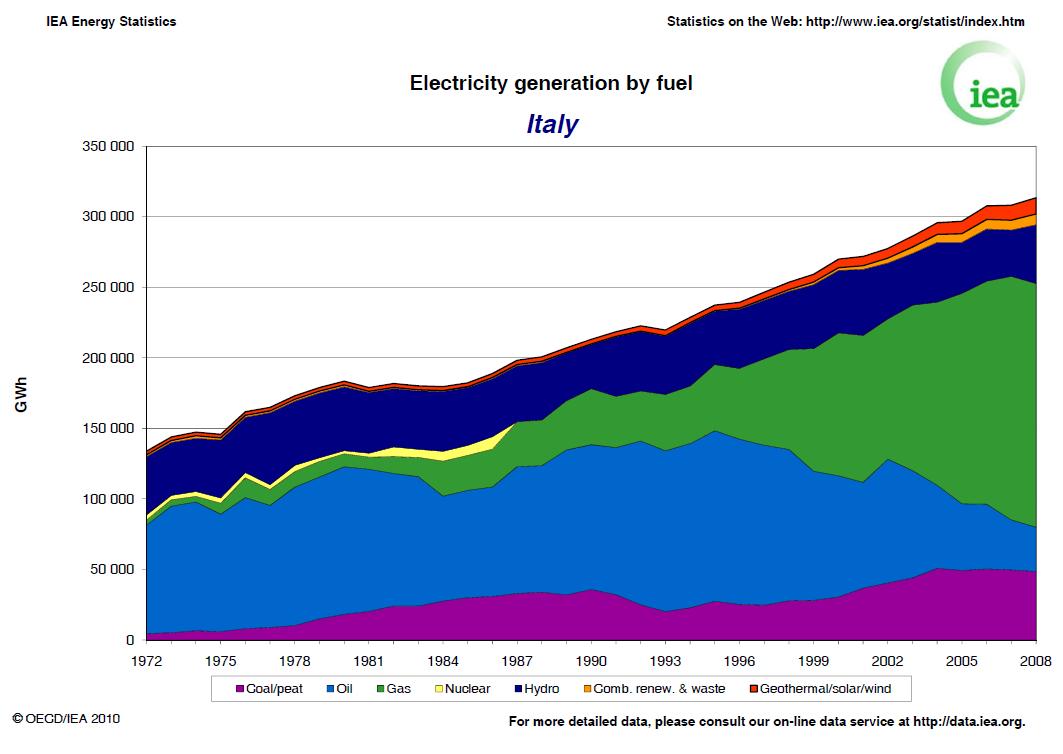
The following charts compare the evolution of France and Italy’s electricity generation by fuel type.   Much of this depends on access to the fuel type,  but the path of the two countries couldn’t be more different.  France has moved to an almost total dependence on nuclear versus Italy’s move to gas as a primary source for electricity generation.   Though Italy imports electricity and France is in surplus, we believe the markets will now adjust and focus on the Italy approach and use natural gas a bridge fuel while renewable energy sources continue to development.

(click here if charts are not observable)

Posted in Charts, Commodities, Crude Oil, Energy, Japan | Tagged , , , , , | 4 Comments