Biblical Breakout In 10-year Yields

Breaking out of an almost 40-year downward channel.  Don’t think higher rates are about to enter the “promised land” with public debt over 100 percent of GDP

The number forty can also represent a generation of man. Because of their sins after leaving Egypt, God swore that the generation of Israelites who left Egyptian bondage would not enter their inheritance in Canaan (Deuteronomy 1). The children of Israel were punished by wandering the wilderness for 40 years before a new generation was allowed to possess the promised land. Jesus, just days before his crucifixion, prophesied the total destruction of Jerusalem (Matthew 24:1 – 2, Mark 13:1 – 2). Forty years after his crucifixion in 30 A.D., the mighty Roman Empire destroyed the city and burned its beloved temple to the ground.  – BibleStudy.org

https://twitter.com/occupywisdom/status/1049731025448960000?s=21

Posted in Uncategorized | Leave a comment

Lavender Wave Still Cometh

Massive Lavender Wave Coming In November

We believe there will be a massive “lavender wave,” in the November midterms.  Lavender is the color combination of pink and blue.

…In elections, women are also more likely to vote in higher numbers and have done so for decades.  Women have cast between four and seven million more votes than men in recent elections.

…Do the math, folks.  Listen to the water cooler talk, read the cartoons.
GMM, Aug 5th

CNN is out with the most recent generic ballot poll, which will cause a sigh of relief in the Democratic Party.

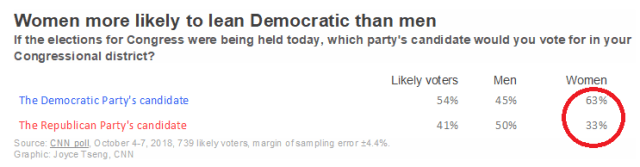
Washington (CNN) – Four weeks out from Election Day, Democrats remain well ahead of Republicans in a generic ballot matchup, with 54% of likely voters saying they support the Democrat in their district and 41% backing a Republican, according to a CNN poll conducted by SSRS.

This is the widest margin of support for Democrats in a midterm cycle since 2006, when at this point, the party held a whopping 21-point lead over Republicans among likely voters. That’s also when Democrats seized control of the House from Republicans, making Nancy Pelosi speaker until 2011. – CNN


Blue Wave_2


That is one big gender deficit for Republicans to make up in the next month.

The political arithmetic seems pretty simple:   more women vote;  women are more likely to vote, and women favor Democrats in the generic ballot by a yuuuuuge margin.

Dems Likely To Pick-up 27-47 House Seats

Our prediction is based, not on our personal politics, but on inference from the polling data, history, and simple factor models.   Recall, we predicted Trump would win the electoral college and Clinton, the popular vote, on the eve of the 2016 election.

Presidential Favorability Ratings And House Seats Gained/Loss

The midterm is almost always a referendum on the sitting president.  Moreover, voters are more likely to come out in November to say “f-you” than “thank you”, Mr. President.

The following plots Gallup’s presidential approval ratings a little over 600 days into a first-term presidency with the net seats gained by the party in the White House.


Blue Wave

Note the positive relationship with approval ratings and House seat gains.   The 2002 midterm is the only modern midterm election of a first-term president, which resulted in a net gain of House seats.

The model, with a decent .64 R-squared.  predicts the Republicans are set to lose 47 House seats in November.  Yes, we get it, small data set.

Crude Oil Price-Midterm Model 

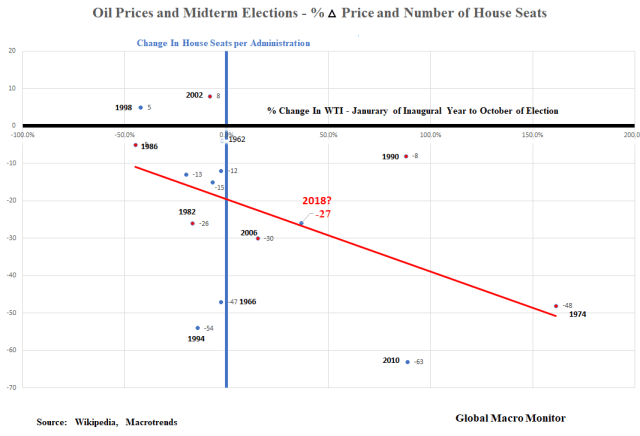
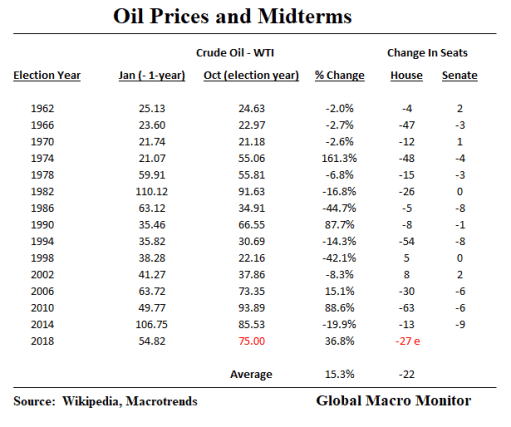
In our September 25th post, Rising Oil Prices And Midterm Elections, we laid out a simple prediction model based on crude oil prices and change in House seats during the midterm elections.

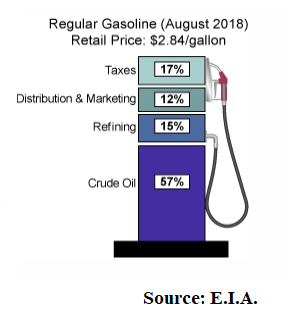
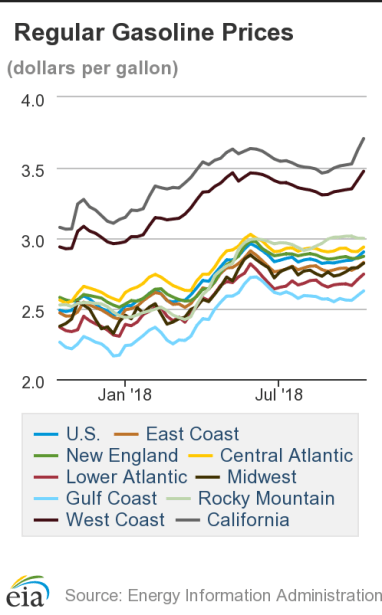
Gas prices are highly correlated with crude oil, and rising gas prices are politically toxic.


Blue Wave_5


Voters are feeling the pinch at the pump with gas prices up almost 20 percent year-on-year.


Blue Wave_6

The simple oil price model now predicts the Republicans are set to lose 27 House seats.

Blue Wave_3


Blue Wave_4

Upshot

We suspect the difference between a Lavender Tsunami and a narrow Democratic victory taking back the House will depend on if millennial women show up to vote in November.  Place your bets on how the recent SCOTUS hearings will motivate them either way.

Of course, the midterm elections will be determined by more than just the popularity of the president at the time or the 21-month increase in crude and gas prices.   It’s better than wishful thinking, however,  or putting a wet finger to the air,  and sure beats depending on a warm feeling in our tummy.    Stay tuned.

Posted in Crude Oil, Politics, Uncategorized | Tagged , , , , , | 3 Comments

QE’s Fading Legacy Moving Long Yields Higher

Summary

  • The legacy of the Fed’s QE is fading in the bond auctions
  • For the first time in several years, SOMA did not and will not participate in any of the September or October Treasury auctions
  • The Treasury has to refinance SOMA maturities with the issuance of new market debt or run down its checking account balance at the Fed
  • Though quantitative tightening does not increase the public debt, it puts supply pressure on the market
  • This post is an excerpt of our Sep 23rd post, The Gathering Storm In The Treasury Market 2.0

We suspect our Sep 23rd beast of a post,  The Gathering Storm In The Treasury Market 2.0,  was TLDR – Too Long, Didn’t Read.  One famous blogger said of it, “This post is so big, you can see it from space.”   We feel it was an important read for any market watcher as the 10-year T-Note yield is the most important price in the world.

In that post we which laid out why several factors which have kept U.S. long-term interest rates low and repressed term premium suppressed are fading,

Impatience and ADD equals missed opportunities,  as we wrote in the summary bullet points,

  • The yield curve is flat for technical reasons, and we believe term premia will increase
  • We expect a measured move in the 10-year Treasury yield to 4.25 to 4.40 percent, much sooner than the Street anticipates  – GMM, Sept 23rd

That was just before the 10-year yield broke out.

We are going to slice and dice the that post for an easier read for those of us use to 140 280 characters.

We named four significant factors that were changing and set to move long-term interest rates higher and increase the term premium.   This post extracts and focuses on the fading legacy of QE in the bond auctions

Posted on September 23rd

We now examine four changing structural factors that have created a favorable technical environment for the U.S. bond markets, which have kept long-term interest rates abnormally low and pancaked the yield curve:

  1. The ballooning of the budget deficit during economic expansion;
  2. QE and its diminishing legacy of reinvesting maturing notes and bonds;
  3. Borrowing from the social security trust funds,
  4. Globalization

The Diminishing Legacy Of QE
Treasury_Fed_Bal_Sheet

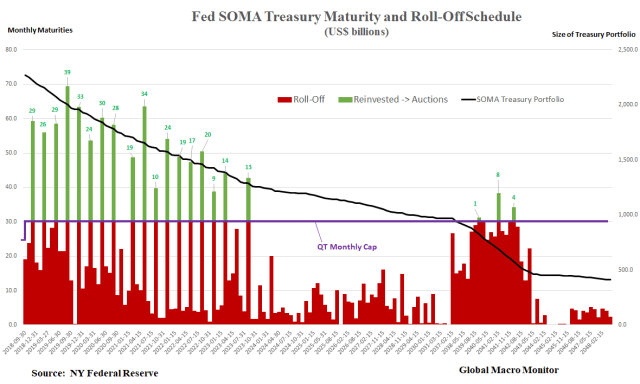
We constructed the following chart to illustrate the schedule of maturing Treasury securities by month, held in the Fed’s September 12th SOMA portfolio.
Treasury_SOMA_Maurities and Rolloff

In the current month of September, for example, $19 billion of Treasury securities mature, but the total falls below the $24 billion monthly quantitative tightening cap (purple line) leaving zero SOMA cash available to reinvest and participate in the Treasury auctions.  The $19 billion will not be reinvested and is reflected in the red bar.  The Treasury will be forced to plug the gap with new market borrowings or rundown its cash balance at the Fed.

The same dynamics hold for the roll-off of the SOMA MBS portfolio, where the cash balances at the Fed of the government-sponsored enterprises (GSEs) are reduced when mortgages run-off and not reinvested.

September To Remember

September will be the first month in several years where the SOMA will not participate in any of the notes, bond, FRN, or TIPs auctions.  Recall our early assertion, SOMA’s cash reinvestment of its maturing Treasuries back into the auction does not increase in the public debt.

The same holds for October, when the QT cap steps up to $30 billion per month, as $24 billion of Treasuries mature.

In November, $59 billion of SOMA Treasuries mature, of which $30 billion (the QT cap) will not be rolled over (red bar) and drained from the financial system, with the remaining $29 billion (green bar) in cash used as noncompetitive bids in the variety of notes, bonds, FRN, and TIP auctions.

Some argue SOMA’s impact on the auction and markets is de minis.  We disagree.

Asymmetric Effects Of QT

We need to think more about this but our first impression is the economic effect of quantitative easing, and quantitative tightening is not symmetric.  Because of the difference on the liability side, QT appears that it will be more direct, more onerous than expected, and will be quicker in its economic impact than QE.
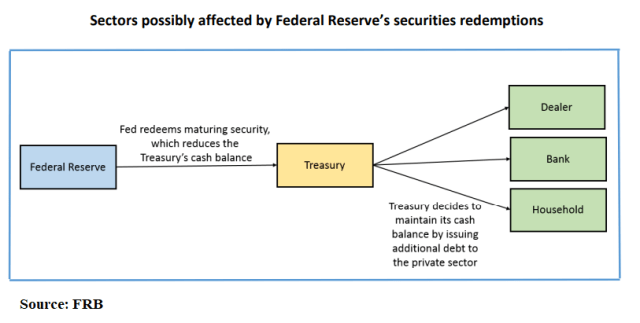
Treasury_Redemptions

Moreover, QE enabled the government to issue the debt it now has to pay back to the Fed or forced to roll by more issuance of marketable debt.

QE has blurred the lines between fiscal and monetary policy.   Quantitative easing (QE) has  just been “turbocharged fiscal policy in drag with a lag.” Great hip-hop line, no?

Portfolio Switching

Research at the Fed from last year expected a symmetric decline in demand for risky assets under quantitative tightening relative to QE.   The action in emerging markets this year appear to confirm, at least, in part, their analysis.

Carpenter et al. (2015) examined data from the Financial Accounts of the United States and found that the household sector—which in this dataset includes sophisticated investors such as hedge funds—was the predominate seller of Treasury securities to the Federal Reserve during its large-scale asset purchase programs, and that the household sector rebalanced its portfolio toward corporate bonds, commercial paper, and municipal debt and loans.  If we lean on their results and apply them in reverse—that is, reverse the actions that were found to occur during that earlier period so as to hypothetically mimic a period of Fed securities redemptions—then we would expect the household sector, as defined in this context, to rebalance its portfolio away from the riskier assets and back towards Treasury securities.  – Federal Reserve Board

Reduction In SOMA Treasury Portfolio 

The black line in chart above illustrates the decrease in the SOMA Treasury portfolio over time as securities roll-off.

Some argue that the stock of excess reserves are declining too fast, down 18 percent since QT began causing the Fed Funds rate to consistently trade at the top of the 25 bps target range.  Consequently, the Fed will be forced to end its balance sheet reduction sooner than the markets think.

A plausible scenario.   However, why not just stop paying or further reduce the interest rate on excess reserves (IOER), which will force reserves back into the Fed Funds market putting downward pressure on the rate?

If we had to guess,  QT ends in June 2022 when the SOMA Treasury portfolio hits $1.5 trillion and the MBS portfolio around $1 trillion.  We suspect, however, the glass will begin shattering long before then, forcing the Fed to reverse course.

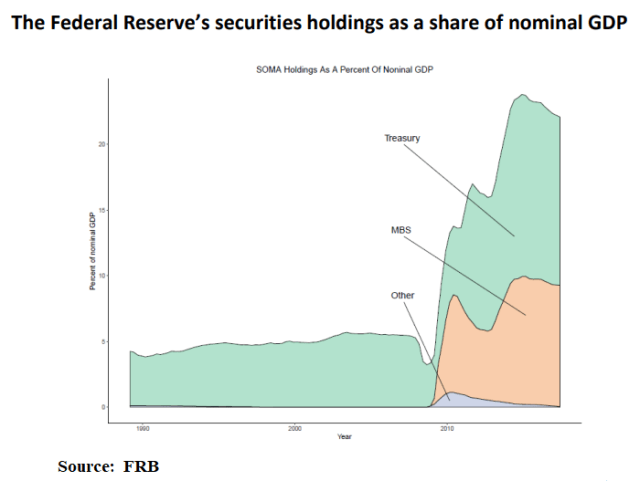
…before the financial crisis hit, growth in the Federal Reserve’s securities holdings was in line with growth in nominal GDP.  In particular, between 1990 and 2007, the Federal Reserve’s securities holdings totaled a fairly steady share—about 5 percent—of nominal GDP.  – Federal Reserve Board

A $2.5 trillion SOMA portfolio in June 2022 would be approximately 10.5 percent of GDP,  more than double its holdings before the GFC.

History Of SOMA Participation In Treasury Auction

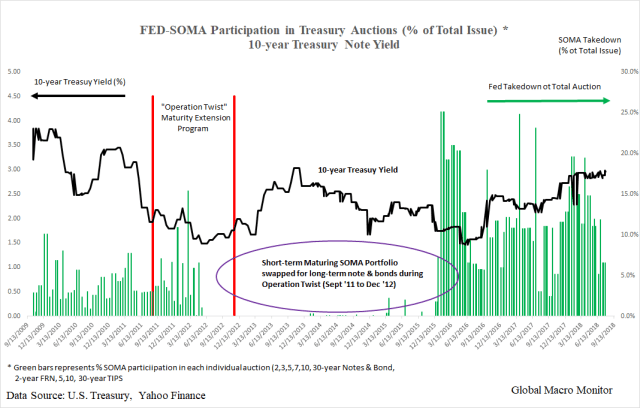
Our next chart illustrates the SOMA participation in every Treasury auction since September 2009, which was financed by the sum of its maturing securities during each particular month.

The green bars represent the SOMA percentage takedown of the total amount of securities issued during the auctions, and the black line is the corresponding 10-year Treasury yield on the date of each auction.
 

Treasury_SOMA_All Auctions

Operation Twist

The Fed engaged in “Operation Twist” between September 2011 and December 2012 (two red bars) to bring down long-term rates.  It sold shorter-term securities in its portfolio to purchase long-term Treasuries.  It appears just the anticipation of the program reduced yields as traders began front-running the Fed.

Interest rates began to spike as soon as the SOMA ran out of maturing securities and stopped participating in the auctions.   That is what concerns us now.

The SOMA’s participation in auctions going forward will be sporadic, at best, which could put upward pressure on rates and further crowding out borrowers as the Treasury is forced to issue more marketable securities.

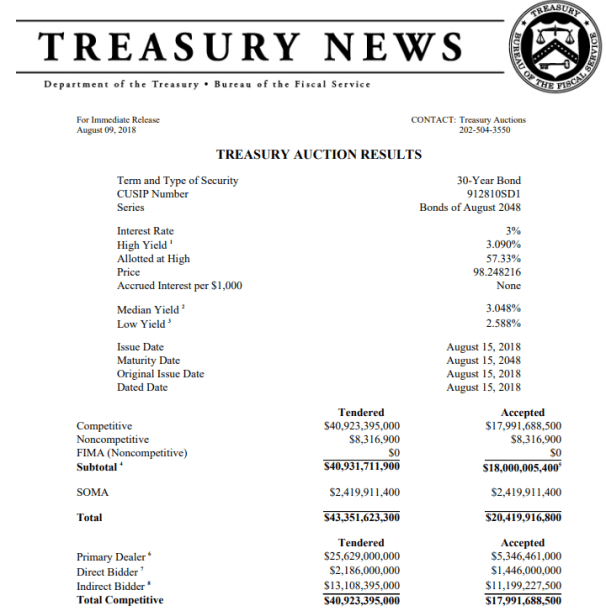
The following is the Treasury press release of the results from the August 30-year bond auction.  Notice the SOMA took down almost 12 percent of the total outstanding bonds issued.
 

Treasury_August_30_auction


SOMA Participation Does Not Increase Public Debt Stock

It is important to realize the net stock of Treasury debt does not increase with SOMA participation in the auctions as the cash is derived from maturing securities.  Nevertheless, is does allow size of the auctions to increase.

Declining SOMA Auction Participation 

Our next chart shows the recent past and future SOMA participation in the Treasury auctions through 2019.  The key takeaway here is that the SOMA will be active in the auctions in only five of the next 16 months,
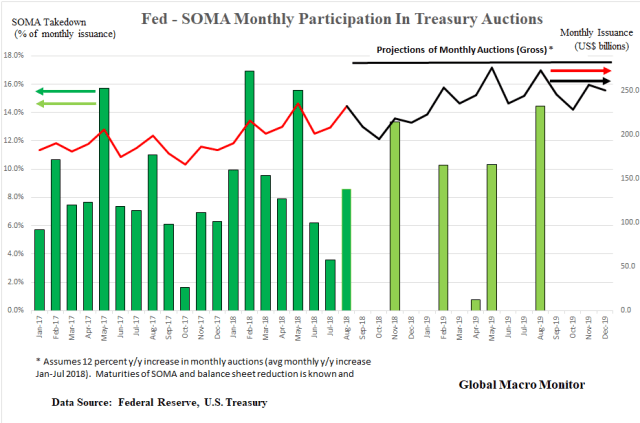
Treasury_SOMA_2017_2019

We believe the bond market has not fully focused on the diminishing participation of the SOMA in the auctions going forward.   It now has the data and should be on traders’ radar, causing upward pressure on long-term interest rates.   We could be wrong in our analysis of how powerful the impact SOMA’s auction participation is on markets, however.

Posted in Debt, Fed, Fiscal Policy, Interest Rates, Uncategorized | Tagged , , | 3 Comments

World’s Fastest Growing Economies In 2018 & 2019

The latest data just released from the IMF.

We have updated the 2018 and 2019 annual GDP forecasts of the world’s country GDPs in our ginormous table below. The data are from the recent release of the October  2018 IMF’s World Economic Outlook.

Let’s begin by first checking out the G20 data.


IMF G20 Growth


IMF_World Growth


Posted in Economics, Uncategorized | Tagged , , , | Leave a comment

Fighting Back


Love this.


Posted in Uncategorized | Leave a comment

Manufacturing Employment Growth During President Trump

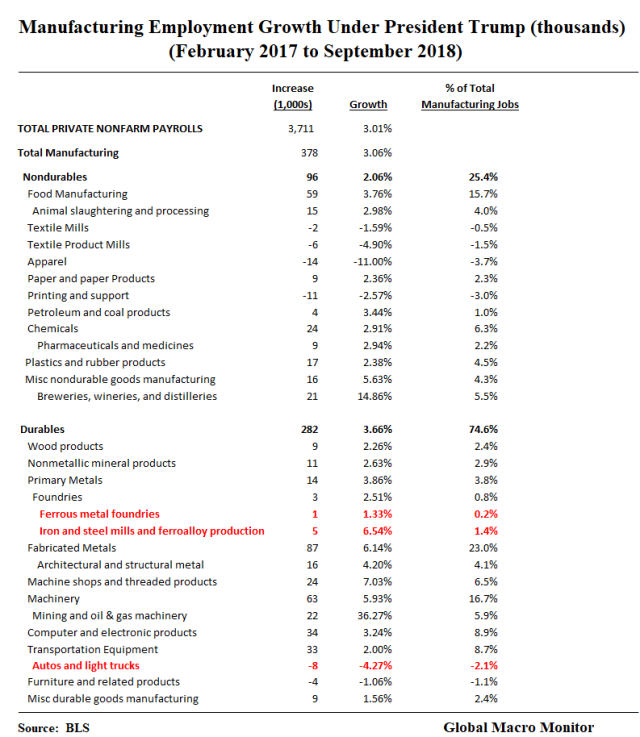
After Friday’s jobs report, we thought it is time to dig deeper into employment growth in the manufacturing sector.

Manufacturing Jobs Matching Growth In Total Nonfarm Payrolls

Contrary to popular belief, the data show that job gains in the manufacturing sector are not experiencing outsized growth.  Employment in the industry has grown at about same pace as private nonfarm payrolls since January 2017, just a little over 3 percent.  Manufacturing employment has, however, recovered smartly under President Trump, after a period of almost zero growth during the last 20 months of President Obama’s administration.

The bulk of manufacturing employment growth has occurred in food manufacturing, fabricated metals, and machinery.

Job Growth Still Lagging in The “Poster Children” – Steel and Autos

Job growth in the sector’s  “poster children”  — steel production and auto manufacturing — remains tepid, at best.

Employment in the steel industry (highlighted in red) has yet to match the spike in steel prices and profits, which have skyrocketed after the implementation of President Trump’s tariffs.

CLAIRTON, Pa. — When President Trump imposed tariffs on steel imports in June, Richard Lattanzi thought of dozens of his fellow steelworkers who have for years put off badly needed repairs of their cars and homes.

“There was a lot of excitement here; there were a lot of us saying, ‘It’s about time someone is looking out for us,’ ” said Lattanzi, the mayor of this town of 7,000 and a safety inspector at the U.S. Steel plant in nearby West Mifflin. “A lot of people around here were saying, ‘We’re going to be okay.’ ”

Four months later, Lattanzi is less optimistic. Production at U.S. Steel’s facilities have ramped up, and the company announced this summer that, thanks in part to the tariffs, its profits will surge. But in interviews in recent weeks, Lattanzi and other steelworkers said they’re no longer confident they’ll take part in the tariff bounty.  – Washington Post, October 3rd

Auto manufacturing jobs continue to decline, down 8,000 since the beginning of President Trump’s term.

Mining Employment And Oil Prices

Finally, where employment growth is experiencing outsized gains is in the mining sector, up over 16 percent,  which is almost entirely the result of the recovery in oil prices. The crude price collapsed over 70 percent before bottoming at around $30 bbl in early 2016, forcing mass layoffs in the oil patch, which are now being recovered.

Coal mining jobs, for example, have only increased by a little less than 2,000, but it does represent a reversal in the decline under President Obama.

Construction jobs are also growing smartly


Man_Employment_2


Man_Employment_1


Employment_2


Man_Employment_4


Employment_1

Posted in Employment, Uncategorized | Tagged , | 6 Comments

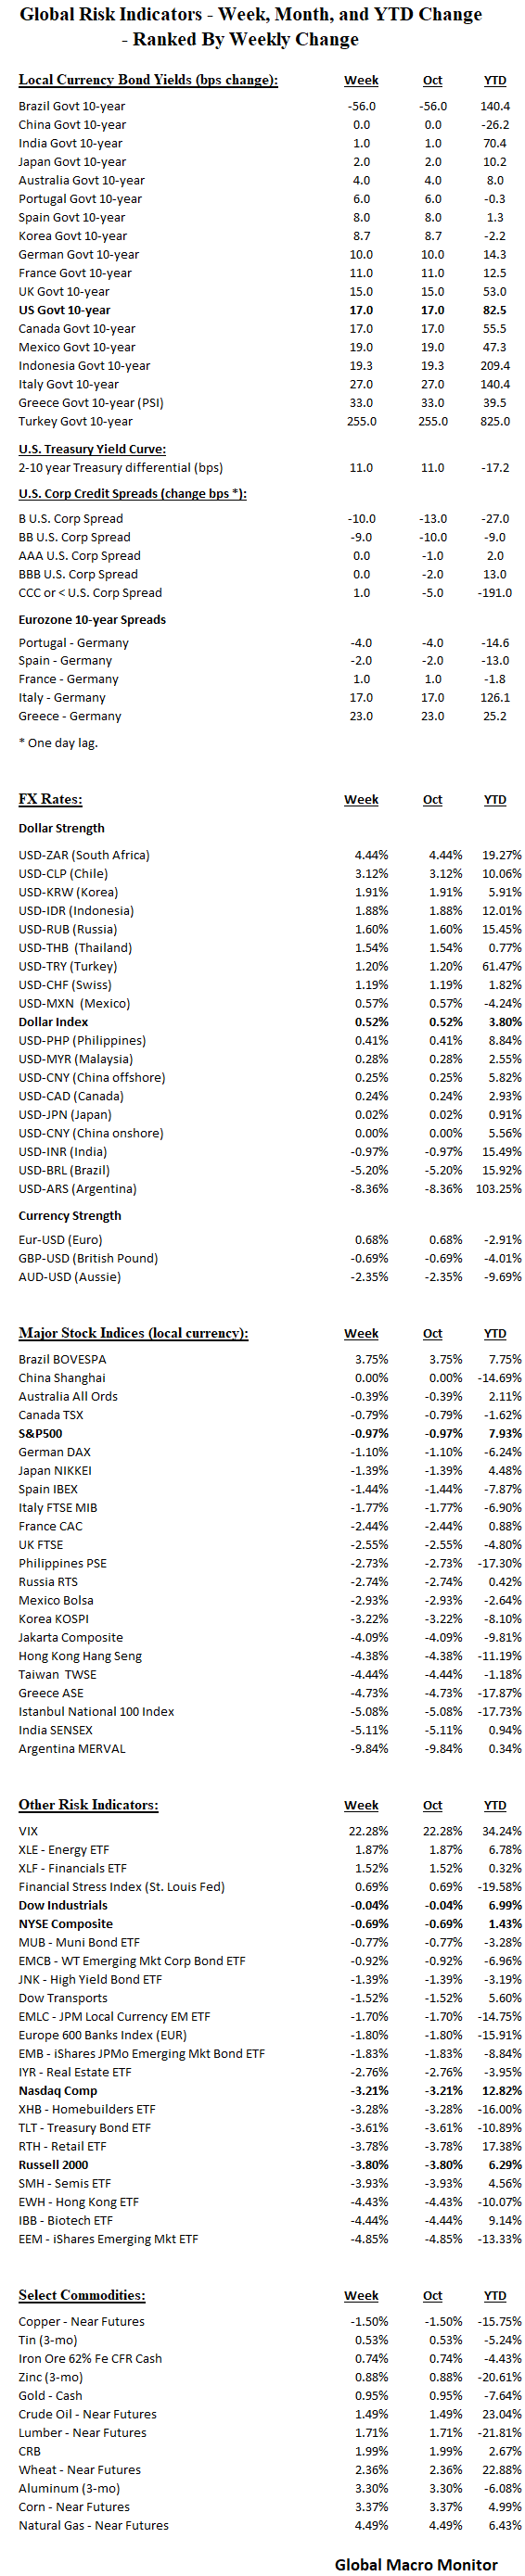
Week In Review – October 5

Summary

  • Ugly week for Global Bonds.  Run to our Sept 23rd post, The Gathering Storm in the Treasury Market 2.0,  as to why we thought yields were about to spike.  Boy, did they
  • Stocks followed bonds lower causing pain the interest rate parity funds
  • Credit hanging in there.  Need weakness here to validate a stock market top.  Watch this space
  • EM FX hammered x/ Argentina, which is experiencing an oversold bounce and afterglow of an updated IMF deal
  • Commodities showing some life, led by nattie and the grains

Commentary:  All eyes on long-term interest rates this week.  If the bond sell-off accelerates, expect a big risk-off move this week.  Rising rates are not good for the now heavily indebted AE sovereign sector.  Potential doom loops ahead:  rising interest rates = interest payments = rising deficits = rising interest rates = rising interest payments = rising deficits = rising interest rates.   The U.S. bond market seems oversold and should, at least, generate and dead cat bound here.  If not, GULP!

10-year Treasury Note Yields

Week_Chart_1

Source:  Jesse Colombo @TheBubbleBubble 

Week_2018_ETFs


Week_Table

Posted in Bonds, Uncategorized, Week in Review | Tagged , , | Leave a comment

Brazil’s Presidential Election….

Looks like off to Round II — October 28th — as no candidate set to receive 50 percent of the first round vote, with Brazil’s Trump fanboy securing around 45 percent of the vote.

Note, Brazil’s similar gender divide in support of Bolsonaro as American women have with President Trump.

An interesting thing to keep an eye on as results come out are the breakdown of votes along gender lines.

Though he is in the lead, Bolsonaro is the candidate with the biggest discrepancy between his male and female vote, not only in this election, but in the history of Brazil.

Polls from a month ago showed that 49% of women in Brazil oppose Bolsonaro’s candidacy, compared with just 37% of men and in some states Bolsonaro has 75% less support among women than men.

This could be related to the fact that the far-right candidate has previously called women idiots, tramps and unworthy of rape.  – The Guardian

Brazil Exit Polls

Posted in BRICs, Uncategorized | Tagged , | Leave a comment

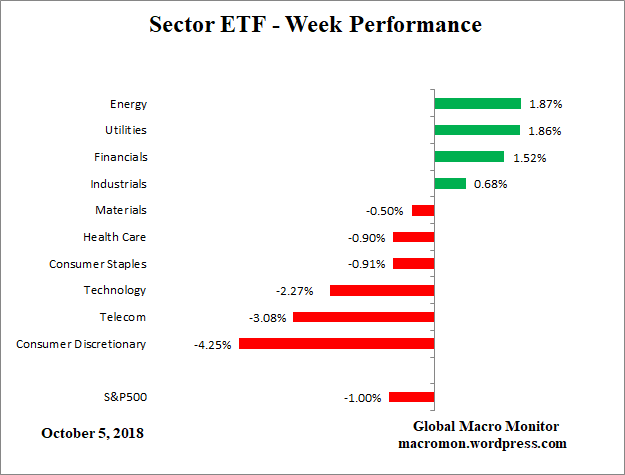
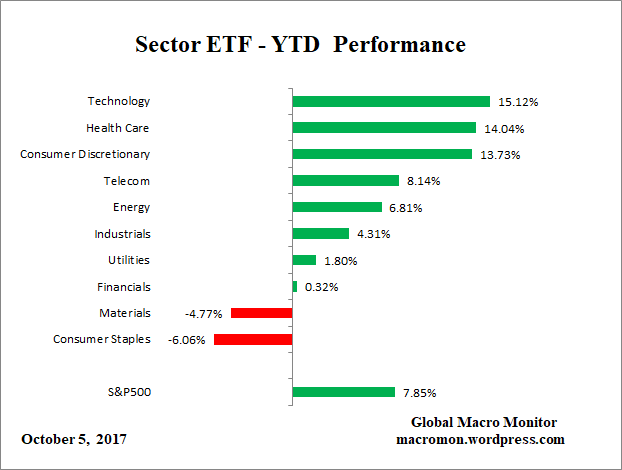
Sector ETF Performance – October 5

Sector_ETF_Day

Sector_ETF_W

Sector_ETF_YTD

Posted in Sector ETF Peformance, Uncategorized | Tagged | Leave a comment

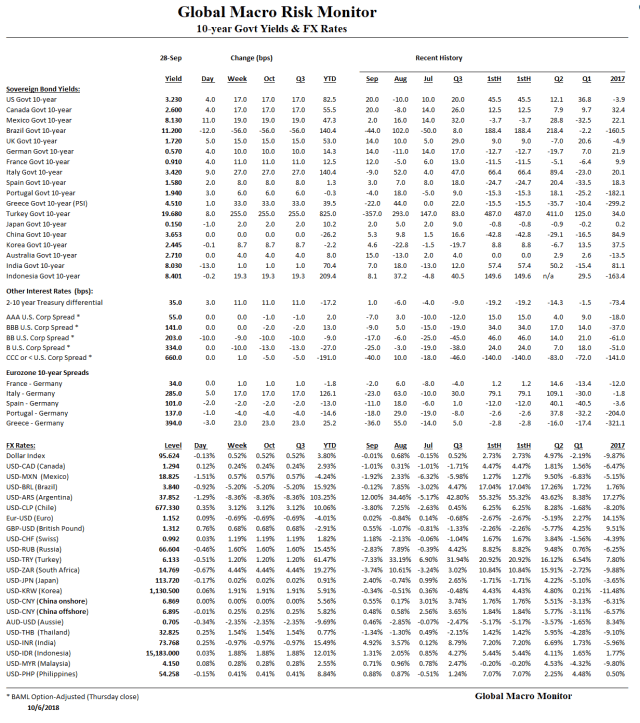
Global Risk Monitor – October 5

RiskMon_1

RiskMon_2

Posted in Daily Risk Monitor, Uncategorized | Tagged , , , , , | Leave a comment