Politics Of The Employment Report

Today’s nonfarm payrolls miss,  134k total jobs created in September, sealed the deal on the job creation political debate before the November midterms.   That is all things being equal — during President Trump’s first 20 employment reports versus President Obama’s last 20 — the Trump economy created 347k fewer total nonfarm payroll jobs, and 137k fewer private sector jobs, than President Obama’s economy.

The differential will move even more against President Trump when October nonfarm payrolls are reported, the Friday before the election, as the May 2015 326k jobs comp will be a bar too high to conquer.

These are the facts, spin them as you wish.

On the eve of the midterm elections it is very likely the Democrats will be able to argue that President Obama’s economy created 500k more jobs than President Trump’s economy over a similar period.   Reality clashes with virtual reality and bombastic rhetoric.

Perspective

However,  all things are never equal.  The Trump economy is running up against labor constraints with shortages breaking out almost everywhere, which is reflected in today’s 3.7 percent unemployment rate print, a 49-year low.   It’s difficult to create the marginal job on this side of the inelastic labor supply curve.

Data should always be placed in the proper context.  But, hey, we are talking politics here,  which almost always surrenders to spin and is rarely about rational discourse. Moreover,  “politics ain’t beanbag,” folks.

Other Notables 

  • The shrinking labor supply is illustrated in the inflation differentials during the two periods –  4.14 percent under Trump, and 2.12 percent during Obama’s last 20 months in office.
  • Trump’s nominal Average Hourly Earnings are running about 70 bps higher than Obama
  • Real Average Hourly Earnings under Trump is about 1.3 percent lower than during President Obama’s last 20 employment reports
  • Real GDP growth under Trump is almost double President Obama’s last six quarters in office, but not reflected in the overall labor market, which reflects the economy continues to reward capital disproportionate to labor
  • Manufacturing jobs have recovered smartly during President Trump’s first 20 months, much of it due to the increase in oil prices, especially in the mining sector
  • Job creation in the government sector, which, on average, generates higher income paying jobs than the private sector, is much lower under President Trump


Employment_2


Employment_1

Posted in Employment, Politics, Uncategorized | Tagged , , | Leave a comment

Alea Iacta Est!

As Julius Caesar crossed the Rubicon River with the 13th legion into Italy to march on Rome, he turned to one of his deputies, quite possibly, Marc Antony, and made the famous remark, “alea iacta est.”  Historians translate this as “the die is cast,” the decision is made, there is no going back.

Yields Cross The Rubicon

Today the U.S. bond market crossed the Rubicon with the 10-year yield breaching major resistance at,  let’s call it, 3.12 percent, a high that hasn’t been seen since July 2011, ironically the month named in honor of Julius Caesar.

July 2011 was also just before or in anticipation of “Operation Twist,”  the Fed’s program to manipulate longer-term rates lower.


Treasury_1_Oct3


You know what we think about the Treasury market.

We laid out all the reasons why the structural factors that have kept long-term interest rates low and risk premia suppressed are fading in our September 23rd beast of a post,  The Gathering Storm In The Treasury Market 2.0.  

Also, have a look at our Monday piece on the massive short build in 10-year note futures.

Though it’s too early to tell, the move in the 10-year yield today may be the signal that global bond yields are awakening from their QE-induced slumber.  The flow of long-term notes and bonds is rising, as the Treasury issues more securities to finance larger budget deficits,  but the big short in 10-year note futures remains, and the relative stock/float of long-term Treasuries is still low.

It may take a few days of trading above the breached resistance level to bolster the confidence of the bond bears.


Treasury_2_Oct3

Nevertheless, a more “normal” long-term yield would be closer to a 3 percent real rate, which is more than a chip shot from here, and, at the very least, two drivers away from today’s 3.16 percent close.   We expect the first drive to hit the the 4.25 to 4.40 percent range, which is a measured move of the inverse head and shoulders pattern in the above chart, probably sooner rather than later.

Even the 10-year Japanese bond yield is pressing up against two-year highs, albeit at a poultry 15 bps.

QE Induced Asset Market Psychosis

Supply shortages, induced mainly by central bank quantitative easing have been a major factor driving asset markets, in our opinion.  Not all, but a big part.

Risk-free bonds have been in short supply as central banks have hoovered up their home country government bonds with quantitative easing.

Treasury_4_Oct3

Equity Float Shrinkage

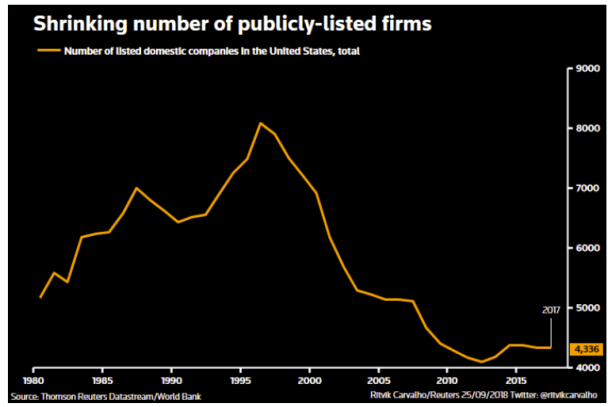
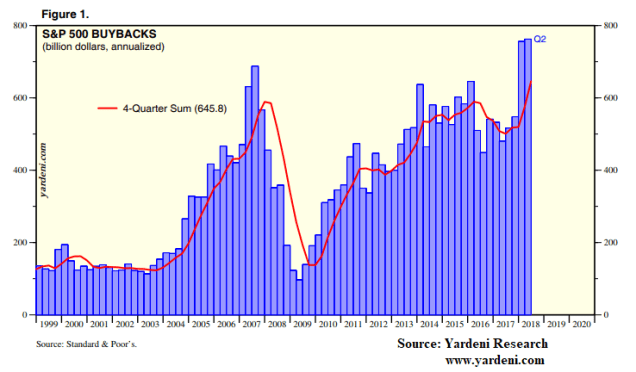
The float of total U.S. equities has shrunk dramatically, in part, due to cheap financing to fund share buybacks.   The technical shortage of stocks have helped boost U.S. equity markets and killed off the most of the bears and short sellers.

We have no idea if short sellers can push the market lower on a sustained basis as rates rise, forcing some real selling in the near term.  Probably not, if we define near term, say, as in the next month.

It’s possible, but our recency bias tells us no, unless rates move to our target range more rapidly than we even expect.   Today’s increase in yields did cause selling into the close.
Treasury_3_Oct3

Source:  Yardeni Research

Housing Market

Even the housing market suffers a dearth of supply.

Private equity, now the largest single holder of single-family residential real estate, has taken a massive supply of homes off the market and converted them to rentals, partly due to the lower cost of capital caused by the manipulation of the Treasury yield curve.  Will these investors start to sell down their inventory as rates move higher, or just continue to raise rents, which could create a real political problem?

…one-fourth of the country’s single-family rental homes are now owned by institutional investors, with more than 200,000 families paying their rent to just nine giant Wall Street-backed firms. According to a report by the Harvard Joint Center for Housing Studies, the majority share of all U.S. rental units (52.2 percent) are owned by institutional investors, and the investor-owned share of single-family homes increased by nearly 40% from 2001 to 2015.5ACCE

We suspect a populist message from a 2020 presidential candidate railing against the “Wall Street firms, who were bailed out then bought your homes in bankruptcy and are now raising your rents”  would resonate with the hoi polloi.   Even if it’s true, or not.

In California, rent increases by some of the largest Wall Street landlords have been astronomical. For example, Colony Starwood Homes reported that in Northern California rental renewal rates increased by 9-13%, the largest in the nation. This means that if tenants already living in a Colony Starwood home want to continue to rent, they must pay between 9 to 13% more each year. A survey conducted in early 2017 of Los Angeles County tenants renting from Invitation Homes and Colony Starwood shows consistently high rental increases in the Southern California market as well. Of the 100 tenants surveyed, 77% reported rental increases and the average reported increase was 9% or $171 per month.  – KCET 

Does “truth” even matter today?  It’s only true if you believe it to be true in our postmodern Trumpian era.

Treasury_5_Oct3

Vulnerable Markets

The structural factors that have kept U.S. long-term interest rates low are now fading and yields are set to move significantly higher. That is back to normal.

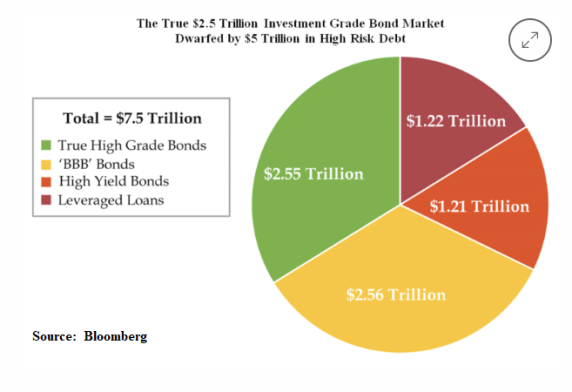
The markets, which look the most vulnerable on a technical basis in the near-term, are those that have seen a significant increase in supply since the financial crisis.  Such as emerging market debt and U.S. corporate bonds and debt at the lower end of the investment grade spectrum.
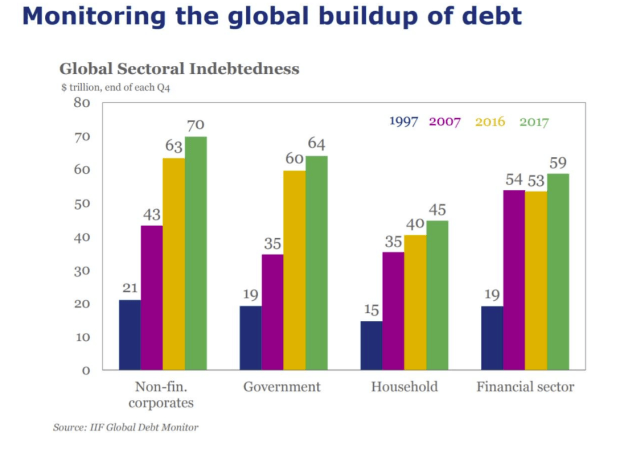
 

Global Debt Increase

Commercial Real Estate

Also keep the commercial real estate sector on your radar,

With investors acquiring $30.5 billion in industrial assets in the first half of 2018, JLL’s H1 2018 U.S. Investment Outlook report notes that the industrial sector is on pace for a new record year in terms of transaction volume and is expected to surpass the previous high point of $67.8 billion in 2015. That momentum, coupled with $20 billion in large scale transactions that are under contract and set to close in the second half of 2018, serves as evidence of the intensity of investor competition for industrial assets.

As a result, the national average cap rate across all classes of industrial assets has dipped to a record low of 7.0 percent. Average cap rates are even lower in the five industrial markets with the most supply constraints: 4.5 percent in Orange County, Calif.; 5.0 percent in San Francisco; 5.2 percent in Los Angeles; 5.3 percent in the Inland Empire and 5.4 percent in Seattle.

At the peak of the last cycle, the average cap rate for industrial assets was 7.2 percent, according to Chang. But starting with 2010, when the figure reached 8.7 percent, industrial cap rates have continued to drop, driven by economic expansion and growth in e-commerce sales.  – National Real Estate Investor

Recall our “Cranes of Dubai” comment after returning from summer break.

Euro Sovereign Bonds

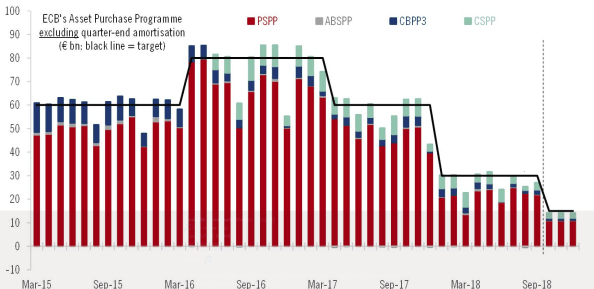
The market to closely monitor now is European sovereign bonds.  The ECB’s QE is set to end in December and inflationary pressures are building.  The yield spread between U.S bond and German bunds is approaching long-term highs.
Treasury_6_Oct3

          Source:  Frederik Ducrozet  @fwred

Italy is the wild card, but we suspect the government has enough leverage with the EU due to the country’s importance in the euro and the sheer size of its bond market.  Though it will upset many Germans, the EU will likely calculate that bigger budget deficits in Rome are not worth blowing up Europe.   In other words,  lot’s of noise to come.

We expect European interest rates to rise significantly over the next year, reinforcing the global bond bear market.

Upshot

All of the above will take time to unfold, with the usual ebb and flow of markets, providing traders with many profitable opportunities.

Rome wasn’t built in a day.  Alea iacta est!

Posted in Bonds, German Bund, Interest Rates, Uncategorized | Tagged , , , | 19 Comments

The New FX Model: PMI Differentials?

One of Australia’s finest, and best market analyst, Greg McKenna, and more important, our good friend, posits a new exchange rate determination model:  PMI differentials.

We cut our teeth as a young economist on Anne Krueger‘s book,  Exchange Rate Determination.   The book is dated, but we highly recommend it, a good and quick read.

FX traders use many models to justify and fundamentally rationalize trades at any period in time, such as:

  1. GDP growth differentials;
  2. Interest rate differentials;
  3. FX reserve levels (mainly in the emerging markets, especially);
  4. Current account balances;
  5. Capital flows;
  6. Purchasing Power Parity (long-term model);
  7. Other;
  8. and, now, Greg’s PMI Differentials

FX traders are married to none of the above, and switch back-and-forth between the various FX models, or, at least, they act as if they do.

The key to success in trading is to understand what is the dominant model driving the market at any given time and determining the trend if one exists.

Posted in Capital Flows, Exchange Rates, Uncategorized | Tagged , , , , | 4 Comments

The Menu Of Quant Trading And Investing Strategies

Excellent synopsis from Bloomberg’s,  Your Guide to the Many Flavors of Quant Investing, of the various quant trading and investment strategies.

Factor investing

You like Indian food and Thai food, so maybe you like all spicy foods.

  • HOW IT’S DONE: Factor refers to a characteristic of an asset — a stock’s volatility, a company’s profitability — that, according to the quant’s data, is shared by successful investments. The quant builds a fund that automatically buys assets (stocks, typically) exhibiting that trait. Sometimes known, imprecisely, as smart beta or risk premia.
  • TYPICAL HOLDING PERIOD: Months to years.
  • EXAMPLE: You view value — is the share price relatively cheap? — as an historically accurate signal that a stock is going to outperform. Buy the cheapest stocks and short the most expensive ones, no matter their names or type of business.
  • WHY IT MAKES MONEY: It takes advantage of behavioral biases and mistakes that investors reliably make. For example, people tend to undervalue less-glamorous stocks. Factors are also sources of risk that reward investors with superior returns over time.
  • FIRMS THAT USE IT: AQR Capital Management, BlackRock Inc., Goldman Sachs Asset Management

Risk parity

Diversifying, with a twist.

  • HOW IT’S DONE: A type of asset-allocation strategy that aims to hold an equal amount of risk among investment classes, which react differently to market changes. The trader diversifies — among, say, fixed income, equities and inflation-risk assets — based not on price but on volatility or some other measure of risk. The less volatile an asset, the bigger weighting it gets in the portfolio.
  • TYPICAL HOLDING PERIOD: Months to years.
  • EXAMPLE: Calculate volatility for four different asset classes. Invest your money proportionally, depending on each’s volatility over the past year. If the result is a bond-heavy portfolio with too little upside, use borrowed money to make bigger bets. At the end of each month, calculate the volatility again, and rebalance.
  • WHY IT WORKS: This risk-mitigating strategy aims to produce a smoother ride, with diversification helping the fund during difficult market stretches.
  • FIRMS THAT USE IT: Bridgewater Associates, AQR, Man AHL

Systematic global macro

See the forest, not just the trees.

  • HOW IT’S DONE: Broader and somewhat more patient than CTA, this approach trades across asset classes and countries and relies upon macroeconomic principles. Using data such as inflation, unemployment and consumer spending, the strategy attempts to build a set of rules that govern the relationship between economic cycles and market movements.
  • TYPICAL HOLDING PERIOD: A month or longer.
  • EXAMPLE: To capture the spread between different currency rates, sell low-interest-rate currencies and buy higher-interest-rate assets. This is called a carry trade.
  • WHY IT WORKS: It benefits from diversification across asset classes. It’s often billed as a risk-mitigating strategy, participating on the upside but protected on the downside.
  • FIRMS THAT USE IT: QS Investors, Quest Partners LLC

Event-driven arbitrage

You don’t need a crystal ball to know what’s coming.

  • HOW IT’S DONE: A classic hedge fund strategy, anticipating corporate actions and events, with an algorithmic approach. It exploits mispricings that occur before or after analyst revisions, share buybacks, bankruptcies and the like.
  • TYPICAL HOLDING PERIOD: Days to weeks.
  • EXAMPLE: A stock’s trading volume tends to rise, as does the price, around its earnings announcement date, when traders are more sensitive to company news. So buy before earnings announcements.
  • WHY IT WORKS: It gets ahead of where the market predictably moves in response to an event.
  • FIRMS THAT USE IT: AQR, BlackRock

Statistical arbitrage

With time, everything gets back to normal.

  • HOW IT’S DONE: Seeks mispricings in the market by identifying relationships among securities, detecting anomalies, then betting on things returning to normal. Shorthanded as “stat-arb” and often used as a catch-all for fast quant strategies. Pairs trading is one well-known version.
  • TYPICAL HOLDING PERIOD: A day to a few weeks.
  • EXAMPLE: Assume Coca-Cola Co. and PepsiCo Inc. will trade similarly. Notice when Coke rises while Pepsi falls. Short Coke, buy Pepsi, profit as they realign.
  • WHY IT WORKS: The strategy takes advantage of the idea that the market overreacts, then adjusts.
  • FIRMS THAT USE IT: Renaissance Technologies, Two Sigma, WorldQuant

CTA

There’s always room on the bandwagon.

  • HOW IT’S DONE: This acronym for Commodity Trading Advisor — a regulatory label for firms that may trade futures or options — has become synonymous with systematic, trend-following quant strategies. The trader takes a position — in equity index futures, fixed-income futures, currency futures and/or commodity futures, domestic or foreign — only after a trend appears in the price data.
  • TYPICAL HOLDING PERIOD: A day to a few weeks.
  • EXAMPLE: If the energy futures contract you hold closes at a 50-day high, buy energy futures at tomorrow’s open. If it closes at a 50-day low, short them. This is called a channel breakout model.
  • WHY IT WORKS: Asset movements tend to last a least a little while, so investors can make money riding a wave. CTAs are among the most volatile strategies, with only one-third to one-half of trades being profitable. But the profitable ones make lots of money.
  • FIRMS THAT USE IT: Man AHL, Winton Capital Management

The Reference Shelf

Source:  Bloomberg

Posted in Qunat Strategies, Uncategorized | Tagged , | Leave a comment

Crude Reality For Emerging Markets

This chart comes to us via the “Polish Swish,” known for his nuttin’ but net baseline jumper.  It illustrates the local pain of rising oil prices in a few selected emerging markets.

Crude oil is priced in dollars, and countries which have seen their currencies get hit this year are suffering asymmetric pain, complicating and adding to local economic  and inflationary pressures.   India, China, Taiwan, Chile, Turkey, Egypt and Ukraine are the emerging markets most vulnerable to $100 per bbl crude.

Oil prices have made a beeline to $75 bbl since mid-August as traders front-run the Iranian sanctions coming online in November.

The second period of sanctions will take effect from Nov. 4, after which Iran’s port operators, shipping and shipbuilding sectors will be limited.

The National Iranian Oil Company (NIOC) will also see sanctions along with petroleum-related transactions that include the purchase of petroleum, petroleum products, and petrochemical products from Iran.

Along with the impact on Iran’s energy sector, sanctions will also affect transactions between foreign financial institutions and the Central Bank of Iran.

“In addition, effective Nov. 5, 2018, the U.S. government will revoke the authorization for U.S.-owned or -controlled foreign entities to wind down certain activities with the Government of Iran,” the Treasury statement said.
–  Albawaba


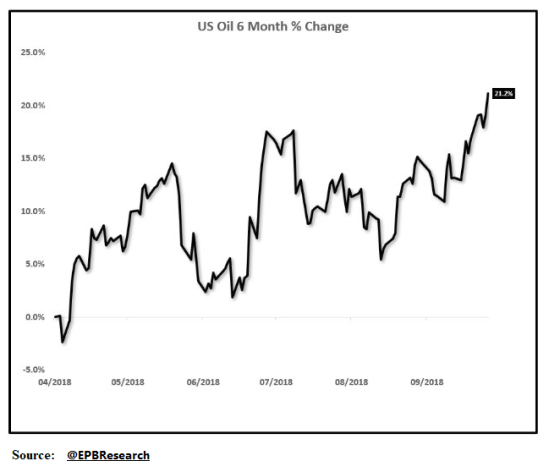
The price of crude futures denominated in dollars are up almost 20 percent since mid-August and 25 percent year-to-date.

CRUDE_EM_Currency

Posted in Crude Oil, Currency, Emerging Markets, Uncategorized | Tagged , , | 6 Comments

Kiril Sokoloff Interviews Stan Druckenmiller

Investment visionary Kiril Sokoloff is embarking on a series of exceptional interviews from his personal contacts for Real Vision. In the second episode of his series, he sits down with a revered titan of the investment world: Stanley F. Druckenmiller.

 Watch more Real Vision videos: http://po.st/RealVisionVideos

Subscribe to Real Vision on YouTube: http://po.st/RealVisionSubscribe


Posted in Video, Whales | Tagged , , , | 1 Comment

Get Shorty, Got Shorty, Still Shorty In 10-Year Notes

Interesting chart from Bloomberg on the growing record short position by specs in 10-year note futures.  Surprisingly,  there has been no meaningful squeeze in the 10-year during 2018, even with the massive equity volatility shock in early February.

In fact,  note prices fell and yields rose during that period, signaling, what we thought was the beginning of a stock bear market in the U.S., but we got our markets wrong.

It was a shot across the bow and precursor to this year’s huge sell-off in the emerging markets.

Treasury Futures

Source:  @lisaabramowicz1

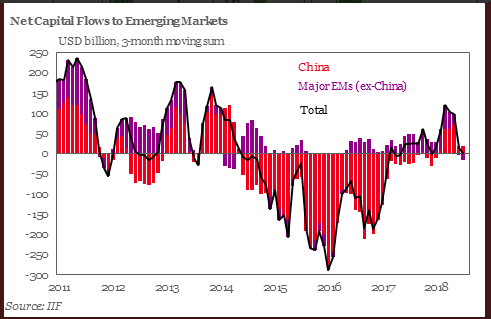
A reversal in emerging market capital flows began in April.

EM_Net Captial Flows

The 10-yield note yield has traded in a very narrow 35 bps range since mid-April, in spite of the large short position.  There is bad and trench warfare,  between the fading factors, which have kept rates low, and short bid keeping yields from breaking higher.

Note Yields

There has been some real selling in bonds, illustrated by the following chart of flows into and out of BlackRock’s $9.2 billion ultra-long U.S. Treasury ETF, which just had its largest one-day redemption since 2014.

TLT

Source:  @lisaabramowicz1

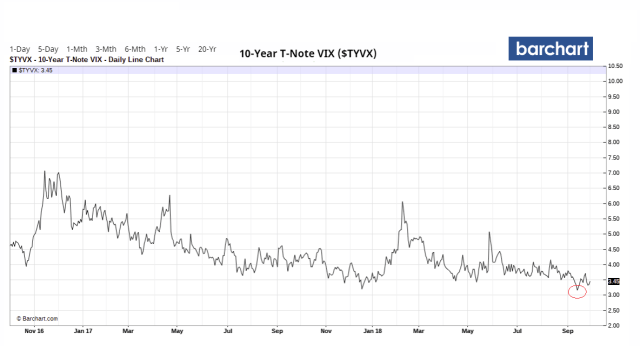
The volatility index on the 10-year note hit a new low on September 13th, which indicates, at least to us, yields are coiled to make a big move.

We believe most of the structural factors that have been holding long-term interest rates artificially low, and suppressing term premia are fading, and the next move in yields will be higher and quicker, once the 3.11-3.13 percent resistance level gives way.    That is just a chip shot away.

Note Vol

Nevertheless,  the Treasury yield curve has been distorted by central banks’ QE programs, making bonds very difficult to read and trade for many years.  Bond market vigilantes,  R.I.P..

Even the gross issuance of Treasury securities this year appear to illustrate the bias by policymakers to keep the 10-year note dear.

Gross Issue


We suspect it’s about to get interesting.   Stay tuned.

Posted in Bonds, Sovereign Debt, Uncategorized | Tagged | 6 Comments

NAFTA Gets The Shafta

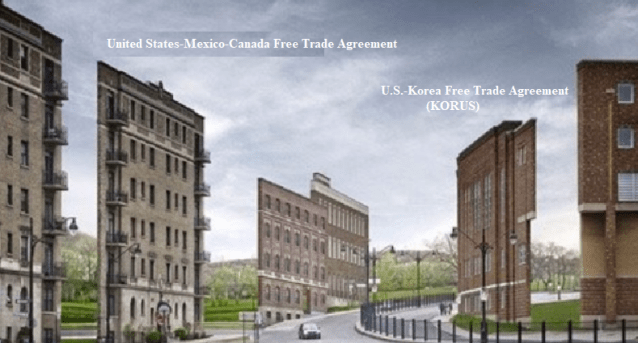
Scratch NAFTA and welcome in the United States-Mexico-Canada Agreement.

The Best Deal In History

Once again, sure to be spun as the “greatest trade deal in the history of the world,”  by both sides, for that matter,  but will not move the needle one iota in bringing jobs back to the United States.

Nafta_1

Trade deals between countries by their very nature do not do that.  They destroy jobs in one sector and create jobs in others, while boosting real incomes for the population as a whole with cheaper imported goods from the country with lower production costs.

The higher real incomes of the importing nation increases demand for domestic goods and services, which drives economic growth higher.

For example,  if I used to pay $5K for a Dell desktop computer and now pay only $1K for the same imported Dell computer (real world example), my real income increases $4K that I can now spend on other goods and services.  Such as, going out to the theatre and local diner, and leaving a bigger tip for the waitress.   

The U.S. workers who lost their jobs at the local Dell plant are hurt, and should receive compensation, either through income support and/or retraining, optimally paid by a tax on the gains from trade — i.e., the $4k saved. 

The U.S. does have a Trade Adjustment Assistance program but it falls woefully short with only about $600 million in annual expenditures.  Freaking peanuts.   

It makes no sense as the government is now offering farmers hurt by the trade war $12 billion in compensation.  Totally absurd.    

Sure, it’s good business practice to haggle over various tariffs, taxes,  and trade barriers, which are more often driven by domestic special interests, and we do commend the administration for trying.

But, let’s get real, folks, you either support free trade or you are  a mercantilist with the purpose to protect local industry from foreign competition.  The term “fair trade” is nothing more often a straw man.

We have no doubt the administration is driven by the latter.  Moreover, the nation’s trade deficit, which the president considers a rip-off by our trading partners is nothing more than a simple accounting identity driven by America’s savings deficit.

(S-I) + (T-G) = Current Account/Trade Balance (Foreign Savings)

 (S-I) is the ‘private savings balance’ or the difference between private sector savings (S) and investment (I); (T-G) is the ‘government balance’ or the difference between tax receipts (T) and all government expenditure (G); (X-M) is the difference between exports (X) and imports (M) and is usually called the simple ‘current account balance’.  – George Irvin

Our politicians, on both sides of the aisle, have failed those who have been hurt by trade, and it is one major reason why the nation is in the political mess it now stews.  President Trump and his base are not free traders, and we doubt they even understand the basis for trade among nations.


Trump Letter_2

Unfair 

What’s unfair, is to offer false hopes to those struggling in the rust belt by announcing a few cosmetic tweaks to the trade deals and then declaring victory.

Globalists Will Love Trump’s New Nafta Deal

Despite the fanfare, the agreement doesn’t change much.

…an emerging playbook for the Trump administration’s trade agreements. As with the revised U.S.-South Korea deal announced last week, the achievement is declared to be historic while the changes made are cosmetic. That dynamic bodes rather well for the U.S.-Japan bilateral talks announced last week, not to mention the simmering trade war with China. For the globalists so often bashed in Trump-era rhetoric – and this columnist would count himself among them – that’s good news.  — Bloomberg 

The rust belt needs a new Marshall Plan — more education,  and more opportunities provided by intense vocational retraining programs, coupled with income support for older workers who have little chance of recapturing their income and regaining new employment.

In addition, begin new, or bolster existing programs to deal with the opioid crisis ripping through the communities, which have been left behind by the global economy.  All these programs, in the form of beefed Trade Adjustment Assistance should be financed by taxes earmarked from the gains from trade as outlined above.

United States-Mexico-Canada Agreement

What we hear is the deal includes some badly needed updates and upgrades on some issues that needed updating, such IP, for example.  Sources also tell us  Chapter 19 remains “word for word” in the deal.  Justin also made the same concessions on dairy as Canada made in the TPP.    Milk products are a very small share of the trade between the two countries, about $360 million, or 0.06 percent of the two-way trade flows.

More Potemkin than real beef.  Or, as they say in Texas, “big hat, no cattle.”

At first glance, with our limited information,  our conclusions are the negotiations were a huge waste of time, energy, and diplomatic capital resulting in a nugacity of a new agreement.   High drama all for naught, in our opinion.

We reserve the right to be wrong, and to eat humble pie, if our first impressions are incorrect.   Still breaking.

Relief

Nevertheless, we are relieved and satisfied to let the administration declare another trade victory as the economic outcome could have been much worse.

Now on to China, where some real, and bigger issues need to be resolved.

Potemkin Mexico Canada Deal.png

Update.  Click here for latest on the USMCA.

Smoke And Mirrors

Dana Rodrik, the Harvard economist, confirms our first impression,

Trump’s New Nafta Pact Looks More Like a Rebranding Than a Revolution

Dani Rodrik, a Harvard University economist who has frequently railed against the same march of globalization that Trump has targeted, sees an elaborate illusion in the new Nafta.

“Trump is more interested in smoke and mirrors — the optics of striking a deal that seems advantageous to him — than in real changes in trade agreements,’’ Rodrik wrote in an email.

No revision to Nafta “will bring jobs back and restore health to those communities that were adversely affected,” he said. “The amount of political and negotiating capital that has been spent on it does not justify any of it,’’ he wrote.  – Bloomberg


Posted in Trade War, Uncategorized | 4 Comments

German 10-year At 47 bps As Inflation Prints 2.3 Percent

Really efficient markets, no?   The Germans  ECB loves a real 10-year negative carry.

This is absurd and tantamount to confiscating the savings of hard working Germans.  Only going to add to the country’s already rising political tensions.

As Holger notes, German interest rates should be around 5 percent according to the Taylor Rule.

Nevertheless, gotta play the hand you’re dealt.  Complaining ain’t gonna keep the lights on.   What a golden opportunity when the European bond market breaks.

Inflation cometh.

Posted in Bonds, Germany, Interest Rates, Sovereign Debt, Uncategorized | Tagged , | 5 Comments

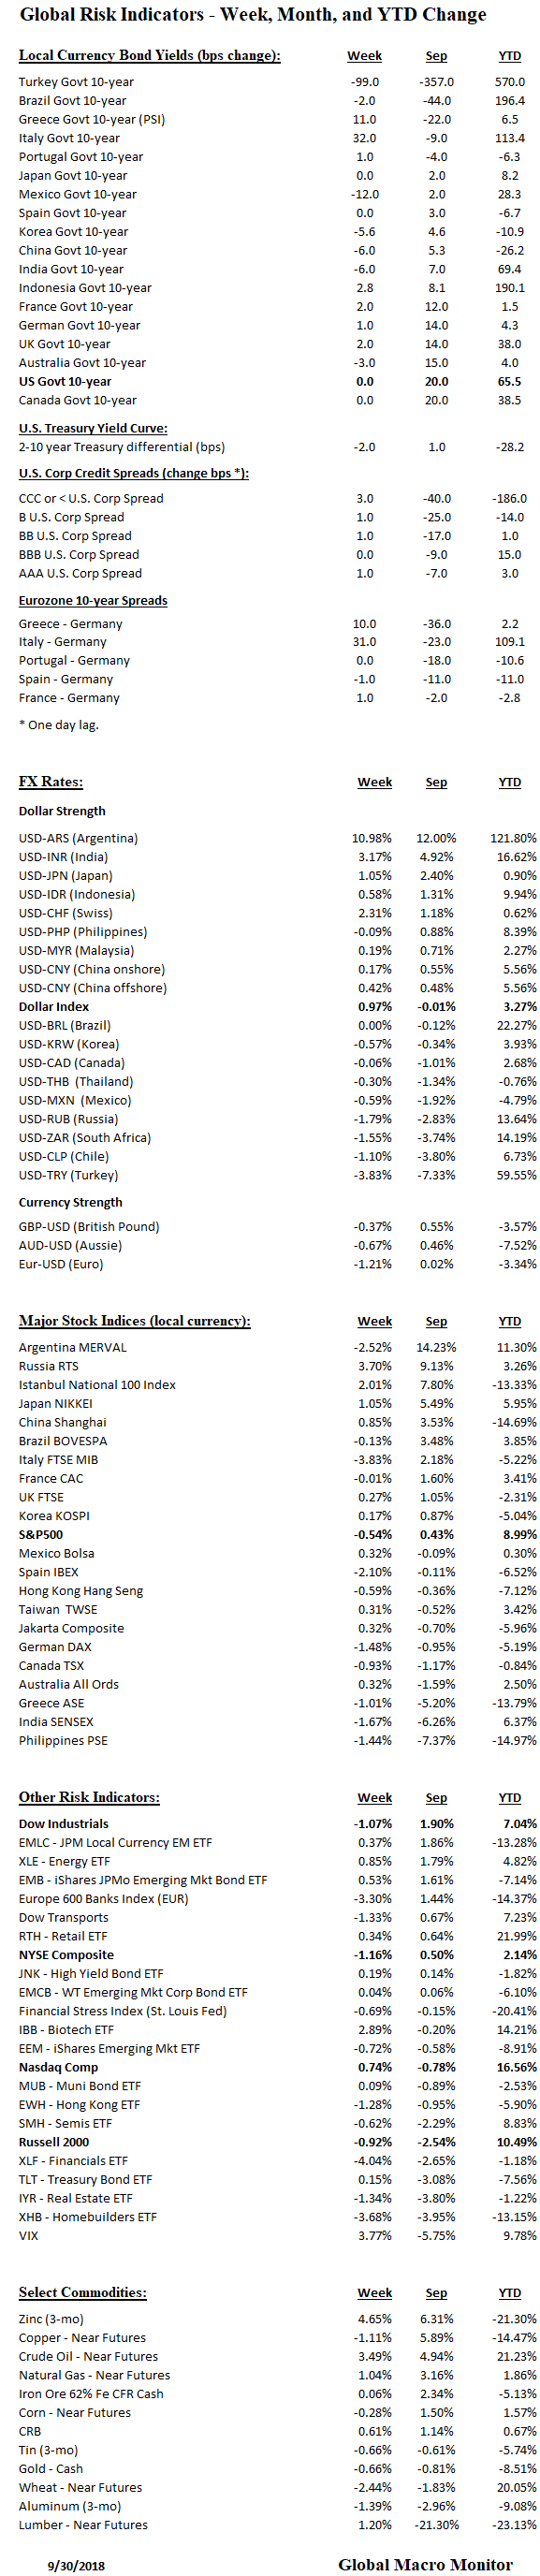
Month In Review – September

Summary

  • Q3 saw major carnage in the emerging markets with Argentina, Turkey, and India’s currency taking major hits
  • Big blowout in 10-year yields, though Turkish bonds rallied came in over 350 bps in September
  • The S&P was flat up 0.50 percent in September and 7.20 percent in Q3
  • U.S. credit remains strong
  • Euro periphery bonds had a good month, however, a tough close on Friday on worries over the Italian budget
  • The Nikkei up 5 ½ percent in September
  • China stocks bounced back
  • Indian and Philippine stocks down over 5 percent on the month
  • Dow up 1.9 percent, Russell down 2.5 percent in September
  • Crude oil futures up 5 percent on its march toward $80

Summary:  U.S. stocks and credit remain well bid.  U.S. equity market is  bolstered by the New Supply-Side, that is restricted supply as corporations continue to buyback shares, and a lack of real sellers.  Traders and ‘bots get short and are forced to cover as no real selling eventualizes.

Watch the lower-end of investment grade corporate credit as that is where the real supply is, and will probably come out first.  We fully expect interest rates to continue their march higher.  Emerging markets are tradeable on both sides, but expect pressure to continue as the Fed and Treasury continue to hoover up all the hot money in sight.

NAFTA deadline in a few hours.  Looks like another Potemkin deal gets done, which should lather up the markets for a few days.


Stock Supply


Week_Chart_1


Commodity_1


Commodity_2

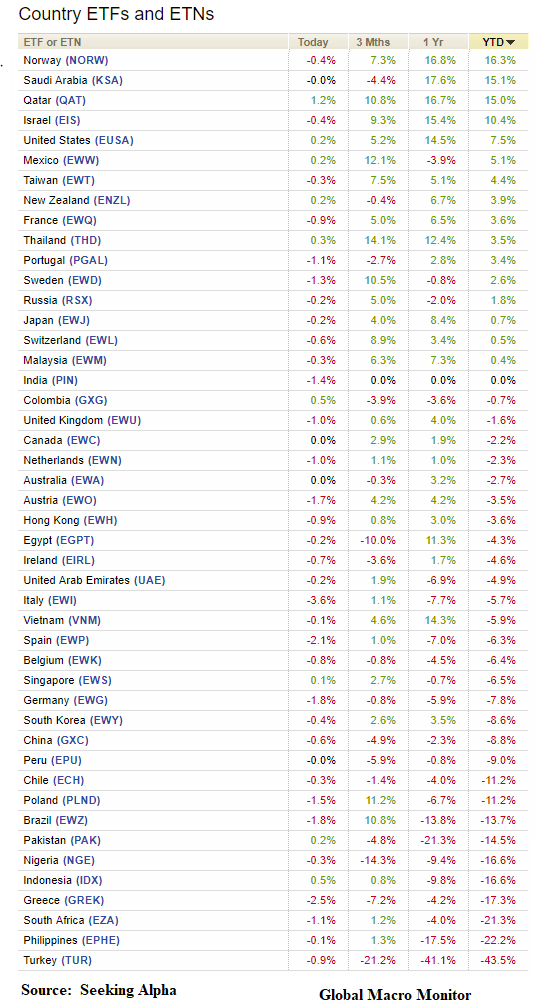
Ranked by YTD US$ return

Week_2018_ETFs


Ranked by September US$ Return 

Week_Table

Posted in Uncategorized | Leave a comment