Summary
- Friday’s payroll numbers were very good, slightly above the trend increase over the past 92 months, but does not live up to the hype
- Job creation during President Trump’s first 16 payroll reports is almost 500k lower than under President Obama, or 14 percent fewer jobs created
- Private sector job creation is 237k lower, or 7 percent fewer jobs created
- Lower job growth with stronger growth reflects increasing labor productivity and a tighter labor market
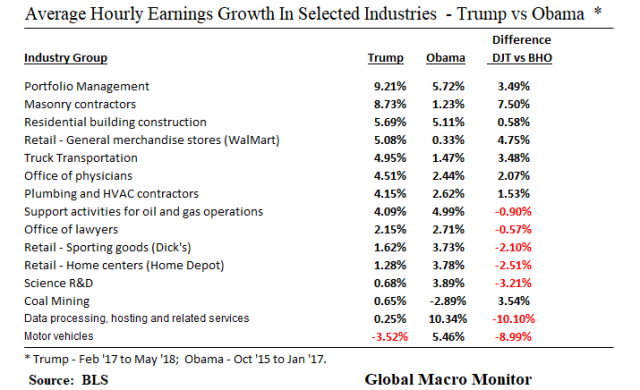
- Average hourly earnings have grown 3.58 percent under President Trump, slightly outpacing the previous administration’s sample by 11 bps
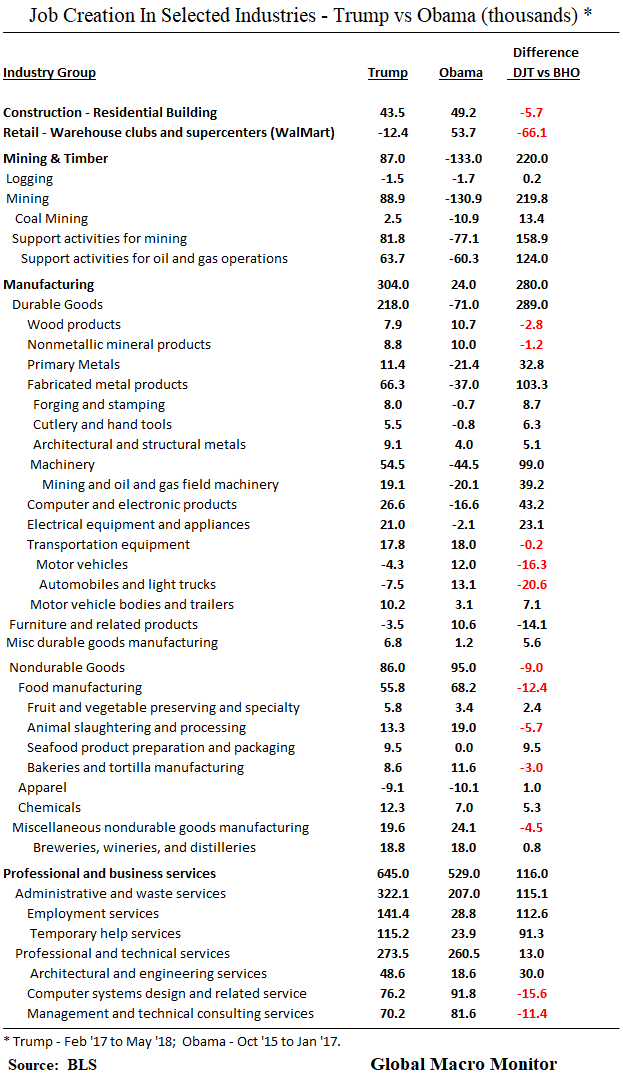
- Mining sector employment has rebounded sharply under President Trump, primarily the result of employment increases in support activities for oil and gas operations, much of which can be attributed to higher oil prices
- Employment gains in food manufacturing, and breweries and wineries make up 25 percent of the manufacturing job increases under President Trump
- Fabricated metals and machinery manufacturing total almost 60 percent of the jobs created in manufacturing over the past 16 months
- Portfolio managers, bricklayers, construction workers, truckers, plumbers, and WalMart workers are experiencing robust wage gains under President Trump, though retail warehouse clubs and supercenters have suffered job losses
- The jury is still out on the effects of the tax cut on employment but hardly lives up to the administration’s hype
Wow! That was one hot employment number on Friday, no? The best ever?
Here’s a tweet from the New York Times today citing a post on the paper’s TheUpshot blog. President Trump was all over it in his tweetfest today.
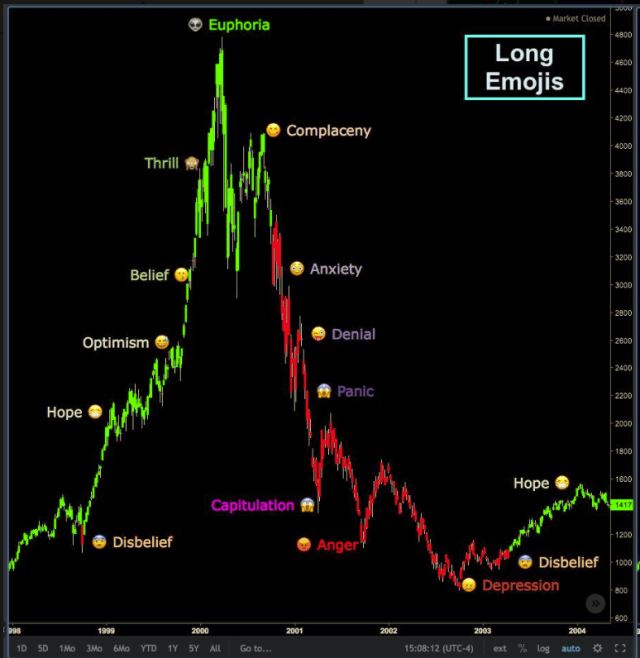
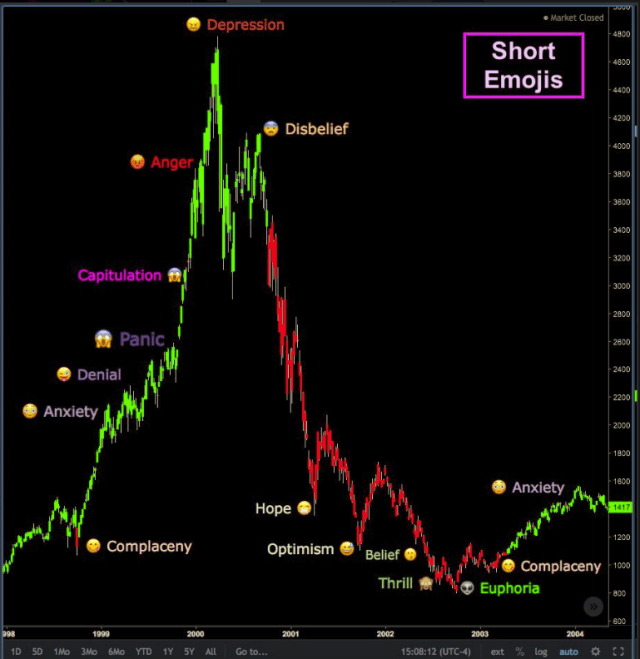
Yikes! Those euphoric headlines signal an economic top to us, they always do. Furthermore, they are completely absurd.
We perceive the Friday data as “this is about as good as it gets.”
How Good?
So, really, how good were the numbers? Relative to what, we ask?
In an absolute sense, the Friday’s jobs data were very good. They were extra tasty because the report outperformed expectations by 35k nonfarm payroll jobs. And who wouldn’t like a 3.8 percent unemployment rate?
The Trend Continues
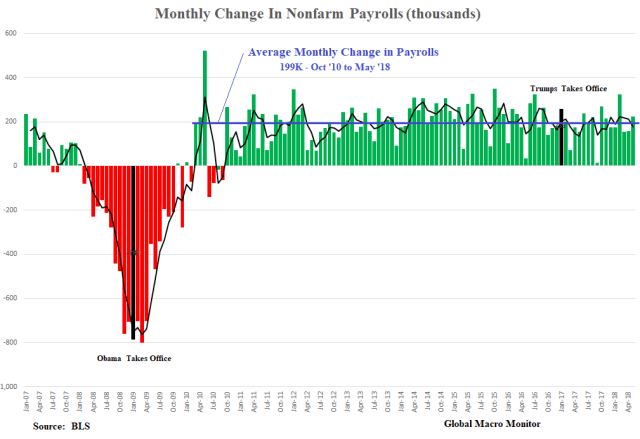
Relative to the almost eight-year trend of 92 straight months of positive job creation? Slightly above average.
The chart below illustrates Friday’s 223k increase in nonfarm payrolls was 24k above the 199k average monthly change of nonfarm payrolls since October 2010.
The sweet spot?
We worry the economy is starting to run up against labor constraints, and our concerns are magnified by the propensity or leanings of this administration to introduce distortions into the economy, such as trade tariffs. The sweet spot was during a period of more slack in the labor market.
President Trump’s Comps
Listen carefully to President’s Trump informal presser after his meeting with the North Korean spy chief on Friday, and you will hear his comparables are almost always relative to previous administrations. It is the case whether it on the economy or with respect to foreign policy.
Therefore we compare the data in President Trump’s first 16 payroll reports (February 2017 to May 2018) with the last 16 reports of President Obama’s administration (October 2015 to January 2017). Our analysis is an extension of last month’s comprehensive post, Deconstructing The U.S. Jobs Market.
Now we let the data speak.
Total Nonfarm Jobs Created
During the first 16 months of President Trump, the economy has created 2.966 million new jobs compared to President Obama’s 3.452 million, or 486k fewer jobs The private sector under President Trump has created 2.953 million jobs versus 3.180 million in the previous administration.
Even though the economy has grown almost 1 percent faster on an annual basis during the first five quarters under President Trump, job creation is lower. The positive is that the labor productivity must be increasing. However, it may be an indication the economy is also running up against labor constraints.
Average hourly earnings growth over the two 16-month periods have roughly been the same, with President Trump’s 3.58 percent earnings growth outperforming by 11 bps.

Industry Job Creation
Job creation during President’ Trump tenure has outperformed in 6 of the 13 private sector industries, most notably in the mining and the manufacturing sector.
Most of the recovery in the mining sector is the result of higher oil prices, and almost all the gains have occurred in support activities for oil and gas operations. This was the same sector that lost most of the mining jobs during the Obama sample due to an ugly bear market in crude oil.
President Trump’s economy has underperformed with respect to average hourly earnings growth in 9 of the 13 private sector industry groups. Wage growth in financial activities has significantly outperformed under Trump and all other sectors. The populist tension between Wall Street and Main Street continues.

Manufacturing and Mining
At a more micro level, almost 25 percent of the manufacturing job increases under President Trump has been in food manufacturing, and beer pubs and wineries. About 60 percent of manufacturing employment increases has been in fabricated metals and machinery.
There has been de minimis job creation in the poster children of manufacturing, such as the steel industry, and actual job losses in the auto industry.
Note also the 20k increase in oil and gas machinery, which reflects a further boost to job creation of high oil prices.
However, a higher oil price is a zero-sum game as it reduces employment in other sectors, primarily related to the consumer, as real incomes decline. We estimate the average driver will pay an additional $400 per year for gas if prices remain up here, which consumes almost of the net income gain from the tax cuts.
There have been only 2,500 new coal mining jobs created under President Trump but this does represent a reversal of the job losses under President Obama.
Who Is Getting A Raise?
The following table illustrates the average hourly earnings increase in various industry groups. Portfolio managers and their entourage are happy as are bricklayers, construction workers, truck drivers and plumbers who are experiencing robust wage growth.
The 5 percent average hourly earnings growth at general merchandise stores, such as WalMart, the largest private sector employer in many states, corresponds with a 12.4k loss in jobs at warehouse clubs and supercenters (see above table). This either indicates a very tight labor market, the impact of minimum wage increases, social and political pressures on wages, technology, and the Amazon effect, or all of the above.
The auto worker continues to get hammered. It could be one reason why President Trump is taking such a hard line in the NAFTA negotiations, and an indicator that compromise is not going to be an option.
Tax Cuts
Finally, we take a quick look at the macroeconomic impact of the tax cut.
Thus far, it is mixed, and hardly lives up to the hype we see some in administration touting. It is still early in the game, however.
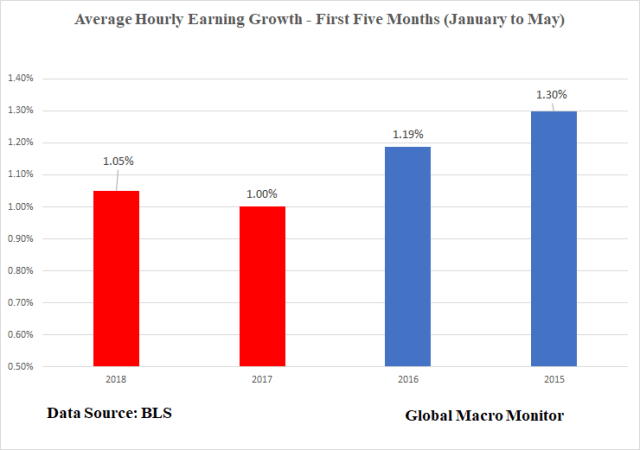
Nevertheless, job growth in the first five months of 2018 is doing better than the prior two years, but lower than 2015. Average hourly earnings growth, though higher than the first five months of 2017, is lower than the last two years of the Obama administration.