
Facts do not matter anymore. Opinions are now facts. We truly live in dangerous times.
Reagan And Trump Stock Market
We were stunned by an article posted on the CNBC website over the weekend, The Trump stock market looks a lot like Ronald Reagan’s, Ralph Acampora says – and that may mean trouble.
Are you fricking kidding me? Nothing could be further from the truth.
The Reagan market looks like the Trump market? The Trump S&P500 is almost 40 percent above the Reagan S&P after 365 trading days from the election.
We do agree on the last part of the headline that stocks are headed for trouble, however.

Presidents And Stock Markets
We pride are ourselves as students of presidential stock market cycles. We have posted several pieces on stock market returns during presidential terms over the many years. See here and here and here.
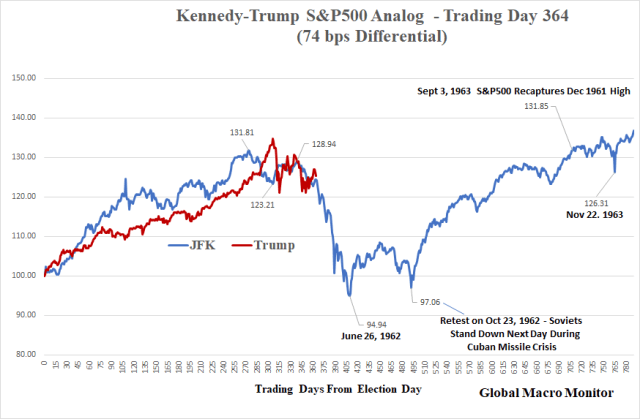
JFK-Trump S&P500 Analog
Our latest venture has been constructing and tracking the stunningly tight JFK-Trump S&P500 analog. We did not just stumble upon the analog with a feeling or a religious epiphany, randomly deciding to “overlay two charts on top of each other” (a common criticism of analogs) but we crunched 70 years of data searching for similar volatility shocks to the one the market experienced in early February.
We found three: 1) The Eisenhower heart attack in 1955; 2) the 1987 stock market crash, and 3) the 1962 “Kennedy Slide” or bear market. We dismissed the Eisenhower shock as it did not even lead to an official correction, and the 1987 bear market — peak to trough — was over in just 39 days.

Is The Trump Market Similar To The Reagan Market?
Absurd. Take a look at the data in the first analog and you decide.
The JFK-Trump analog is only 84 bps points apart with respect to price-performance 365 trading days after the election whereas the Reagan-Trump analog illustrates an almost 40 percent divergence.

(Click here for interview)
We love Ralph, but we are having trouble reconciling his comments to CNBC.
“In fact, if you look at the chart you will see Ronald Reagan had a six-month honeymoon. It lasted…I think the percentage gain was roughly about ten percent.” – Ralph Acampora
Ralph seems to refer to the Dow instead of the S&P, so we included it in the analog.
As the chart illustrates, Reagan’s S&P500 peaked 18 days after election day, rising 8.9 percent bolstered by the surprise November 4th electoral landslide. The S&P then fell 27.15 percent over the next 430 trading days, bottoming on August 12, 1982.
The Reagan bull market ignited that August day, taking the S&P500 up over 61 percent through 1983 and 179.86 percent by the end of his two terms.
Much of the stock volatility during the first 18 months of Mr. Reagan’s first term was due to very tight monetary policy, a deep recession, and volatile interest rates.
On election day, for example, the yield on the 10-year was 12.46 percent. The yield continued to rise, finally peaking at 15.84 percent on September 30, 1981, almost a year before the economy emerged from recession and the August 1982 stock market bottom.
Reagan’s Tailwinds, Trump’s Headwinds
We posted a piece in December 2016 comparing the macro initial conditions between the Reagan and Trump administrations on the eve of their presidencies, Reagan v Trump Macro Initial Conditions, listing several indicators, including monetary, oil prices, and demographics. Our conclusion was a Reagan-like bull market is very unlikely during Trump’s tenure.
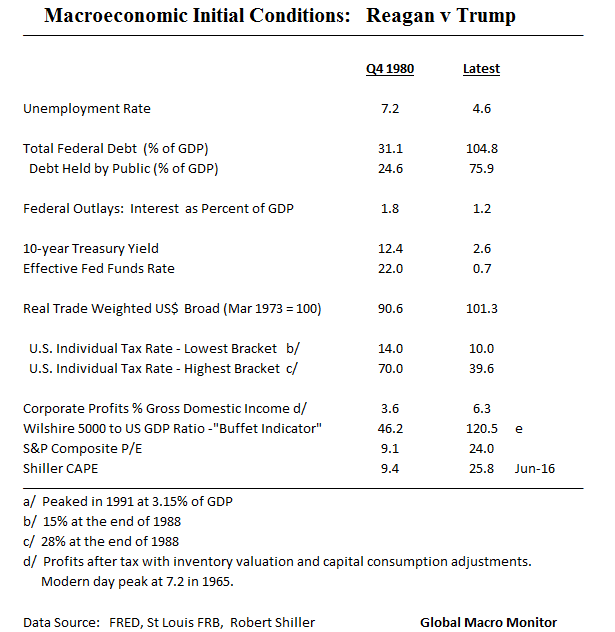
President Reagan also got his recession out of the way early in his administration
Segue To North Korea
Finally, this exercise reminds me of conversations I have had with friends about the upcoming U.S.-North Korea summit. As you have probably read, we are worried the U.S. is going to be played by the NorKo’s and Chinese like the dueling banjos in Deliverance.
What always comes up is whether President Trump’s hardline and bluster toward Kim Young Un has worked and brought North Korea to the table. I have tried to present the facts, as, say, a CIA desk officer at the U.S. embassy in South Korea (still without an U.S. Ambassador, BTW) would.
Sure, I have my biases and confess I’m not a big fan of President Trump’s policies or his behavior.
But here are the facts:
In the first eleven months of the Trump Administration, the North Koreans engaged in twenty missile tests, some nuclear, compared to only eight during the entire two terms of President Obama.
During Trump’s first year in office, North Korea conducted more than twice as many ballistic missile tests (20) as it did during the first year of Barack Obama’s presidency (8). – Foreign Affairs
I maintain the president’s bluster and the painting of many red lines baited Kim into mocking and ultimately crossing them, twenty times, to be exact. Two of the six missiles fired by the North Koreans over Japan occurred in 2017.
It was during these last missile and weapons tests, North Korea probably obtained their big nuke and ICBM delivery system.
Kim is now finally prepared for nuclear chastity. That is after the hermit kingdom has lost its thermonuclear virginity.
North Korea has promised to end all its atomic and missile tests – but experts warned last night that the dramatic pledge may mean the rogue state has already perfected its nuclear weapons system.
Dictator Kim Jong Un’s surprise announcement comes prior to a planned summit with President Donald Trump next month.
But while some have greeted the offer as a welcome sign of peace, a leading ex-CIA analyst said the Communist despot may have already achieved his ambition of creating a weapons system capable of hitting any target in the US. – Daily Mail
North Korea now comes to the table stronger than ever and most likely with some sort of secret deal in pocket with the Chinese.
Without equivocating, it’s fair to say that both the declarations on nuclear testing and on halting the tests of ICBMs are significant concessions. Specifically, Kim announced that North Korea will “discontinue nuclear testing” and that the Punggye-ri site will be “dismantled to transparently guarantee the discontinuance of the nuclear test [sic].” On ICBMs, Kim simply said that no “inter-continental ballistic rocket test-fire” would take place after April 21, 2018.
While significant, we shouldn’t be fooled into thinking that these concessions are being made out of a position of weakness or as a necessary show of bona fide goodwill to South Korea and the United States before the upcoming summits. Kim’s rationale for doing away with the nuclear test site was to underline that North Korea had already successfully come up with the nuclear weapons designs it needed. – Daily Beast
There were many articles over the weekend on the wisdom of even holding the summit.
White House privately skeptical of North Korea’s plans to freeze nuclear testing – Washington Post
Mr. Kim’s moves are also unsettling officials in the U.S., Japan and China. Some suspect he is merely posturing in advance of the meeting, as well as before a separate one with South Korea’s president. Others worry that his gestures could put Mr. Trump on the defensive in the grinding negotiations over the future of North Korea’s nuclear weapons. – NY Times
Trump tempers expectations on North Korea – Politico
Both leaders go into the meeting impulsive, unprepared, and the U.S. is way understaffed in its expertise and professional diplomatic corps.
Moreover, both sides don’t even seem to be in the same zip code in terms of perspective, motive, and expectations.
The North Koreans seem to believe that their nuclear breakthroughs forced Mr. Trump to accede to a leaders’ summit meeting, something they have long desired as a way to prove themselves a peer of the major powers.
But American officials have said Mr. Kim was the one forced to the table, compelled there by American sanctions and military threats.
North Korea’s statements suggests that the country sees itself as on the verge of forcing the world to accept it as it is, finally securing its long-term survival.
– NY Times
Let’s just say we are not expecting a Reagan-Gorbachev breakthrough.
By the way, our friends seem to think Trump deserves the Nobel Prize based on their feelings, fantasies, and the spin that is swirling about the ether and Twittersphere.
We sincerely hope they are correct, but we fear disaster based on our observation of the facts. Both sides are about to engage in a high-wire act without a safety net.
Has the market priced the risk?
And the Reagan stock market is the Trump stock market.



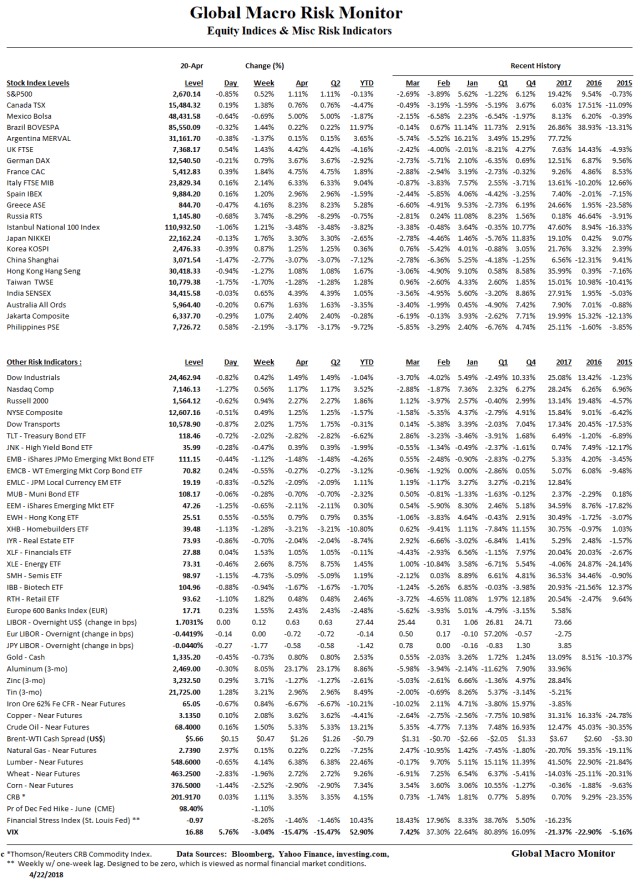


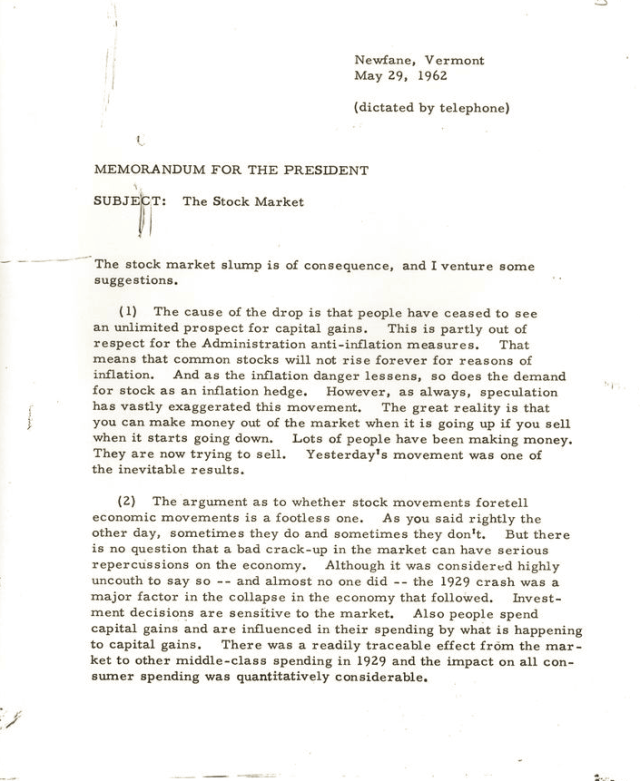


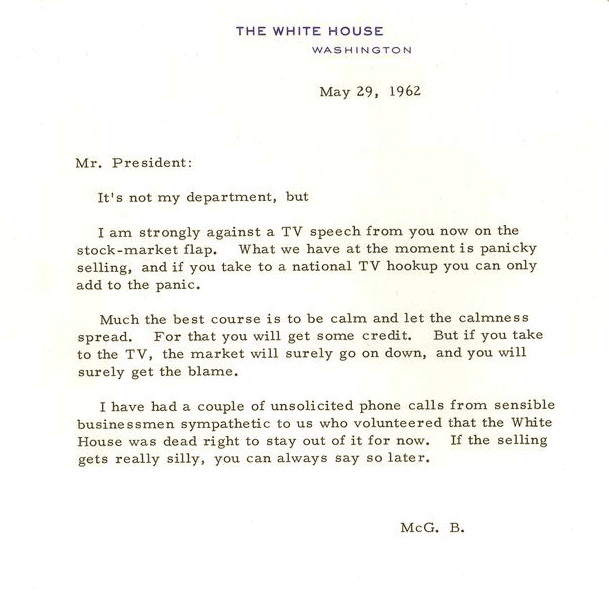

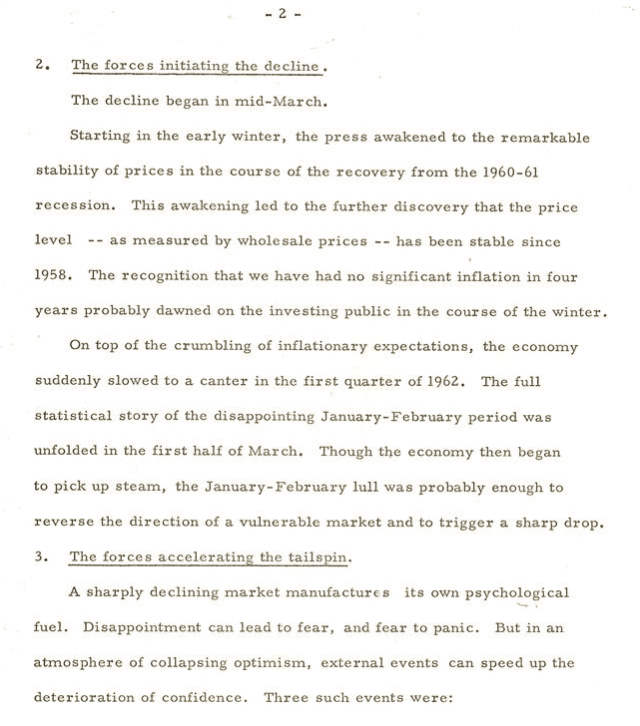



President Reagan On The ’87 Stock Market Crash
President Reagan certainly understood the nature of markets.
That is they do whatever they are going to do, sometimes without a fundamental rhyme or reason. Very different from the current occupant of the White House who seems to think every uptick in the S&P is all about him, and he is not afraid to take credit for the upside and tweet about it.
Before going to President Reagan’s comments about the October 19, 1987 stock market crash, we first review some data, which lends light on the 1987 crash.
The S&P500 had just completed a massive run from September 1985 before peaking on August 25, 1987, moving up almost 87 percent in less than two years. That qualifies as a bubble in our view.
Yuuuge Decline In Interest Rates
Much of the move was attributed to a sharp drop in interest rates.
The 10-year Treasury yield fell almost 350 bps in less than a year before making a local bottom in September 1986. Interest rates then began to move sharply higher, utterly roundtripping almost the entire move by the day of the crash.
The 10-year yield had risen 300 bps year-to-date on October 16th, closing back above 10 percent, increasing almost 150 bps just since the S&P peaked on August 25th.
The S&P500 was already down 16.33 percent from its high before crashing on October 19th. Markets rarely fall out of the sky and usually signal something big is coming by a sharp rise in volatility. Think of a Richter scale before a volcano blows.
This is why we take the early February volatility shock seriously and a signal of regime change, and give a much higher probability for a potential major price reversal than most in the market are anticipating.
Finally, the S&P500 fell 23.43 percent from the October 16th Friday close to the intraday low on Tuesday before a mysterious buyer stepped into to the Major Market Index futures contract at 12:38 p.m, setting the stage for one of the most powerful rallies in history.
We believe the 1987 stock market crash was an accident waiting to happen due mainly to a toxic cocktail of a severely overbought market and rising interest rates. All that was needed was a buyers strike coupled with some catalysts or reasons to bail and take profits. The same reasons may or may not have mattered if not for such a toxic cocktail.
Given the nature of the New Economy, we seriously doubt the government will allow such a similar short-term crash, say, 15-25 percent, to occur again. We now have no doubt the Fed will step up and announce they will do whatever it takes and become the buyer of last resort to keep the market from melting down in one or two days.
Why? Because it would be the end of the world and they surely know it.
The thought of the Fed directly purchasing stocks as the Bank of Japan now does contradicts everything Larry Kudlow’s dictum, “free market capitalism is the best path to prosperity” stands for.
Privatizing profits and socializing major Wall Street losses are now forever institutionalized especially given the structure of our asset driven global economy. The “Powell put” may now have a little lower strike price than many traders would like but it is absolutely still in place. No doubt about it.
Oy veh! Sorry deflationistas.
Iran Again
By the way, the U.S. was also in the midst of a conflict with Iran in October 1987.
President Reagan’s Comments
Now to President Reagan.
Asked after the close if the stock market crash was his fault, the President delivers the ultimate money quote, in our book:
Profound. We can learn from the Gipper to refrain from trying to explain or attribute daily stock market moves to certain factors. Any one of the catalysts we deem moved the market in a certain direction on a given day could have moved it 180 degrees the other way with a different set of technical conditions.
Reagan truly understood market noise.
Full Transcript Of October 19, 1987 Informal Exchange With The Press
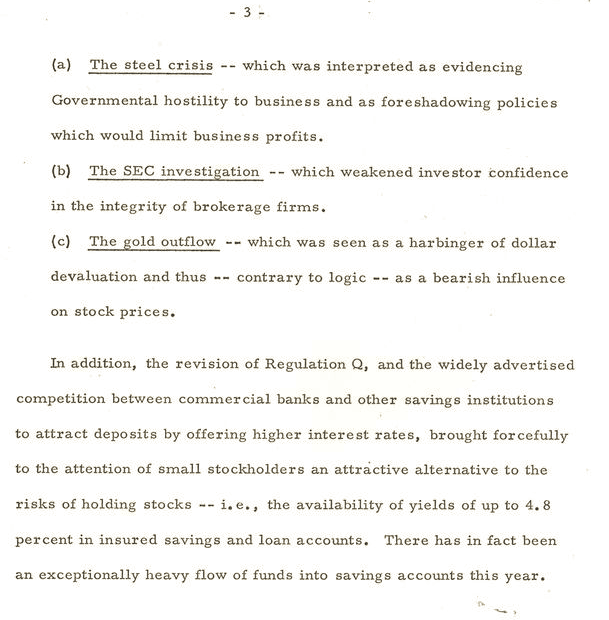
Here is the full transcript with reporters that day, October 19, 1987.